-
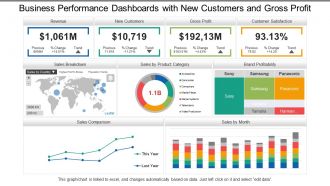 Business Performance Dashboards Snapshot With New Customers And Gross Profit
Presenting, business performance dashboards Snapshot with new customers and gross profit PowerPoint ideas for your ease. Information based slides, creating an impact on the viewer, can be used by specialists from any background, entrepreneurs, and scholars. Engaging and editable font style, type, text design and the content of the icons or the PPT slides. Full-screen view choice available and can be transformed into the desired format. Compatible with Google Slides. Open in widescreen size 16:9 after downloading.
-
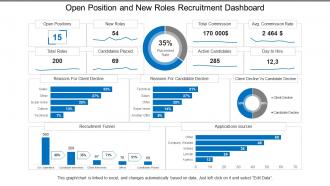 Open position and new roles recruitment dashboard
Presenting this set of slides with name - Open Position And New Roles Recruitment Dashboard. This is a three stage process. The stages in this process are Staffing Plan, Recruitment, Staff Management.
-
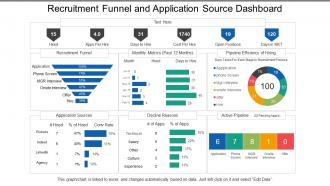 Recruitment funnel and application source dashboard
Presenting this set of slides with name - Recruitment Funnel And Application Source Dashboard. This is a three stage process. The stages in this process are Staffing Plan, Recruitment, Staff Management.
-
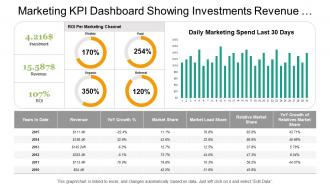 Marketing kpi dashboard showing investments revenue metrics details
Presenting marketing kpi dashboard showing investments revenue metrics details presentation template slide. The PPT template is very user friendly as it allows you to make numerous changes to the editable slides. You can amend the font size, font style and also the font color as per your requirements. Template slide can be downloaded quickly and cab be saved in format of PDF or JPG easily. The template slide after being downloaded can be viewed in large screen display ratio of 16:9 or standard size display ratio of 4:3.
-
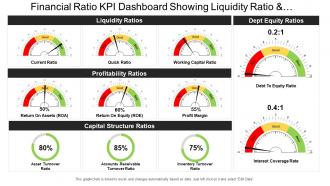 Financial ratio kpi dashboard snapshot showing liquidity ratio and profitability ratio
Presenting this set of slides with name - Financial Ratio Kpi Dashboard Snapshot Showing Liquidity Ratio And Profitability Ratio. This is a three stage process. The stages in this process are Accounting Ratio, Financial Statement, Financial Ratio.
-
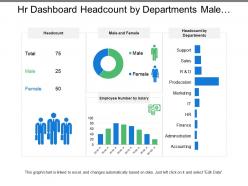 Hr dashboard headcount by departments male and female
Presenting this set of slides with name - Hr Dashboard Headcount By Departments Male And Female. This is a three stage process. The stages in this process are Hr Dashboard, Human Resource Dashboard, Hr Kpi.
-
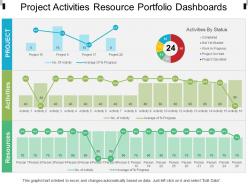 Project activities resource portfolio dashboards
Pre-designed project activities resource portfolio dashboards PPT template. Beneficial for managers, professors, marketers, etc. Flexible option for conversion in PDF or JPG formats. Available in Widescreen format also. Useful for making business plan and strategies. Can also be used with Google slides. Replace the images, text and the content in the slide design. Change the size, style and orientation of the slides. Use your company’s name or brand name to make it your own presentation template.
-
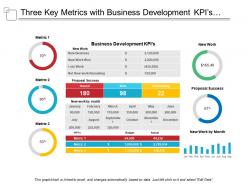 Three key metrics with business development kpis and proposal success
Presenting this set of slides with name - Three Key Metrics With Business Development Kpis And Proposal Success. This is a three stage process. The stages in this process are Key Metrics, Key Performance Indicator, Kpi.
-
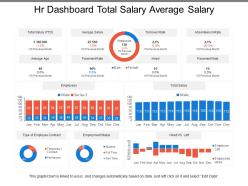 Hr dashboard total salary average salary
Presenting this set of slides with name - Hr Dashboard Total Salary Average Salary. This is a three stage process. The stages in this process are Hr Dashboard, Human Resource Dashboard, Hr Kpi.
-
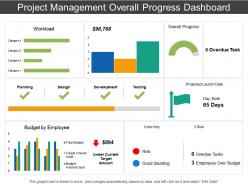 Project management overall progress dashboard
Preference to amend and personalize the PPT slide by adding business details i.e. name, logo, image or even tag line. Quick download and can be shared with large audience. Staggering balance colors, font and shape. Comparable Presentation design comes with different nodes and stages. Familiar with Google slides and easy to alter into JPEG and PDF.PPT diagram can be shared in both standard and widescreen view depending upon your requirement. High resolution and tremendous quality PowerPoint template
-
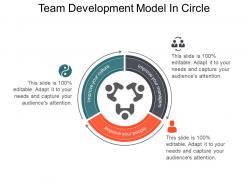 Team development model in circle
Presenting the Team Development Model In Circle PPT visual which is designed professionally for your convenience. This template is adaptable with Google Slides which makes it easily accessible at once. You can save your presentation in various formats like PDF, JPG, and PNG. Customize the colors, fonts, font size, and font types of the slide as per your requirements. Freely access the slide in both 4:3 and 16:9 aspect ratio.
-
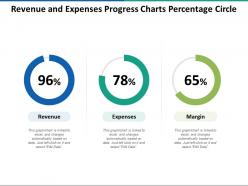 Revenue and expenses progress charts percentage circle
Presenting this set of slides with name - Revenue And Expenses Progress Charts Percentage Circle. This is a three stage process. The stages in this process are Percentage Circle, Percentage Round, Pie Chart.
-
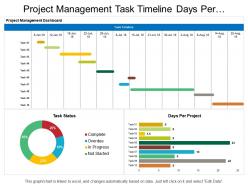 Project management task timeline days per project dashboard
Introducing project management task timeline days per project dashboard PPT template. Access to convert the presentation design into JPG and PDF. Offer 100% access to change the values, size and style of the slides once downloaded and saved in the desired format. High quality charts, images and visuals used in the designing process. Choice to get presentation slide in standard or in widescreen view. Easy to convert in JPEG and PDF document. Compatible with Google slides. Easy and hassle-free downloading process.
-
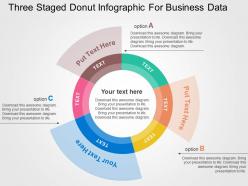 Three staged donut infographic for business data flat powerpoint design
Fine Picture quality used in the designing. Perfectly blend with other software programs such as JPG and PDF. Easy access to modify the PPT visual as color, text and layout amendable. Stress free consideration of organization's customized content. High determination slide demonstrate. Presentation image can be demonstrated in both standard and widescreen view. Appropriate for business data analyst team, corporate presentation experts, finance and accounts managers as well as executives.
-
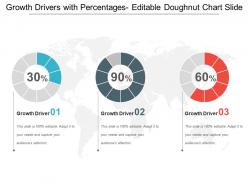 Growth drivers with percentages editable doughnut chart slide
Presenting a PPT template named Growth drivers with percentages editable doughnut chart slide. This template is professionally designed and is completely editable. The Font color, Font size, Font style, background color and color of the diagram can be altered as per your suitability. The text in the template can be rewritten and replaced with your desired content. The slide is totally compatible with Google slides and can be easily saved in JPG or PDF format. You can customize the template conveniently by changing the data in excel sheet, as this template is Excel-linked. Editable icons make the presentation more presentable. Download it now to make a hassle free presentation.
-
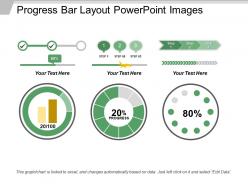 Progress bar layout powerpoint images
You can download this PPT completely free of cost. You just have to edit the data in a pre-designed format and present it. You can insert fonts and icons to this ready-made slide. All these slides are fully compatible with Google Slides. This presentation can be downloaded in JPG and PDF formats. It can be viewed in the 16:9 ratio widescreen size and the ratio of 4:3 standard screen size.
-
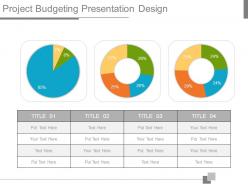 Project budgeting presentation design
Presenting project budgeting presentation design. This is a project budgeting presentation design. This is a three stage process. The stages in this process are project, budgeting, finance, strategy, marketing, management.
-
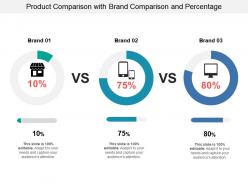 Product comparison with brand comparison and percentage
Presenting this set of slides with name - Product Comparison With Brand Comparison And Percentage. This is a three stage process. The stages in this process are Business Swot Analysis, Product Comparison And Competitive Landscape, Competitive Analysis, Swot Analysis Competitor Comparison.
-
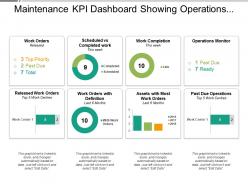 Maintenance kpi dashboard showing operations monitor and past due operations
Presenting this set of slides with name - Maintenance Kpi Dashboard Showing Operations Monitor And Past Due Operations. This is a three stage process. The stages in this process are Maintenance, Preservation, Conservation.
-
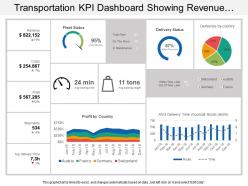 Transportation kpi dashboard snapshot showing revenue costs profit fleet status
Presenting KPI dashboard snapshot showing revenue costs profit fleet status slideshow. Change PowerPoint structure, font, text, color and design as per your requirements. Easy to input data with excel linked charts, just right to click to input data. This presentation theme is totally attuned with Google slides. Easy conversion to other software’s like JPG and PDF formats. Image quality of these PPT diagram remains the unchanged even when you resize the image or portray on large screens.
-
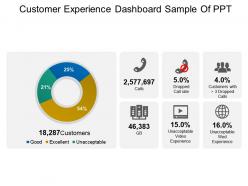 Customer experience dashboard snapshot sample of ppt
Presenting customer experience dashboard snapshot sample of PPT. This PPT slide offers you plenty of space to put in titles and sub titles. High resolution-based presentation layout does not change the image even after resizing. This presentation icon is fully compatible with Google slides. Quick downloading speed and simple editing options in color text and fonts.PPT icons can easily be changed into JPEG and PDF applications. This diagram has been designed for entrepreneurs, corporate and business managers.
-
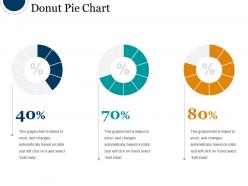 Donut pie chart powerpoint slide presentation examples
Presenting Donut Pie Chart PowerPoint Slide Presentation Examples which is completely editable. Open and save your presentation in various formats like PDF, JPG, and PNG. This template is compatible with Google Slides which makes it easily accessible at once. This slide is available in both 4:3 and 16:9 aspect ratio. Alter the font, color, font size, and font types of the slides as per your needs.
-
 Budget forecast showing income of the various months and savings
Presenting this set of slides with name - Budget Forecast Showing Income Of The Various Months And Savings. This is a three stage process. The stages in this process are Budget Forecast, Forecast Vs Actual Budget, Plan Vs Forecast.
-
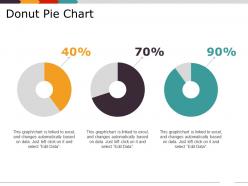 Donut pie chart presentation design
Presenting Donut Pie Chart Presentation Design PowerPoint slide. Easy to download PPT layout and can be saved in different formats like JPG, PDF and PNG. This PowerPoint slide is completely editable so you can modify, font type, font color, shape and image according to your requirements. This Google Slides compatible PPT is available in 4:3 and 16:9 aspect ratios.
-
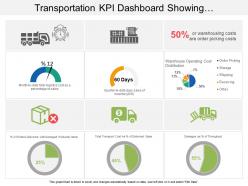 Transportation kpi dashboard snapshot showing warehouse operating cost distribution
Presenting transportation KPI dashboard snapshot showing warehouse operating cost distribution PPT slide. Simple data input like company logo, name or trademark. User can edit the data in linked excel sheet and graphs and charts gets customized accordingly. Picture quality of these slides does not change even when project on large screen. Fast downloading speed and formats can be easily changed to JPEG and PDF applications. This template is suitable for marketing, sales persons, business managers and entrepreneurs.
-
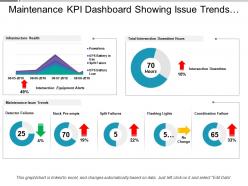 Maintenance kpi dashboard showing issue trends and infrastructure health
Presenting this set of slides with name - Maintenance Kpi Dashboard Showing Issue Trends And Infrastructure Health. This is a three stage process. The stages in this process are Maintenance, Preservation, Conservation.
-
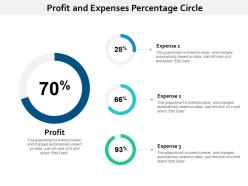 Profit and expenses percentage circle
Presenting this set of slides with name - Profit And Expenses Percentage Circle. This is a three stage process. The stages in this process are Percentage Circle, Percentage Round, Pie Chart.
-
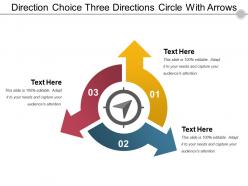 Direction choice three directions circle with arrows
Presenting direction choice three directions circle with arrows. This is a direction choice three directions circle with arrows. This is a three stage process. The stages in this process are direction choice, one to many, direction option.
-
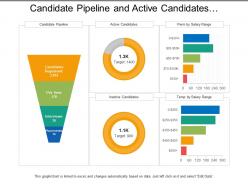 Candidate pipeline and active candidates recruitment dashboard
Presenting this set of slides with name - Candidate Pipeline And Active Candidates Recruitment Dashboard. This is a three stage process. The stages in this process are Staffing Plan, Recruitment, Staff Management.
-
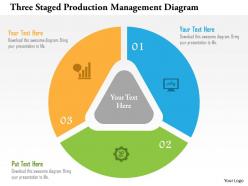 Three staged production management diagram flat powerpoint design
Runs extremely smooth and jitter-free on related software. PowerPoint images are of high resolution. Projection on widescreen doesn’t let PPT graphics to be pixelated. Fluent download of PPT slides. Further customize slide by inserting your company’s logo, trademark. Add titles and sub titles at will with no space constraints. Compatible with Google slides. Useful for startups, businesses and project management.
-
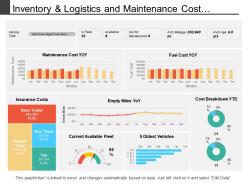 Inventory and logistics and maintenance cost dashboard
Presenting this set of slides with name - Inventory And Logistics And Maintenance Cost Dashboard. This is a three stage process. The stages in this process are Inventory And Logistics, Inventory Management, Warehousing And Inventory Management.
-
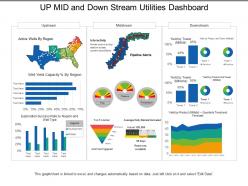 Up mid and down stream utilities dashboard
Presenting this set of slides with name - Up Mid And Down Stream Utilities Dashboard. This is a three stage process. The stages in this process are Utilities, Use, Advantage.
-
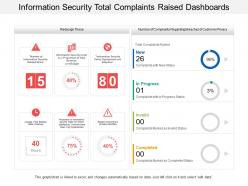 Information security total complaints raised dashboards
Presenting this set of slides with name - Information Security Total Complaints Raised Dashboards. This is a three stage process. The stages in this process are Information Security Strategy, Information Security Plan, Information Protection Strategy.
-
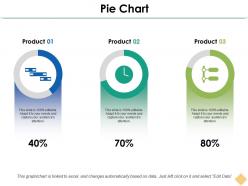 Pie chart ppt inspiration
Presenting this set of slides with name - Pie Chart Ppt Inspiration. This is a three stage process. The stages in this process are Business, Management, Strategy, Analysis, Icons.
-
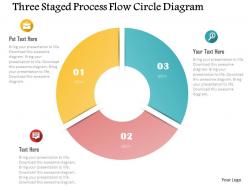 0115 three staged process flow circle diagram powerpoint template
Amazingly and innovatively created PowerPoint visual. Quick download and easy to share with large set of viewers. Convenience to modify the content as per the corporate requisite. PPT graphic accessible with different nodes and stages. Alternative to add business details such as icon, image or text. Flexible presentation design as smoothly convertible into JPG and PDF format. Slide downloadable in standard and widescreen display view.
-
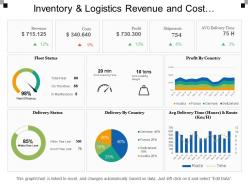 Inventory and logistics revenue and cost dashboards
Presenting this set of slides with name - Inventory And Logistics Revenue And Cost Dashboards. This is a three stage process. The stages in this process are Inventory And Logistics, Inventory Management, Warehousing And Inventory Management.
-
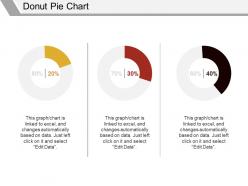 Donut pie chart powerpoint presentation
Presenting Donut Pie Chart Powerpoint Presentation PowerPoint slide. You can change the color, font size, font type and shapes of this PPT layout according to your needs. This PPT template is compatible with Google Slides and is available in both 4:3 and 16:9 aspect ratios. This ready to use PowerPoint presentation can be downloaded in various formats like PDF, JPG and PNG.
-
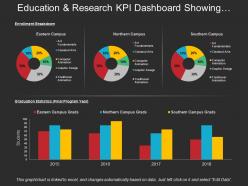 Education and research kpi dashboard snapshot showing enrolment breakdown
Presenting education and research KPI dashboard snapshot showing enrolment breakdown PPT slide. The student enrolment dashboard PowerPoint slide designed by the professional team of SlideTeam. The enrolment page KPI report template is fully editable in PowerPoint. The research enrolment KPI report PPT template is compatible with Google Slide so a user can share this enrolment dashboard slide with others. A user can make changes in the font size, font type, color as well as dimensions of the campus and college dashboard slide as per the requirement. You may edit the value in the enrollment reporting system dashboard template as the slide gets linked with the Excel sheet.
-
 Employees who leave within first 6 months powerpoint shapes
Presenting employees who leave within first 6 months powerpoint shapes. This is a employees who leave within first 6 months powerpoint shapes. This is a three stage process. The stages in this process are employees left job within the first 6 months, felt their boss was a jerk, work was different than they expected, changed their mind on work type.
-
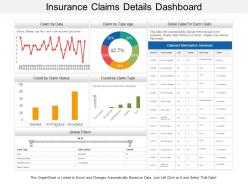 Insurance claims details dashboard
Presenting this set of slides with name - Insurance Claims Details Dashboard. This is a three stage process. The stages in this process are Assurance, Surety, Insurance.
-
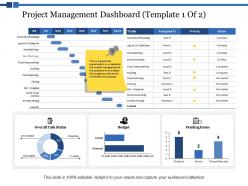 Project management dashboard final resource plan ppt powerpoint presentation styles objects
This is a three stages process. The stages in this process are Finance, Marketing, Management, Investment, Analysis.
-
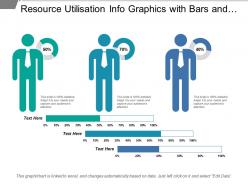 Resource utilisation info graphics with bars and graphs
Presenting this set of slides with name - Resource Utilisation Info Graphics With Bars And Graphs. This is a three stage process. The stages in this process are Resource Management, Resource Utilization, Resource Allocation.
-
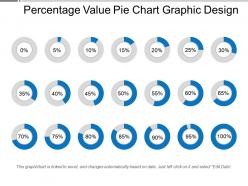 Percentage value pie chart graphic design ppt background
Presenting percentage value pie chart graphic design PPT background PPT slide. PPT has high resolution impressive visuals. No fear of image pixelation when projected on widescreen. 100 percent editable slide design background. Ease of executing changes. Guidelines for carrying out changes have been provided. PPT is compatible with numerous online and offline software options. It is compatible with multiple format options like JPEG/JPG and PNG. It is compatible with Google Slides, Windows and Mac. Ease of personalization with company specific name, logo and trademark. Used by market analyst, business analysts, students and teachers.
-
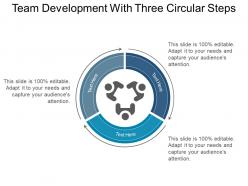 Team development with three circular steps
Presenting team development with three circular steps. This is a team development with three circular steps. This is a three stage process. The stages in this process are team development model, team building model, team development framework.
-
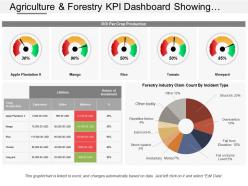 Agriculture and forestry kpi dashboard showing roi per crop production and industry claim count
Presenting agriculture and forestry KPI dashboard showing ROI per crop production and industry claim count PowerPoint slide. Unaffected high-resolution PowerPoint slide. Include or exclude slide content as per your individual need. Personalize the presentation with individual company name and logo. Beneficial for industry professionals, managers, executives, researchers, sales people, etc. This template is available in both Standard and Widescreen slide size. Easy and quick downloading process. Flexible option for conversion in PDF or JPG formats. Compatible with Google slides.
-
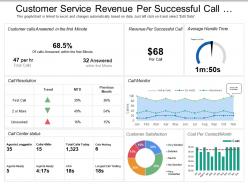 Customer service revenue per successful call dashboard
Presenting this set of slides with name - Customer Service Revenue Per Successful Call Dashboard. This is a three stage process. The stages in this process are Customer Base, Recurring Customers, Customer Services.
-
 Transportation kpi dashboard snapshot showing fleet delivery status loading time and weight
Presenting transportation KPI dashboard snapshot showing fleet delivery status loading time and weight PPT slide. Simple data input with linked Excel chart, just right click to input values. This PowerPoint theme is fully supported by Google slides. Picture quality of these slides does not change even when project on large screen. Fast downloading speed and formats can be easily changed to JPEG and PDF applications. This template is suitable for marketing, sales persons, business managers and entrepreneurs.
-
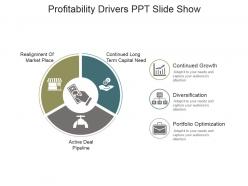 Profitability drivers ppt slide show
Presenting profitability drivers ppt slide show. This is a three stage process. The stages in this process are realignment of marketplace, continued long term capital need, active deal pipeline, continued growth, diversification portfolio optimization.
-
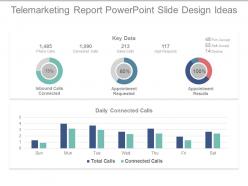 Telemarketing report powerpoint slide design ideas
Presenting telemarketing report powerpoint slide design ideas. This is a telemarketing report powerpoint slide design ideas. This is a three stage process. The stages in this process are phone calls, connected calls, sales calls, appt requests, phone calls, connected calls, sales calls, appt requests, inbound calls, connected, appointment requested, appointment results, daily connected calls.
-
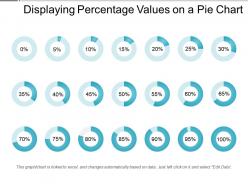 Displaying percentage values on a pie chart powerpoint templates
Introducing pie chart PowerPoint template. They are highly enriched PowerPoint template. They are conveniently flexible into different compositions like PDF, XML, and JPG etc. They have immensely trait features .They have quite amusing Presentation graphic design which provides enthralling experience to viewers. They have revise able vector based PPT layout, forms, shades, and icons. This PPT design provides enough storage space.
-
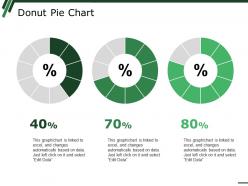 Donut pie chart ppt summary background images
Presenting Donut Pie Chart PPT Summary Background Images PPT slide. The donut design template designed by the professional team of SlideTeam to present the numerical data. The fully editable donut pie chart PowerPoint slide is compatible with Google Slide. You can modify the font size, font type, color, and shape of the donut design as the pie chart template can help a user in processing the data. You can insert the text related to the sales distribution of your organization. Numerous customized icons available at SlideTeam website, you can download and insert icons in your presentation.
-
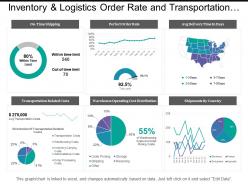 Inventory and logistics order rate and transportation costs dashboards
Presenting this set of slides with name - Inventory And Logistics Order Rate And Transportation Costs Dashboards. This is a three stage process. The stages in this process are Inventory And Logistics, Inventory Management, Warehousing And Inventory Management.
-
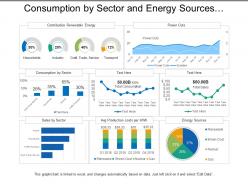 Consumption by sector and energy sources utilities dashboard
Presenting this set of slides with name - Consumption By Sector And Energy Sources Utilities Dashboard. This is a three stage process. The stages in this process are Utilities, Use, Advantage.
-
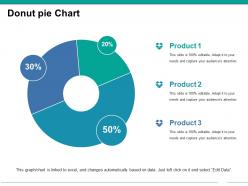 Donut pie chart ppt images
Presenting this set of slides with name - Donut Pie Chart Ppt Images. This is a three stage process. The stages in this process are Business, Marketing, Planning, Finance, Donut.
-
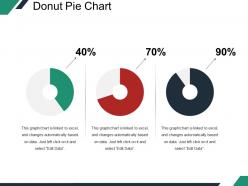 Donut pie chart ppt background
Presenting Donut Pie Chart PPT Background. This PPT presentation is Google Slides compatible hence it is easily accessible. You can download and save this PowerPoint layout in different formats like PDF, PNG, and JPG. This PPT theme is available in both 4:3 and 16:9 aspect ratios. This PowerPoint template is customizable so you can modify the font size, font type, color and shapes as per your requirements.
-
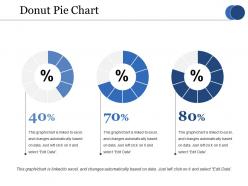 Donut pie chart ppt portfolio summary
Presenting this set of slides with name - Donut Pie Chart Ppt Portfolio Summary. This is a three stage process. The stages in this process are Percentage, Finance, Donut, Business.
-
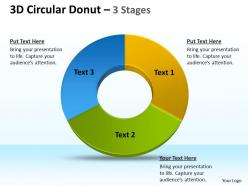 3d circular donut 3 stages 3
This template is skillfully designed and is completely editable to suit all the needs and requirements of the user. The color of the font, its size, style, and all other elements can be customized according to the user's desire The text in the PPT placeholder can be replaced with the desired information making this template highly flexible and adaptable as well. This template is also compatible with various Microsoft versions and formats like Google Slides, JPG, PDF, etc so the user will face no issue in saving it in the format of his choice.
-
 Operation automation icons powerpoint slides
Highlighting operation automation icons PowerPoint slide. Presentation diagram is flexible with most software like JPG and PDF. Exceptional picture quality design comes with high resolution picture as pixels never break even on wide screen. PPT template is easy to download and save. Presentation visual goes well with Google Slides. Availability to add company details such as name, logo and tagline. Fully modifiable PowerPoint design as color, text and font can be modified easily.
-
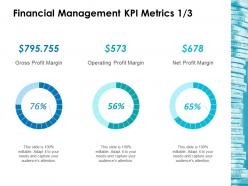 Financial management kpi metrics 1 3 ppt layouts backgrounds
Presenting this set of slides with name - Financial Management Kpi Metrics 1 3 Ppt Layouts Backgrounds. This is a three stage process. The stages in this process are Business, Management, Strategy, Analysis, Marketing.
-
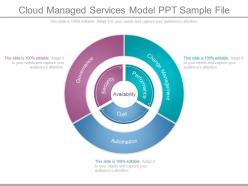 Cloud managed services model ppt sample file
Presenting cloud managed services model ppt sample file. This is a cloud managed services model ppt sample file. This is a three stage process. The stages in this process are change management, automation, governance, performance, cost, security.
Toggle Nav

Skip to Content

Search
5
Notifications 5
-
 See what the world is downloading for a kickass presentation. Check out our most popular products and get inspired.
1 hour ago
-
 SlideTeam added 1190 new products (e.g. Completely Researched Decks, Documents, Slide Bundles, etc), which included 15470 slides in total in the past 24 hours.
6 hours ago
-
 SlideTeam has published a new blog titled "Must-have Software Development Contract Template with Examples and Samples".
1 day ago
-
 SlideTeam has published a new blog titled "Top 10 Quality Improvement In Nursing Examples With Templates And Samples".
1 day ago
-
 SlideTeam has published a new blog titled "Top 7 Board Roles And Responsibilities Templates with Examples and Samples".
1 day ago


