-
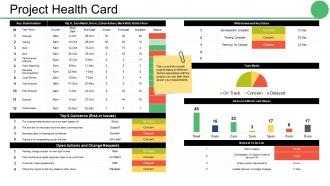 Project health card ppt gallery rules
Presenting health card PPT gallery rules. This layout is fully compatible with Google slides and data driven. User can edit the data in linked excel sheet and graphs and charts gets customized accordingly. Easy to put in company logo, trademark or name; accommodate words to support the key points. Images do no distort out even when they are projected on large screen. Adjust colors, text and fonts as per your business requirements
-
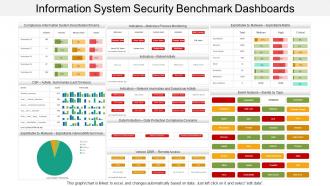 Information system security benchmark dashboards
Presenting this set of slides with name - Information System Security Benchmark Dashboards. This is a three stage process. The stages in this process are Information Security Strategy, Information Security Plan, Information Protection Strategy.
-
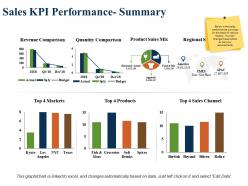 Sales kpi performance summary revenue comparison product sales mix
Presenting this set of slides with name - Sales Kpi Performance Summary Revenue Comparison Product Sales Mix. This is a three stage process. The stages in this process are Revenue Comparison, Quantity Comparison, Product Sales Mix, Regional Sales Mix, Top Sales Channel.
-
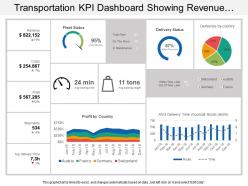 Transportation kpi dashboard snapshot showing revenue costs profit fleet status
Presenting KPI dashboard snapshot showing revenue costs profit fleet status slideshow. Change PowerPoint structure, font, text, color and design as per your requirements. Easy to input data with excel linked charts, just right to click to input data. This presentation theme is totally attuned with Google slides. Easy conversion to other software’s like JPG and PDF formats. Image quality of these PPT diagram remains the unchanged even when you resize the image or portray on large screens.
-
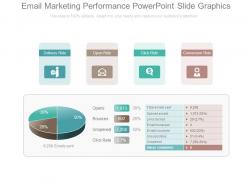 Email marketing performance powerpoint slide graphics
Presenting email marketing performance PowerPoint template. Access to convert the presentation design into JPG and PDF. Offer 100% access to change the size and style of the slides once downloaded and saved in the desired format. High quality charts, images and visuals used in the designing process. Choice to get presentation slide in standard or in widescreen view. Easy to convert in JPEG and PDF document. Compatible with Google slides. Easy and hassle free downloading process.
-
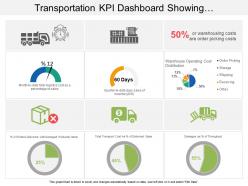 Transportation kpi dashboard snapshot showing warehouse operating cost distribution
Presenting transportation KPI dashboard snapshot showing warehouse operating cost distribution PPT slide. Simple data input like company logo, name or trademark. User can edit the data in linked excel sheet and graphs and charts gets customized accordingly. Picture quality of these slides does not change even when project on large screen. Fast downloading speed and formats can be easily changed to JPEG and PDF applications. This template is suitable for marketing, sales persons, business managers and entrepreneurs.
-
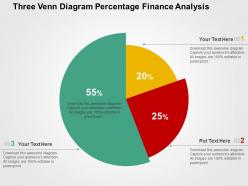 Three venn diagram percentage finance analysis flat powerpoint design
Presentation slide graphic of for financial analysis. Can be used by marketers, students, professors, sales people, business analysts, etc. Compatible with number of software options. Colors and text can be easily changed as the PPT slide is completely editable. Personalize the presentation with individual company name and logo. Available in both Standard and Widescreen slide size. Easy and quick downloading process.
-
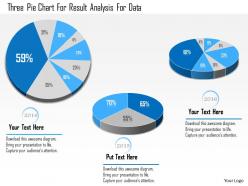 1114 three pie chart for result analysis for data powerpoint template
We are proud to present our 1114 three pie chart for result analysis for data powerpoint template. Display the concept of result analysis with this Power Point template slide. This PPT slide contains the graphic of three pie chart . This PPt slide can be used for business and sales data related analysis.
-
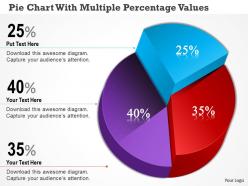 Bm pie chart with multiple percentage values powerpoint template
Straightforward download in quick and easy steps. Fully editable text as per your need and no limits on title or subtitle length. PPT infographics with absolutely modifiable size and orientation. Converts seamlessly into PDF or JPG format and runs with any software. Insert your company name, trademark, logo, tagline etc.
-
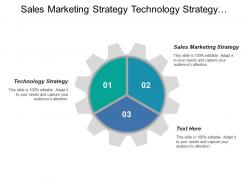 Sales marketing strategy technology strategy financial strategy brand associations
Presenting this set of slides with name - Sales Marketing Strategy Technology Strategy Financial Strategy Brand Associations. This is an editable three stages graphic that deals with topics like Sales Marketing Strategy, Technology Strategy, Financial Strategy, Brand Associations to help convey your message better graphically. This product is a premium product available for immediate download, and is 100 percent editable in Powerpoint. Download this now and use it in your presentations to impress your audience.
-
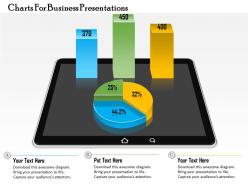 0714 business consulting charts for business presentations powerpoint slide template
We are proud to present our 0714 business consulting charts for business presentations powerpoint slide template. Emphatically define your message with our above diagram. Clarity of thought has been the key to your growth. Use this diagram to provide multiple options for taking in and making sense of information. Deliver amazing presentations to mesmerize your audience.
-
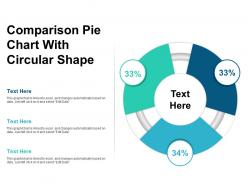 Comparison pie chart with circular shape
Presenting Comparison Pie Chart With Circular Shape. Customize this slide as per your wants. You are free to make any change in this slide. Alter the colors, font type, and font size according to your requirement. This template can be converted and saved in various formats, including PDF and JPG formats. Increase or decrease the size of the icon. Download this in standard screen and widescreen.
-
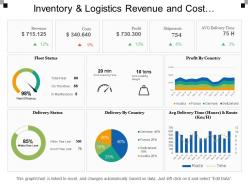 Inventory and logistics revenue and cost dashboards
Presenting this set of slides with name - Inventory And Logistics Revenue And Cost Dashboards. This is a three stage process. The stages in this process are Inventory And Logistics, Inventory Management, Warehousing And Inventory Management.
-
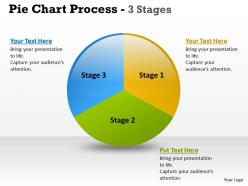 Pie chart process 3 stages 1
Fine quality, high resolution PPT icons. Bright coloured PPT graphics for a vibrant visual impact. Additional template for insertion o coveted image. Hassle free conversion into varied formats. Compatible with multiple info graphic software. Beneficial for professionals, manager and students from various field.
-
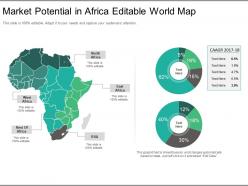 Market potential in africa editable world map ppt model
Presenting market potential in africa editable world map ppt model. This is a market potential in africa editable world map ppt model. This is a three stage process. The stages in this process are north africa, east africa, rsa, rest of africa, west africa.
-
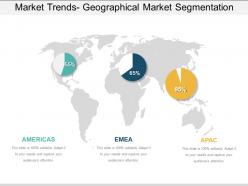 Market trends geographical market segmentation ppt example
Presenting market trends geographical market segmentation ppt example. This is a market trends geographical market segmentation ppt example. This is a three stage process. The stages in this process are americas, emea, apac.
-
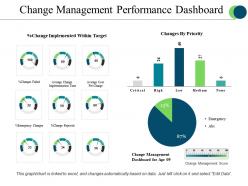 Change management performance dashboard powerpoint slide designs
Presenting change management performance dashboard powerpoint slide designs. This is a change management performance dashboard powerpoint slide designs. This is a three stage process. The stages in this process are critical, high, low, medium, none.
-
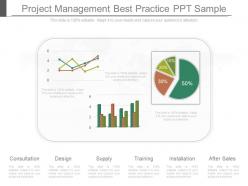 Present project management best practice ppt sample
Presenting present project management best practice ppt sample. This is a project management best practice ppt sample. This is a three stage process. The stages in this process are consultation, design, supply, training, installation, after sales.
-
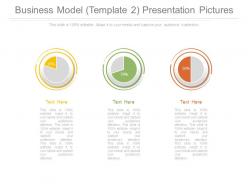 Business model template 2 presentation pictures
Presenting business model template 2 presentation pictures. This is a business model template 2 presentation pictures. This is a three stage process. The stages in this process are business, percentage, marketing, success, strategy.
-
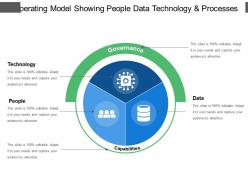 Operating model showing people data technology and processes
Presenting this set of slides with name - Operating Model Showing People Data Technology And Processes. This is a three stage process. The stages in this process are Operating Model, Enterprise Architecture, Business Model.
-
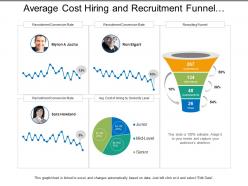 Average cost hiring and recruitment funnel dashboard
Presenting this set of slides with name - Average Cost Hiring And Recruitment Funnel Dashboard. This is a three stage process. The stages in this process are Staffing Plan, Recruitment, Staff Management.
-
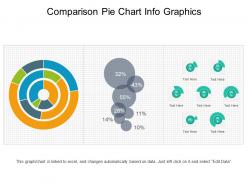 Comparison pie chart info graphics
Presenting Comparison Pie Chart Info Graphics PPT slide. Easy to download PPT layout can be opened and saved in formats like JPG, PDF and PNG. You can modify the graphs, font size, font color and shape as per your requirements. The PowerPoint template is compatible with Google Slides. Also, the pie chart in the PPT slide is linked to Excel and changes accordingly with the data.
-
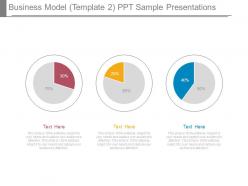 Business model template 2 ppt sample presentations
Presenting business model template 2 ppt sample presentations. This is a business model template 2 ppt sample presentations. This is a three stage process. The stages in this process are business, percentage, marketing, strategy, process.
-
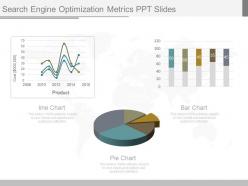 New search engine optimization metrics ppt slides
Presenting new search engine optimization metrics ppt slides. This is a search engine optimization metrics ppt slides. This is a three stage process. The stages in this process are cost, prodect, line chart, pie chart, bar chart.
-
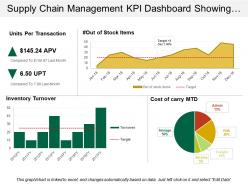 Supply chain management kpi dashboard showing units per transaction
Presenting predesigned Supply Chain Management KPI Dashboard Showing Warehouse Operating Costs PPT slide. Download of the template design is simple. You can modify the layout font type, font size, colors and the background as per needs. Template slide is fully flexible with Google Slides and other online software’s. You can alter the design using the instructional slides provided with the template. You can remove the watermark with your brand name, trademark, signature or logo. You can save the template into PNG or JPEG formats. Supreme quality layouts are used to create this template which is editable in PowerPoint. Sample content can be replaced with your presentation content.
-
 Transportation kpi dashboard snapshot showing fleet delivery status loading time and weight
Presenting transportation KPI dashboard snapshot showing fleet delivery status loading time and weight PPT slide. Simple data input with linked Excel chart, just right click to input values. This PowerPoint theme is fully supported by Google slides. Picture quality of these slides does not change even when project on large screen. Fast downloading speed and formats can be easily changed to JPEG and PDF applications. This template is suitable for marketing, sales persons, business managers and entrepreneurs.
-
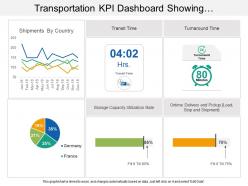 Transportation kpi dashboard showing shipments by country and transit time
Presenting transportation KPI Dashboard showing shipments by country and transit time PPT slide. This deck offers you plenty of space to put in titles and subtitles. This template is Excel linked just right click to input your information. High resolution based layout, does not change the image even after resizing. This presentation icon is fully compatible with Google slides. Quick downloading speed and simple editing options in color text and fonts.PPT icons can easily be changed into JPEG and PDF applications
-
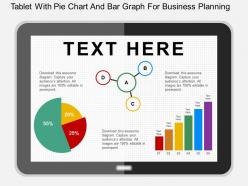 Hi tablet with pie chart and bar graph for business planning flat powerpoint design
Presenting hi tablet with pie chart and bar graph for business planning flat powerpoint design. This Power Point template diagram has been crafted with graphic of tablet, pie chart and bar graph. This PPT diagram contains the concept of business planning representation. Use this PPT diagram for business and marketing related presentations.
-
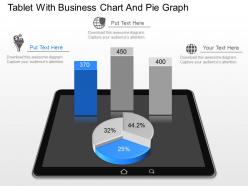 Gp tablet with business chart and pie graph powerpoint template
Presenting gp tablet with business chart and pie graph powerpoint template. This Power Point template diagram has been crafted with graphic of tablet, pie graph and business chart. This PPT diagram contains the concept of business problem analysis and agile management representation. Use this PPT diagram for business and marketing related presentations.
-
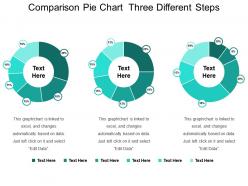 Comparison pie chart three different steps
Presenting comparison pie chart three different steps. This is a comparison pie chart three different steps. This is a three stage process. The stages in this process are comparison pie chart, ratio pie chart, analogy pie chart.
-
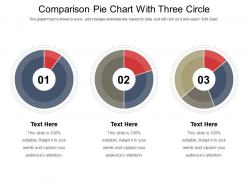 Comparison pie chart with three circle
Presenting comparison pie chart with three circle. This is a comparison pie chart with three circle. This is a three stage process. The stages in this process are comparison pie chart, ratio pie chart, analogy pie chart.
-
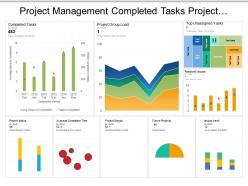 Project management completed tasks project group load dashboard
Preference to present design in standard and widescreen display view. PowerPoint design is goes well with Google slides. Fine quality Presentation template comes with editing options as color, text and font can be edited at any stage. Present the PPT slide by addition of business logo. Fast download and simple transform into JPEG and PDF document. Presentation design is downloadable with different nodes and stages. PowerPoint diagram comes with high resolution pixels.
-
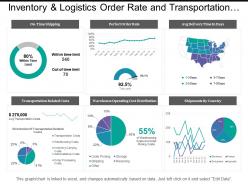 Inventory and logistics order rate and transportation costs dashboards
Presenting this set of slides with name - Inventory And Logistics Order Rate And Transportation Costs Dashboards. This is a three stage process. The stages in this process are Inventory And Logistics, Inventory Management, Warehousing And Inventory Management.
-
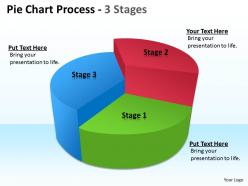 Pie chart process 3 stages
This template is skillfully designed and is completely editable to suit all the needs and requirements of the user. The color of the font, its size, style, and all other elements can be customized according to the user's desire The text in the PPT placeholder can be replaced with the desired information making this template highly flexible and adaptable as well. This template is also compatible with various Microsoft versions and formats like Google Slides, JPG, PDF, etc so the user will face no issue in saving it in the format of his choice.
-
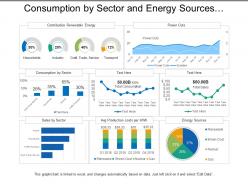 Consumption by sector and energy sources utilities dashboard
Presenting this set of slides with name - Consumption By Sector And Energy Sources Utilities Dashboard. This is a three stage process. The stages in this process are Utilities, Use, Advantage.
-
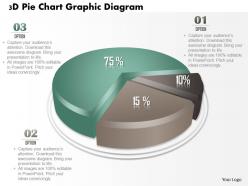 0714 business consulting 3d pie chart graphic diagram powerpoint slide template
We are proud to present our 0714 business consulting 3d pie chart graphic diagram powerpoint slide template. A 3d pie chart graphic is used to design this diagram. Display result analysis by using this 3d pie chart graphic diagram in your business presentation.
-
 0115 pie chart and magnifier for performance indication powerpoint template
Ideal for marketing professionals, business managers, entrepreneurs and big organizations. This presentation theme is totally attuned with Google slide. Easy conversion to other software’s like JPG and PDF formats. Image quality remain the unchanged even when resize the image. Change PowerPoint design’s font, text, color and design as per your manner. Easy to put in company logo, brand or name.
-
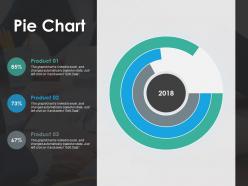 Pie chart ppt show infographic template
Presenting this set of slides with name - Pie Chart Ppt Show Infographic Template. This is a three stage process. The stages in this process are Percentage, Product, Management, Marketing, Business.
-
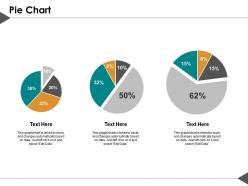 Pie chart ppt summary graphics tutorials
Presenting this set of slides with name - Pie Chart Ppt Summary Graphics Tutorials. This is a three stage process. The stages in this process are Percentage, Product, Business, Management, Marketing.
-
 Pie chart 3 stages 2
This template is skillfully designed and is completely editable to suit all the needs and requirements of the user. The color of the font, its size, style, and all other elements can be customized according to the user's desire The text in the PPT placeholder can be replaced with the desired information making this template highly flexible and adaptable as well. This template is also compatible with various Microsoft versions and formats like Google Slides, JPG, PDF, etc so the user will face no issue in saving it in the format of his choice.
-
 Funnel design chart with icons powerpoint slides
Presenting funnel design chart with icons powerpoint slides. This Power Point template slide has been crafted with graphic of funnel design chart and icons. This PPT slide contains the concept of result analysis. Use this PPT slide for business and finance related presentations.
-
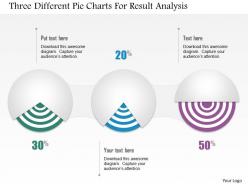 1214 three different pie charts for result analysis powerpoint template
We are proud to present our 1214 three different pie charts for result analysis powerpoint template. Three different pie charts are used to designed this power point template slide. This PPT slide contains the concept of result analysis. Use this PPT slide for your data and process related presentations.
-
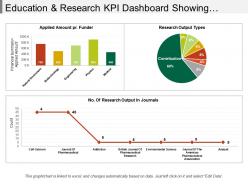 Education and research kpi dashboard Snapshot showing research outputs and amount
Presenting education and research KPI dashboard snapshot showing research outputs and amount PPT slide. The research data metric presentation slide designed by professional team of SlideTeam. The education and research report PPT slide is 100% customizable in PowerPoint. The research amount KPI dashboard slide is also compatible with Google Slide so a user can share this slide with others. A user can make changes in the font size, font type, color as well as dimensions of the research key measure PPT template as per the requirement. You may edit the value in the research key measure PPT template as the slide gets linked with the Excel sheet.
-
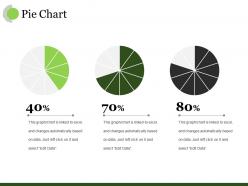 Pie chart ppt sample
Presenting this set of slides with name - Pie Chart Ppt Sample. This is a three stage process. The stages in this process are Business, Marketing, Finance, Planning, Strategy.
-
 Insurance total claims per year and month dashboard
• Bright colors and clarity in graphics • Thoroughly editable slides • Ease of editing the slides with the help of instructions provided. • Easy to download • Comfortably customizable • Of much help to financial analysts, insurance company employees, students and teachers. • High resolution of slide visuals do not let the image pixelate when projected on wide screen • Compatible with latest software options and multiple format types.
-
 New team conflict management sample ppt files
Presenting new team conflict management sample ppt files. This is a team conflict management sample ppt files. This is a three stage process. The stages in this process are competition over resources, communication breakdowns, trust differing goals.
-
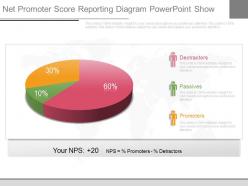 Innovative net promoter score reporting diagram powerpoint show
Presenting innovative net promoter score reporting diagram powerpoint show. This is a net promoter score reporting diagram powerpoint show. This is a three stage process. The stages in this process are dectractors, passives, promoters, your nps, nps, promoters.
-
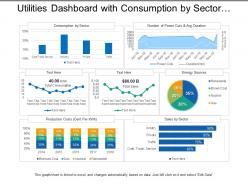 Utilities dashboard with consumption by sector and energy sources
Presenting this set of slides with name - Utilities Dashboard With Consumption By Sector And Energy Sources. This is a three stage process. The stages in this process are Utilities, Use, Advantage.
-
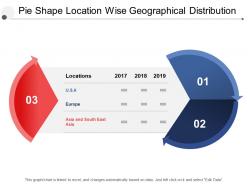 Pie shape location wise geographical distribution
Presenting this set of slides with name - Pie Shape Location Wise Geographical Distribution. This is a three stage process. The stages in this process are Pie Charts, Marketing, Business.
-
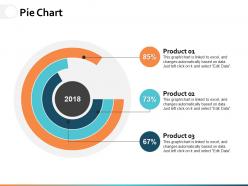 Pie chart ppt powerpoint presentation gallery infographic template
Presenting this set of slides with name - Pie Chart Ppt Powerpoint Presentation Gallery Infographic Template. This is a three stage process. The stages in this process are Percentage, Product, Business, Management, Marketing.
-
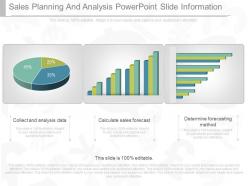 Custom sales planning and analysis powerpoint slide information
Presenting custom sales planning and analysis powerpoint slide information. This is a sales planning and analysis powerpoint slide information. This is a three stage process. The stages in this process are collect and analysis data, calculate sales forecast, determine forecasting method.
-
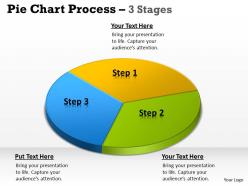 Pie chart process 3 stages 4
This template is skillfully designed and is completely editable to suit all the needs and requirements of the user. The color of the font, its size, style, and all other elements can be customized according to the user's desire The text in the PPT placeholder can be replaced with the desired information making this template highly flexible and adaptable as well. This template is also compatible with various Microsoft versions and formats like Google Slides, JPG, PDF, etc so the user will face no issue in saving it in the format of his choice.
-
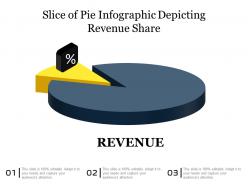 Slice of pie infographic depicting revenue share
Presenting this set of slides with name Slice Of Pie Infographic Depicting Revenue Share. This is a three stage process. The stages in this process are Slice Of Pie Infographic Depicting Revenue Share. This is a completely editable PowerPoint presentation and is available for immediate download. Download now and impress your audience.
-
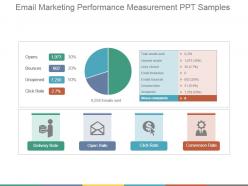 Email marketing performance measurement ppt samples
Presenting email marketing performance measurement ppt samples. This is a email marketing performance measurement ppt samples. This is a three stage process. The stages in this process are opens, bounces, unopened, click rate, delivery rate, open rate, click rate, conversion rate.
-
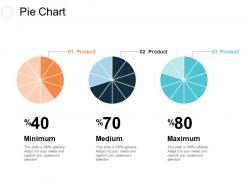 Pie chart ppt slides guidelines
Presenting this set of slides with name - Pie Chart Ppt Slides Guidelines. This is a three stage process. The stages in this process are Business, Management, Strategy, Analysis, Marketing.
-
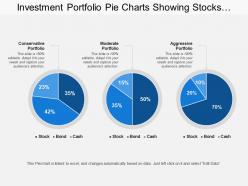 Investment portfolio pie charts showing stocks bonds cash with conservative portfolio
Presenting this set of slides with name - Investment Portfolio Pie Charts Showing Stocks Bonds Cash With Conservative Portfolio. This is a three stage process. The stages in this process are Investment Portfolio, Funding Portfolio, Expenditure Portfolio.
-
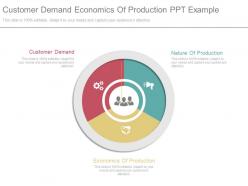 Customer demand economics of production ppt example
Presenting customer demand economics of production ppt example. This is a customer demand economics of production ppt example. This is a three stage process. The stages in this process are nature of production, economics of production, customer demand.
-
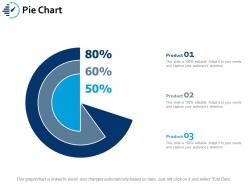 Pie chart ppt portfolio graphics example
Presenting this set of slides with name - Pie Chart Ppt Portfolio Graphics Example. This is a three stage process. The stages in this process are Business, Management, Strategy, Analysis, Marketing.
-
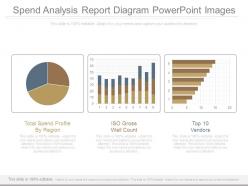 Spend analysis report diagram powerpoint images
Presenting spend analysis report diagram powerpoint images. This is a spend analysis report diagram powerpoint images. This is a three stage process. The stages in this process are total spend profile by region, iso gross well count, top vendors.
-
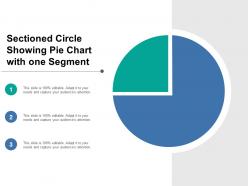 Sectioned circle showing pie chart with one segment
Presenting this set of slides with name - Sectioned Circle Showing Pie Chart With One Segment. This is a three stage process. The stages in this process are Sectioned Circle, Segmented Circle, Partitioned Circle.
Toggle Nav

Skip to Content

Search
5
Notifications 5
-
 SlideTeam added 1083 new products (e.g. Completely Researched Decks, Documents, Slide Bundles, etc), which included 19494 slides in total in the past 24 hours.
4 hours ago
-
 SlideTeam has published a new blog titled "Top 10 Next Steps Slide Templates with Samples and Examples".
1 day ago
-
 SlideTeam has published a new blog titled "Top 10 Learning Journey Templates with Examples and Samples".
1 day ago
-
 SlideTeam has published a new blog titled "Top 10 Benchmarking Presentation Templates with Examples and Samples".
1 day ago
-
 SlideTeam has published a new blog titled "Top 7 Team Name Templates with Samples and Examples".
1 day ago


