-
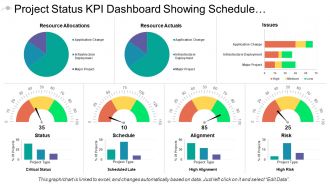 Project Status Kpi Dashboard Showing Schedule And Alignment
Presenting this set of slides with name - Project Status Kpi Dashboard Showing Schedule And Alignment. This is a seven stage process. The stages in this process are Project Health Card, Project Performance, Project Status.
-
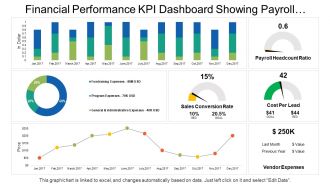 Financial performance kpi dashboard showing payroll headcount ratio cost per lead
Presenting this set of slides with name - Financial Performance Kpi Dashboard Showing Payroll Headcount Ratio Cost Per Lead. This is a seven stage process. The stages in this process are Financial Performance, Financial Report, Financial Review.
-
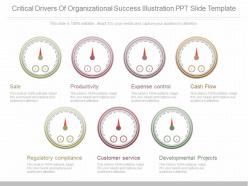 Use critical drivers of organizational success illustration ppt slide template
Presenting use critical drivers of organizational success illustration PPT slide template. The template has been professionally outlined and is fully editable in PowerPoint. You can alter the font type, font dimension, colors of the graphics. Individualize the slide by inserting your brand logo, name or signature. The dummy content in text placeholders can be replaced with your presentation information. The template is fully flexible with Google Slides and other online applications. High-quality graphics and symbols ensure that there is no deteriorating in quality on expending their size. A quick download of the template.
-
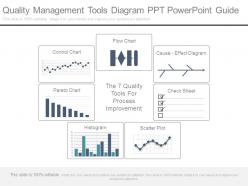 Quality management tools diagram ppt powerpoint guide
Presenting quality management tools diagram ppt powerpoint guide. This is a quality management tools diagram ppt powerpoint guide. This is a seven stage process. The stages in this process are flow chart, cause effect diagram, check sheet, the 7 quality tools for process improvement, scatter plot, histogram, control chart, pareto chart.
-
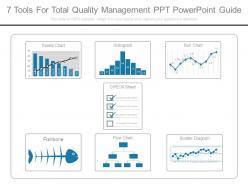 7 tools for total quality management ppt powerpoint guide
Presenting 7 tools for total quality management ppt powerpoint guide. This is a 7 tools for total quality management ppt powerpoint guide. This is a seven stage process. The stages in this process are pareto chart, histogram, run chart, scatter diagram, flow chart, fishbone, check sheet.
-
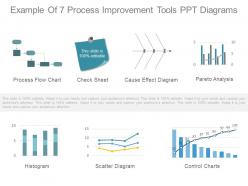 Example of 7 process improvement tools ppt diagrams
Presenting example of 7 process improvement tools ppt diagrams. This is a example of 7 process improvement tools ppt diagrams. This is a seven stage process. The stages in this process are check sheet, cause effect diagram, pareto analysis, control charts, scatter diagram, histogram, process flow chart.
-
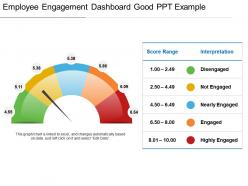 Employee engagement dashboard snapshot good ppt example
Presenting employee engagement dashboard snapshot good PPT example presentation slides. Simple data input like company logo, name or trademark. This PowerPoint template is fully supported by Google Slides. User can edit the data in linked excel sheet and graphs and charts gets customized accordingly. This layout offers fast downloading speed and formats can be easily changed to JPEG and PDF applications. This template is suitable for marketing, sales persons, business managers and entrepreneurs. Adjust PPT layout, font, text and color as per your necessity.
-
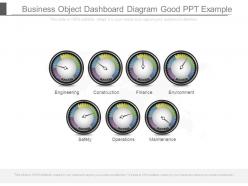 Business object dashboard diagram good ppt example
Presenting business object dashboard diagram good ppt example. This is a business object dashboard diagram good ppt example. This is a seven stage process. The stages in this process are engineering, construction, finance, environment, safety, operations, maintenance.
-
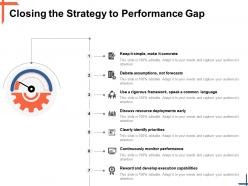 Closing the strategy to performance gap debate assumptions ppt powerpoint presentation file inspiration
This is a seven stages process. The stages in this process are Dashboard, Business, Marketing, Management, Planning.
-
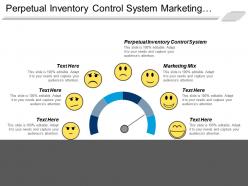 Perpetual inventory control system marketing mix marketing strategy cpb
Presenting this set of slides with name - Perpetual Inventory Control System Marketing Mix Marketing Strategy Cpb. This is an editable seven stages graphic that deals with topics like Perpetual Inventory Control System, Marketing Mix, Marketing Strategy to help convey your message better graphically. This product is a premium product available for immediate download, and is 100 percent editable in Powerpoint. Download this now and use it in your presentations to impress your audience.
-
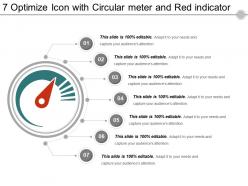 7 optimize icon with circular meter and red indicator
Presenting 7 optimize icon with circular meter and red indicator. This is a 7 optimize icon with circular meter and red indicator. This is a seven stage process. The stages in this process are optimize icon, analyze icon, engineering icon.
-
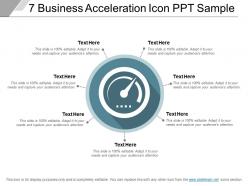 7 business acceleration icon ppt sample
Presenting 7 Business Acceleration Icon PPT Sample. The template is professionally designed and is completely editable in PowerPoint. Font type, size, diagram color, and background color can be adjusted according to your requirement. The slide is fully compatible with Google Slides and can be saved in multiple image formats including JPG, PNG or document formats such as PDF without any problem. High-quality graphics ensure that distortion does not occur.
-
 7 feature with meter performance icon
Presenting 7 Feature With Meter Performance Icon PowerPoint slide. You can download this PPT theme in 4:3 and 16:9 aspect ratios. This PPT layout is 100% editable and you can modify font type, font size, color and shapes. This PowerPoint presentation is Google Slides compatible. You can save and download this PPT theme in PDF. JPG and PNG formats.
-
 7 optimize icon with stopwatch and indicator
Presenting 7 optimize icon with stopwatch and indicator. This is a 7 optimize icon with stopwatch and indicator. This is a seven stage process. The stages in this process are optimize icon, analyze icon, engineering icon.
-
 7 optimize icon with settings icon and meter
Presenting 7 optimize icon with settings icon and meter. This is a 7 optimize icon with settings icon and meter. This is a seven stage process. The stages in this process are optimize icon, analyze icon, engineering icon.
Toggle Nav

Skip to Content

Search
5
Notifications 5
-
 SlideTeam has published a new blog titled "Top 10 Next Steps Slide Templates with Samples and Examples".
19 hours ago
-
 SlideTeam has published a new blog titled "Top 10 Learning Journey Templates with Examples and Samples".
19 hours ago
-
 SlideTeam has published a new blog titled "Top 10 Benchmarking Presentation Templates with Examples and Samples".
19 hours ago
-
 SlideTeam has published a new blog titled "Top 7 Team Name Templates with Samples and Examples".
19 hours ago
-
 SlideTeam added 1063 new products (e.g. Completely Researched Decks, Documents, Slide Bundles, etc), which included 17008 slides in total in the past 24 hours.
23 hours ago

