


Calculating the value of a startup company powerpoint presentation slides


Try Before you Buy Download Free Sample Product
 Impress Your
 Audience
Editable
of Time


To raise capital, a startup needs to be valued, and thus, any entrepreneur needs to understand how the startup valuation process works. Here is a professionally designed template on Calculating the Value of a Startup Company that helps analyze the companys overall equity needs in various stages such as Seed Stage, Series A Stage, Series B Stage, etc. Keeping this in mind, this presentation provides different startup valuation approaches with characteristics and methodologies. It also shows the various challenges the startup faces while doing the valuation. Risks associated with the wrong valuation are also covered in this presentation. This template covers different slides related to startup valuation, including the need for startup valuation, factors that influence startup valuation, business introduction details, startup business team, etc. Additionally, it covers startup failure rate with funding sequence, sources available for startup investment, various valuation methods, valuation summary, and many more. In the end, this presentation includes long term goals and strategies, business pre series and post-series valuation, and startup business growth with total valuation details. Download this 100 percent editable template now.
People who downloaded this PowerPoint presentation also viewed the following :
Content of this Powerpoint Presentation
Slide 1: This slide introduces Calculating the Value of a Startup Company. State Your Company Name and begin.
Slide 2: This slide shows Agenda for Calculating the Value of a Startup Company.
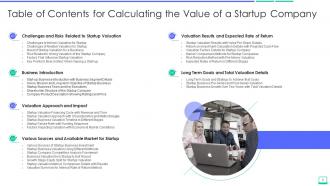
Slide 3: This slide presents Table of Contents for Calculating the Value of a Startup Company.
Slide 4: This slide shows Table of Contents for Calculating the Value of a Startup Company.
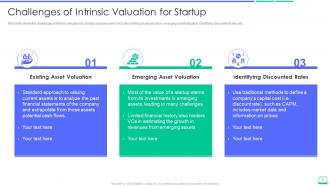
Slide 5: This slide displays the challenges of intrinsic valuation for startup company which includes existing asset valuation, emerging asset valuation, identifying discounted rates, etc.
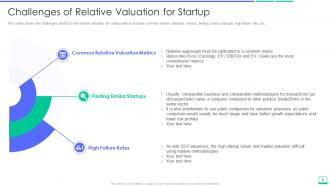
Slide 6: This slide represents Challenges of Relative Valuation for Startup.
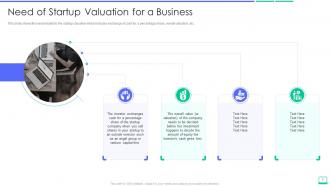
Slide 7: This slide shows the need related to the startup valuation which includes exchange of cash for a percentage share, overall valuation, etc.
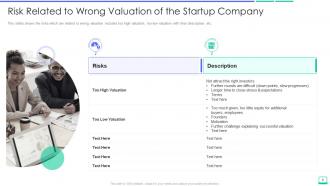
Slide 8: This slide presents Risk Related to Wrong Valuation of the Startup Company.
Slide 9: This slide shows the factors that influence the startup company which includes products, profitability, brand values, etc.
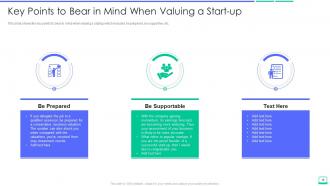
Slide 10: This slide displays Key Points to Bear in Mind When Valuing a Start-up.
Slide 11: This slide represents Table of Contents for Calculating the Value of a Startup Company.
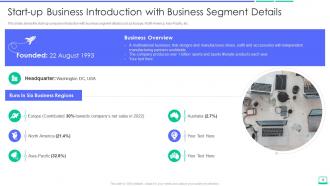
Slide 12: This slide shows Start-up Business Introduction with Business Segment Details.
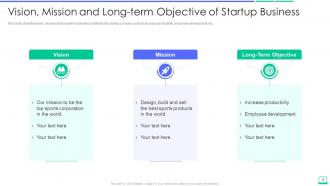
Slide 13: This slide presents Vision, Mission and Long-term Objective of Startup Business.
Slide 14: The slide provides the key executives (C-level, Executive board member and Head of the departments) of the Start-up Company.
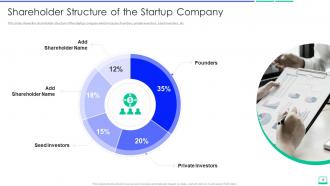
Slide 15: This slide displays the shareholder structure of the startup company which includes founders, private investors, seed investors, etc.
Slide 16: This slide represents Company Product Description Showing Ratings and Price.
Slide 17: This slide shows Table of Contents for Calculating the Value of a Startup Company.
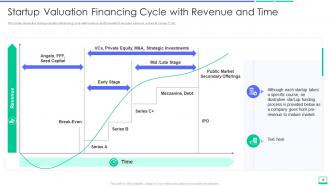
Slide 18: This slide presents Startup Valuation Financing Cycle with Revenue and Time.
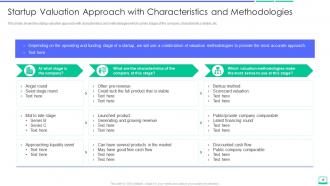
Slide 19: This slide shows Startup Valuation Approach with Characteristics and Methodologies.
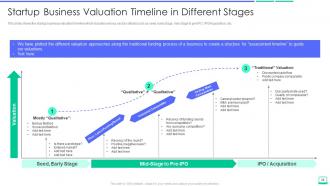
Slide 20: This slide displays Startup Business Valuation Timeline in Different Stages.
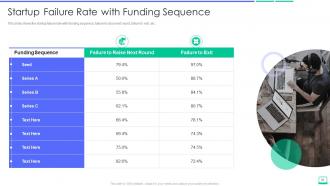
Slide 21: This slide represents the startup failure rate with funding sequence, failure to raise next round, failure to exit, etc.
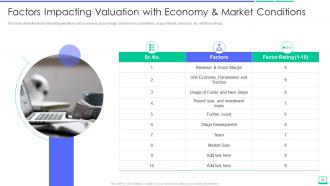
Slide 22: This slide shows Factors Impacting Valuation with Economy & Market Conditions.
Slide 23: This slide presents Table of Contents for Calculating the Value of a Startup Company.
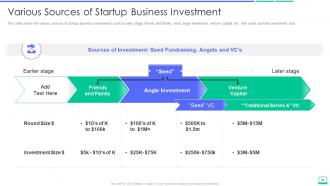
Slide 24: This slide shows Various Sources of Startup Business Investment.
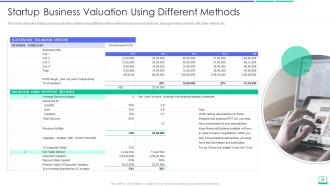
Slide 25: This slide displays Startup Business Valuation Using Different Methods.
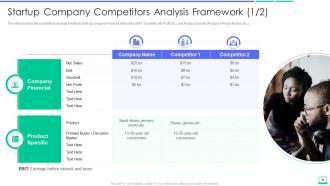
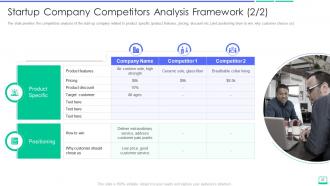
Slide 26: This slide represents Startup Company Competitors Analysis Framework.
Slide 27: This slide shows competitors analysis of the start-up company related to product specific product features, pricing, discount etc.
Slide 28: This slide presents the business valuation from startup to exit round which includes various stages such as angel, seed, venture capital, etc.
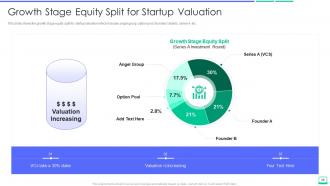
Slide 29: This slide shows the growth stage equity split for startup valuation which includes angel group, option pool, founders' details, series-A, etc.
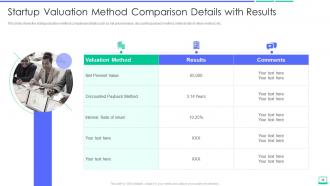
Slide 30: This slide displays Startup Valuation Method Comparison Details with Results.
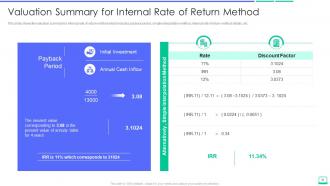
Slide 31: This slide represents Valuation Summary for Internal Rate of Return Method.
Slide 32: This slide shows Table of Contents for Calculating the Value of a Startup Company.
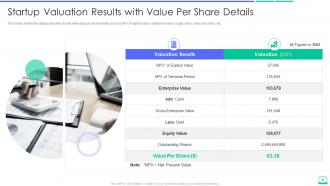
Slide 33: This slide presents Startup Valuation Results with Value Per Share Details.
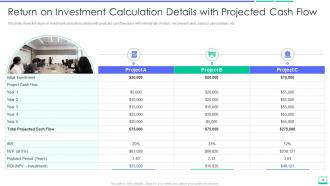
Slide 34: This slide shows Return on Investment Calculation Details with Projected Cash Flow.
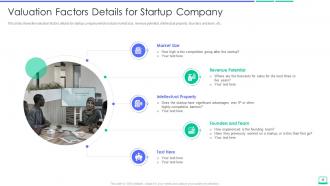
Slide 35: This slide displays Valuation Factors Details for Startup Company.
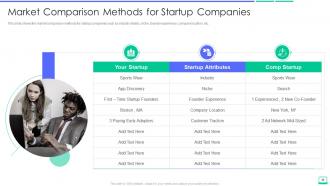
Slide 36: This slide represents the market comparison methods for startup companies such as industry details, niche, founder experience, etc.
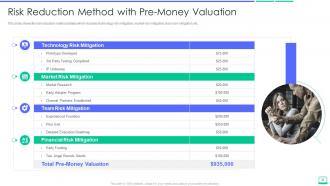
Slide 37: This slide shows Risk Reduction Method with Pre-Money Valuation.
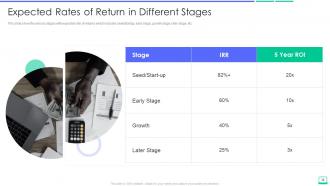
Slide 38: This slide presents the various stages with expected rate of returns which includes seed/startup, early stage, later stage, etc.
Slide 39: This slide shows Table of Contents for Calculating the Value of a Startup Company.
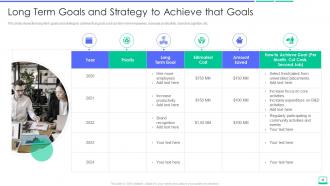
Slide 40: This slide displays Long Term Goals and Strategy to Achieve that Goals.
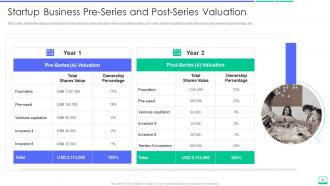
Slide 41: This slides represents the startup business pre-series and post series valuation which includes founders, pre-seed, venture capitalist’s, etc.
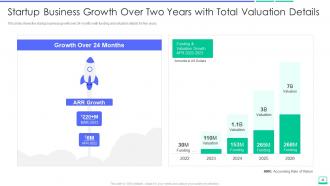
Slide 42: This slide shows Startup Business Growth Over Two Years with Total Valuation Details.
Slide 43: This slide presents Icons for Calculating the Value of a Startup Company.
Slide 44: This slide is titled as Additional Slides for moving forward.
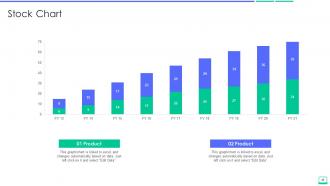
Slide 45: This slide displays Stock chart with two products comparison.
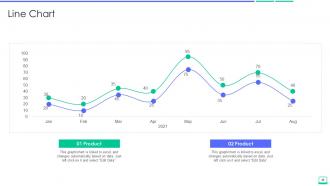
Slide 46: This slide represents Line chart with two products comparison.
Slide 47: This slide shows Post It Notes. Post your important notes here.
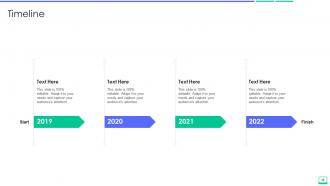
Slide 48: This is a Timeline slide. Show data related to time intervals here.
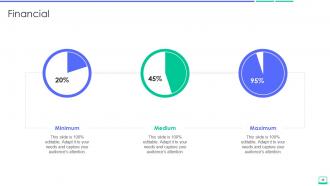
Slide 49: This is a Financial slide. Show your finance related stuff here.
Slide 50: This slide displays Magnifying Glass to highlight information, specifications etc
Slide 51: This slide represents 30 60 90 Days Plan with text boxes.
Slide 52: This is Our Mission slide with related imagery and text.
Slide 53: This is Our Target slide. State your targets here.
Slide 54: This is a Thank You slide with address, contact numbers and email address.
Calculating the value of a startup company powerpoint presentation slides with all 62 slides:
Use our Calculating The Value Of A Startup Company Powerpoint Presentation Slides to effectively help you save your valuable time. They are readymade to fit into any presentation structure.


-
Best way of representation of the topic.