

Capacity model powerpoint presentation slides




Try Before you Buy Download Free Sample Product
 Impress Your
 Audience
 100%
100% Editable
 Save Hours
 of Time


Create a capacity model for your organization using professionally designed content-ready Capacity Model PowerPoint Presentation Slides. Make performance predictions, analyse the capacity of infrastructure, facilities, processes, services and machines. This ready-to-use capacity model PowerPoint presentation templates will help you determine the production capacity needed by an organization to meet the customers services and requirements. Use these easy-to-understand capacity model PowerPoint slides to evaluate what level of capacity your organization will need to satisfy the level of demand for its products and services. This deck comprises of templates such as capacity planning for a project, create a weekly schedule, work breakdown structure, cost management in capacity planning, pending tasks template, etc. Minimize the inconsistency in the processes and projects with the help of capacity planning PowerPoint presentation slideshow. Grab this ready-made capacity model PowerPoint presentation to intensify firm’s overall level of resources and fulfil customers demands. Folks express complete faith in your advice due to our Capacity Model Powerpoint Presentation Slides. You will emerge as their favorite consultant.
People who downloaded this PowerPoint presentation also viewed the following :
Content of this Powerpoint Presentation
Slide 1: This slide introduces Capacity Model. State Your Company Name and begin.
Slide 2: This slide presents Our Main Agenda. You can add the agenda and use it.
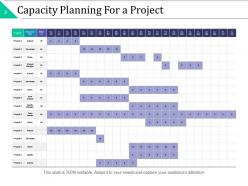
Slide 3: This slide showcase Capacity Planning For a Project with a table.
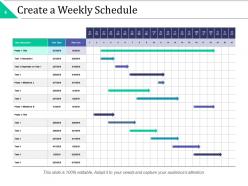
Slide 4: This slide presents Create a Weekly Schedule.
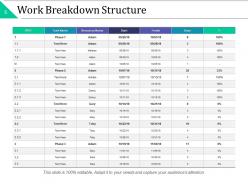
Slide 5: Work Breakdown Structure
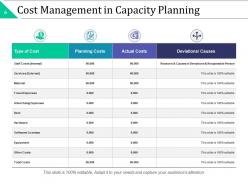
Slide 6: This slide shows Cost Management in Capacity Planning.
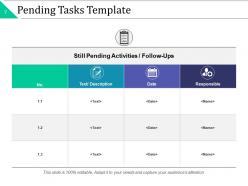
Slide 7: This slide presents Pending Tasks Template.
Slide 8: This slide showcases Capacity Model Icons Slide.
Slide 9: This slide is titled Additional slides for moving forward.
Slide 10: This is Our mission slide with imagery and text boxes to go with.
Slide 11: This is Our team slide with names and designation
Slide 12: This is an About us slide to state company specifications etc.
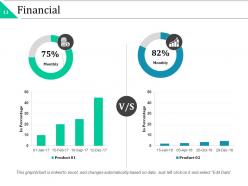
Slide 13: This slide presents Financial scores to display.
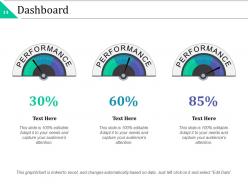
Slide 14: This is a Dashboard slide displaying- Revenue, Purchase Value, Units Sold.
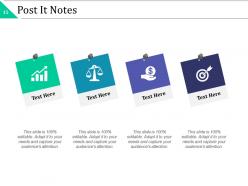
Slide 15: This slide shows an image with text boxes titled Business Person with Post It notes.
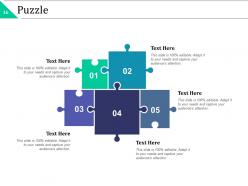
Slide 16: This is a Puzzle image slide to show information, specification etc.
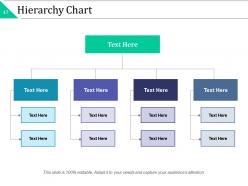
Slide 17: This slide showcases Hierarchy Chart.
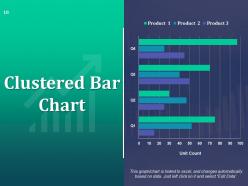
Slide 18: This slide presents Clustered Bar.
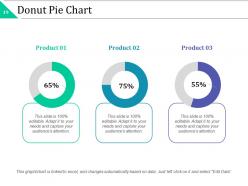
Slide 19: This slide presents Donut Pie Chart which shows the comparing of the product.
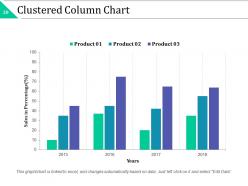
Slide 20: This slide showcases Clustered Column Chart.
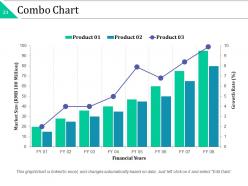
Slide 21: This slide presents Combo Chart, with which you can use it for comparing.
Slide 22: Thanks For Watching!
Capacity model powerpoint presentation slides with all 22 slides:
Elaborate on the evolution of informal apparel with our Capacity Model Powerpoint Presentation Slides. Delve on the history of jeans.


FAQs for Capacity model
So you'll need to figure out who's on your team and what they're good at first - that's your resource inventory. Then forecast what work is coming down the pipeline. Match those up and you've got capacity allocation. Track utilization too, even though time tracking is honestly annoying as hell. But you need to see if people are actually being productive or just busy. Oh, and run some "what if" scenarios - like what happens if three people quit or that big project gets moved up? Start with mapping your current team though. Once you nail that down, add in the demand forecasting piece.
Honestly, capacity models are game-changers for this stuff. You map out what your team can actually do vs. what keeps landing on their desk. Bottlenecks become obvious before everything blows up, and you can shuffle work around smarter. It's basically like a bandwidth tracker for your whole org - which is clutch when you need to push back on crazy requests with real numbers. Shows you who's drowning and who's got space, so hiring decisions aren't just gut calls anymore. Oh, and project timelines actually make sense. Start by just tracking current workload against available hours.
So there are a few ways to tackle this. Historical analysis is your best starting point - just dig into past performance data since it's pretty straightforward. Then you can benchmark against what others in your industry are doing to double-check your thinking. Mathematical modeling with queuing theory or simulation gets more complex but works well too. Honestly, most teams end up using capacity planning tools that mix all these methods together. The specific tool doesn't matter as much as having good, clean data to work with. Don't forget to account for peak loads and growth projections - oh, and always build in some buffer capacity for those random spikes that'll definitely happen at 3am.
Demand forecasting is what makes your capacity model actually work - otherwise you're just throwing darts at resource needs. Bad forecasting screws everything up. You'll waste cash over-provisioning or deal with performance nightmares from under-provisioning. Here's the thing though - most models expect predictable patterns, but real demand? Total chaos sometimes. Better historical data helps a ton, especially when you factor in seasonality and growth trends. I'd start by checking your forecast accuracy against actual usage each month. Trust me, even small improvements in forecasting make huge differences in your capacity decisions.
So KPIs are like your reality check - they show if your capacity model actually works or just looks good on paper. Track stuff like forecast accuracy and how often you hit your targets vs real demand. Resource utilization rates matter too. Pick ones that connect to business results, not just nerdy model stats. Honestly, I've watched so many "perfect" models completely bomb when you measure what's really happening. Short, regular check-ins work way better than quarterly deep dives - trust me on that one. When the numbers start going sideways, don't ignore it.
Build capacity modeling right into your annual planning - don't make it some separate thing you do later. Map what you've got now against what you'll need for each business unit. Honestly, most companies do this completely backwards then act shocked when everything falls apart. Use that data to spot bottlenecks early, then actually factor those limits into your big decisions about new products or expansion. Make it a regular part of planning meetings, not something you remember at the last minute. Oh, and update quarterly - you'll thank yourself when you're not making strategic calls based on outdated assumptions.
Honestly, data's gonna be your nightmare - missing records, stuff scattered everywhere, total mess. Getting people to trust your model over their hunches? Good luck with that one. Also, you'll spend forever just figuring out what "capacity" actually means for your situation. Business keeps changing too, so you're constantly tweaking things. But here's what worked for me: pick one small area first. Get a few wins under your belt, then people start paying attention. Way easier than trying to boil the ocean right away.
Honestly, tech makes capacity modeling way more accurate than the old guesswork methods. IoT sensors show you real utilization data instead of rough estimates. Machine learning catches patterns you'd miss completely - I've seen it predict bottlenecks weeks ahead. Cloud platforms let you run simulations that used to take days in like an hour. The prediction stuff is where it gets really interesting though - AI factors in historical trends plus outside variables to forecast demand. Just make sure your data's clean first and pick tools that actually play nice with whatever systems you're already running.
So basically, you map out your team's capacity against what's coming up and boom - you can see the train wrecks before they happen. Like when Sarah's the only one who knows that system and three projects need her the same week. Short sentences hit different sometimes. You'll spot where you need contractors or have to move stuff around way before you're scrambling. Honestly, it beats the hell out of just winging it and hoping for the best. The whole point is seeing your riskiest delivery spots early so you can actually do something about them instead of just stressing later.
Manufacturers get huge value from these models - they're constantly dealing with production bottlenecks and shifting demand. Hospitals use them for staffing schedules and bed allocation too. SaaS companies are probably the heaviest users though, scaling infrastructure up and down constantly. Really any business where you've got limited resources but unpredictable demand will see benefits. Manufacturing and healthcare just happen to be the obvious ones since their constraints are so visible. My advice? Pick your worst bottleneck first and build the model around that specific problem. You can always expand it later once you prove it works.
Honestly, cloud platforms just do all the annoying work for you - real-time data collection, scaling predictions, team dashboards. You don't have to mess with spreadsheets or bug IT every time you need server space. They pull data from everywhere and run simulations way faster than your old setup. Your whole team can actually work together on the same models from wherever. I'd say grab a cloud analytics platform that plugs into whatever monitoring tools you're already using. You'll probably see results in a few weeks instead of waiting forever.
So static models are basically just a snapshot - they assume everything stays the same forever, which is pretty unrealistic tbh. Dynamic ones actually track changes as they happen, like when your team gets faster or you hit busy season. Picture taking one photo vs recording a video. Yeah, dynamic is way more complicated to set up, but you can actually spot problems coming instead of getting blindsided. If your workload changes much at all, you'll definitely want to go dynamic. Trust me on this one.
So these models basically show you every step in your production line and pinpoint exactly where stuff gets jammed up. You plug in your current rates, resources, demand - whatever data you have. Then it highlights which stations are hitting 100% capacity (aka your bottlenecks). Think of it like Google Maps showing you traffic jams, but for your factory floor. What's really neat is testing scenarios before spending money on changes. I'd start with mapping what you have now, then play around with moving resources to different spots. You'll be surprised where the biggest wins hide sometimes.
Honestly, visuals are everything here. Charts and graphs that actually tell a story beat spreadsheets every single time - trust me on this one. People's eyes just glaze over with raw data dumps. Start with your biggest findings right up front, then let them dive deeper if they want. Oh, and explain your assumptions in normal English, not corporate speak. The tricky part? You'll need different angles for different people. What gets an exec excited isn't gonna resonate with the ops team at all.
Honestly, treat that capacity model like it's gonna change constantly - because it will. I review mine every quarter, sometimes more if we're launching stuff or reshuffling teams. Track your predictions against what actually happens so you'll know when things are off. Build it modular from day one. Trust me on this - I've watched teams get stuck with rigid models that become useless after six months. Set those calendar reminders too, otherwise you'll totally forget to update it. Oh, and write down your assumptions clearly so future you isn't trying to decode what past you was thinking.
No Reviews