Challenges and opportunities identification in a process powerpoint presentation slides
Plan and deliver a power-packed presentation with our challenges and opportunities identification in a process PowerPoint presentation slides. The slides in this objection and convenience PPT deck presents a docket about understanding the key strategies, implementation, and benefits of the same. Elaborating on the problems as well as the effective solutions, SWOT analysis, future forecast, etc, is all collaborated in this threats PowerPoint template. Presenting the series of steps involved such as- mapping, analyzing, redesigning, implementing, and reviewing, this creative PPT set makes it convenient for the audience to have every detail at an easy access. The slides in this trial and scope PowerPoint layout is beneficial in terms of laying out the challenges of the company so that the audience can come up with efficient solutions for the same. This defiance and liberty PPT bundle effectively presents the industry overview for the knowledge of the shareholders along with FMEA analysis for better understanding. Grab it instantly to make way for additional perks in the business.
Plan and deliver a power-packed presentation with our challenges and opportunities identification in a process PowerPoint p..
- Google Slides is a new FREE Presentation software from Google.
- All our content is 100% compatible with Google Slides.
- Just download our designs, and upload them to Google Slides and they will work automatically.
- Amaze your audience with SlideTeam and Google Slides.
-
Want Changes to This PPT Slide? Check out our Presentation Design Services
- WideScreen Aspect ratio is becoming a very popular format. When you download this product, the downloaded ZIP will contain this product in both standard and widescreen format.
-

- Some older products that we have may only be in standard format, but they can easily be converted to widescreen.
- To do this, please open the SlideTeam product in Powerpoint, and go to
- Design ( On the top bar) -> Page Setup -> and select "On-screen Show (16:9)” in the drop down for "Slides Sized for".
- The slide or theme will change to widescreen, and all graphics will adjust automatically. You can similarly convert our content to any other desired screen aspect ratio.
Compatible With Google Slides

Get This In WideScreen
You must be logged in to download this presentation.
PowerPoint presentation slides
Presenting our challenges and opportunities identification in a process PowerPoint presentation slides. This PowerPoint theme is inclusive of fifty slides and each one of them is available for download in both standard and widescreen formats. Easy to edit, this PPT deck is compatible with all popular presentation software such as Microsoft Office, Google Slides, and many others.
People who downloaded this PowerPoint presentation also viewed the following :
Content of this Powerpoint Presentation
Slide 1: This slide displays title i.e. 'Challenges and Opportunities Identification in a Process' and your Company Name.
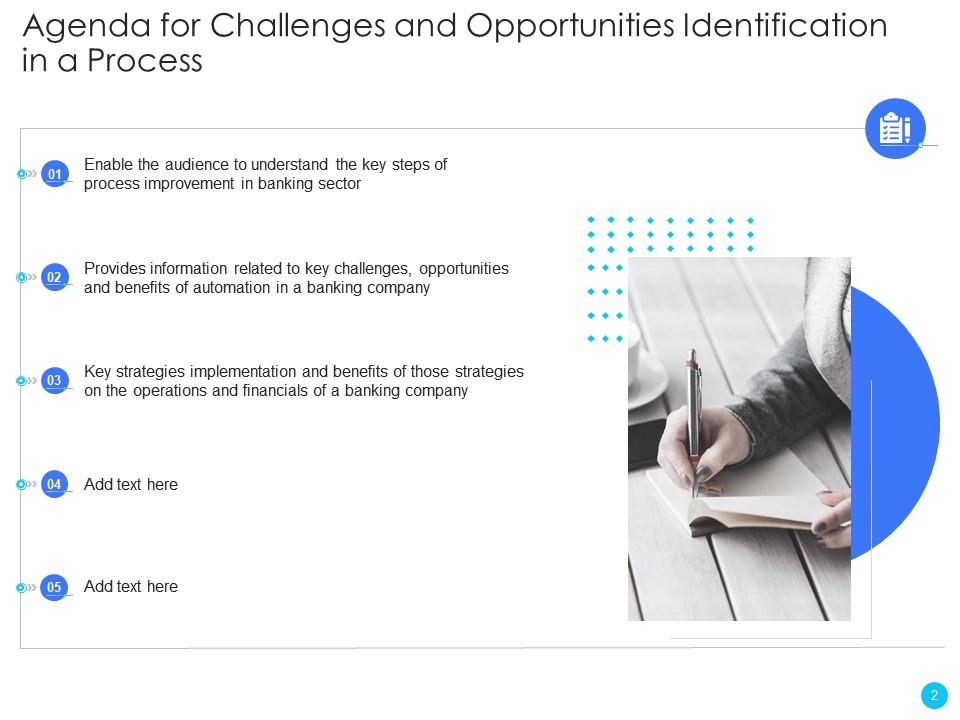
Slide 2: This slide presents agenda.
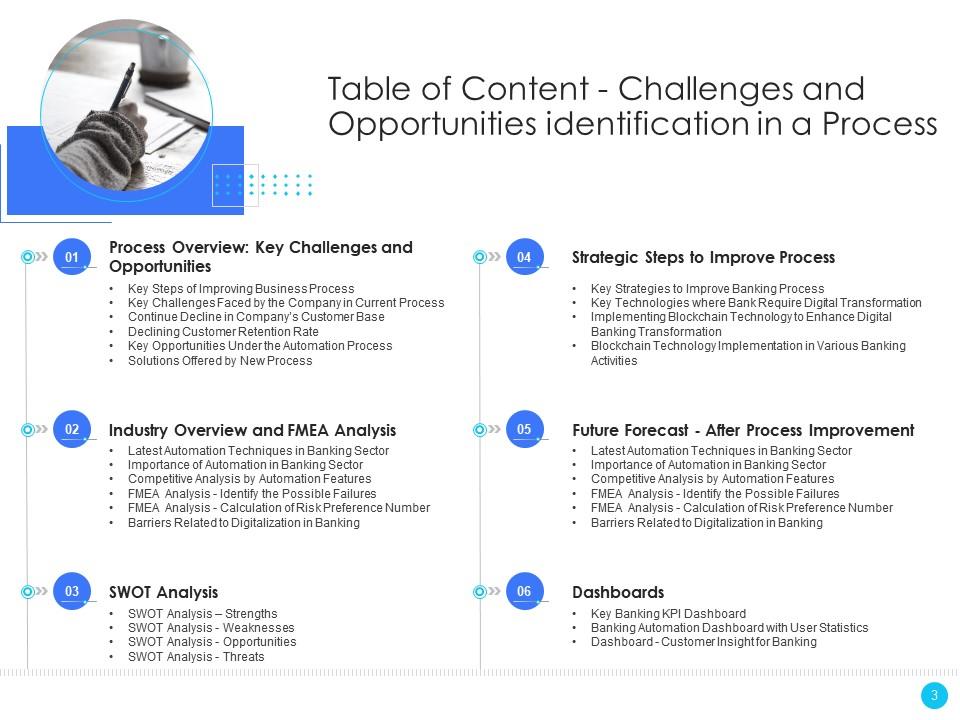
Slide 3: This slide exhibits table of contents.
Slide 4: This slide shows title for 'Process overview'.
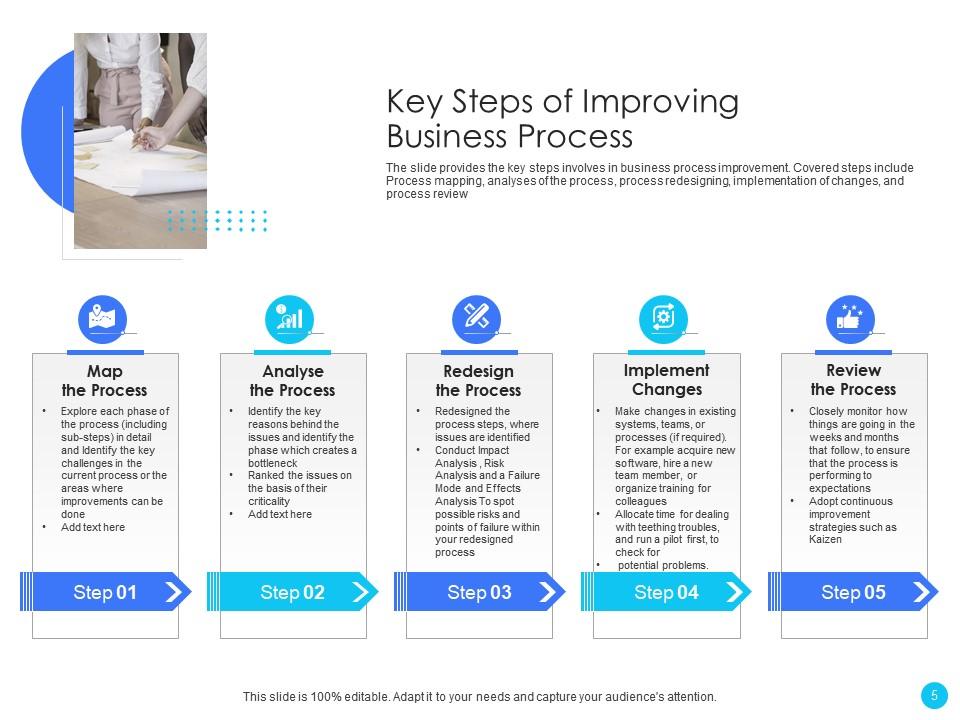
Slide 5: The slide provides the key steps involves in business process improvement.
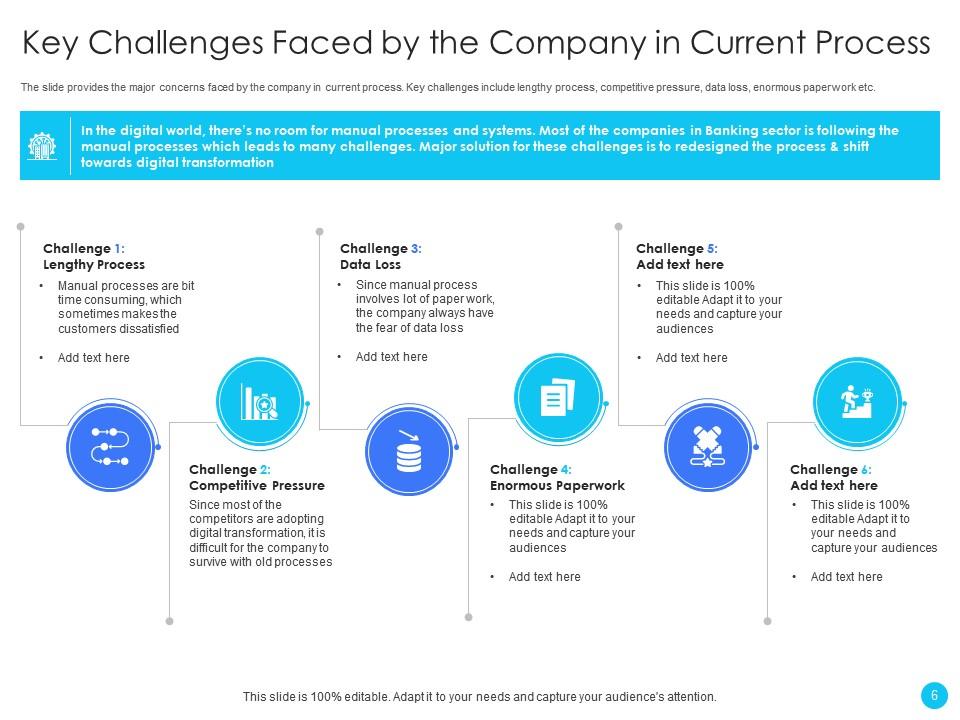
Slide 6: The slide provides the major concerns faced by the company in current process.
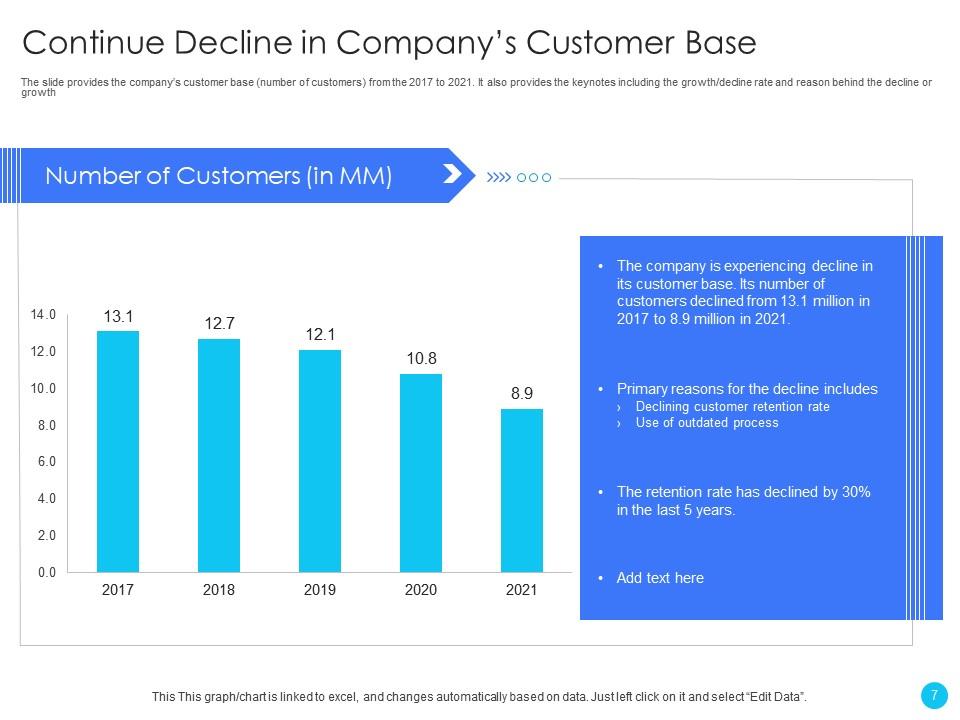
Slide 7: The slide provides the company’s customer base (number of customers) from the 2017 to 2021.
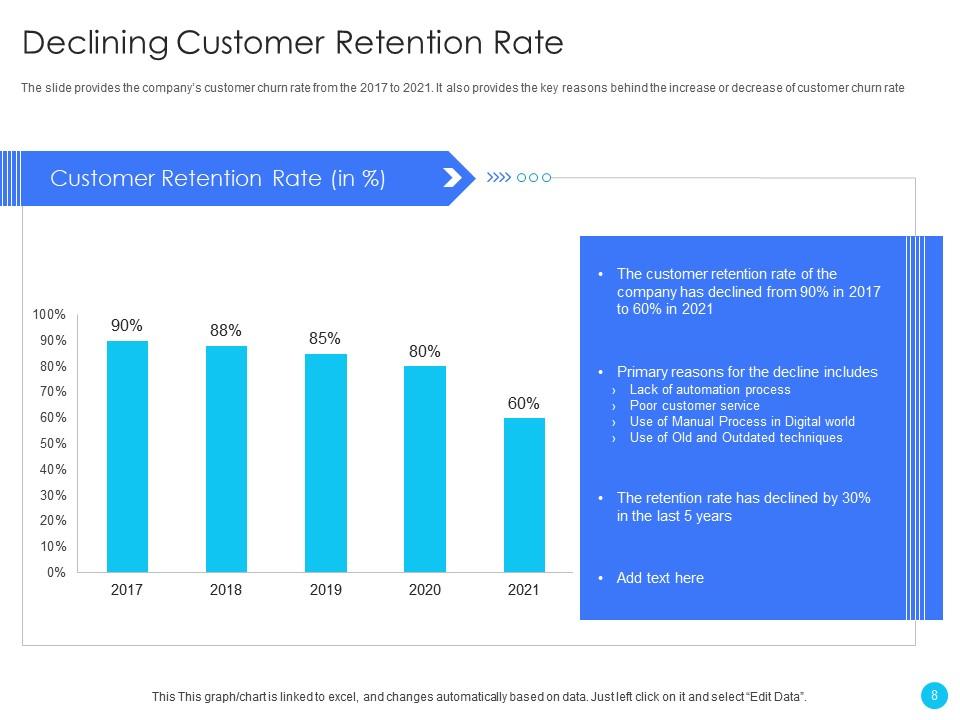
Slide 8: The slide provides the company’s customer churn rate from the 2017 to 2021.
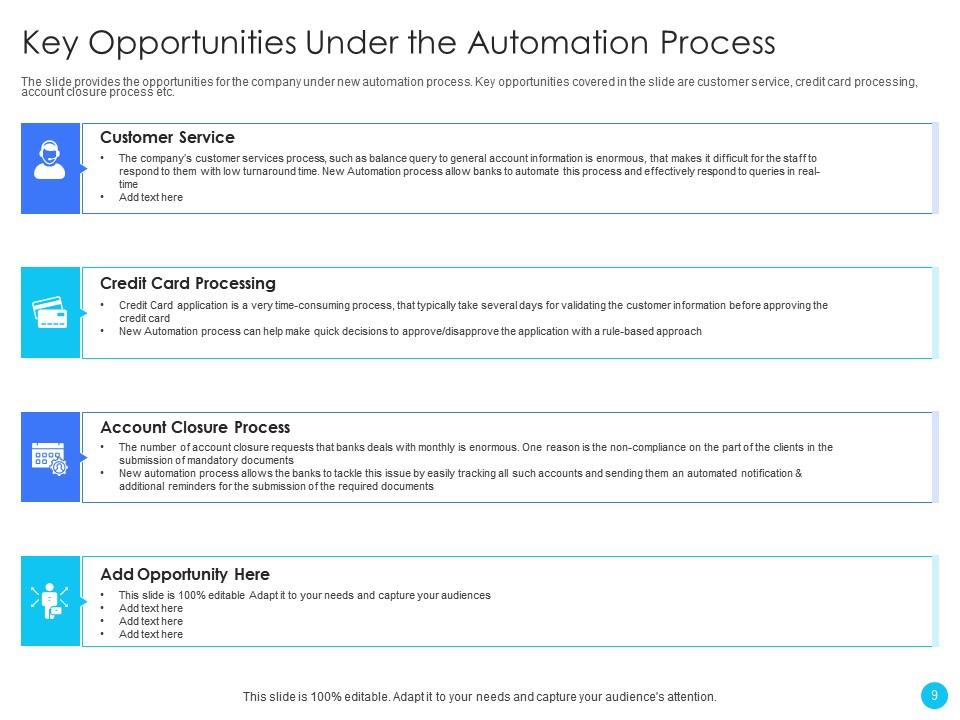
Slide 9: The slide provides the opportunities for the company under new automation process.
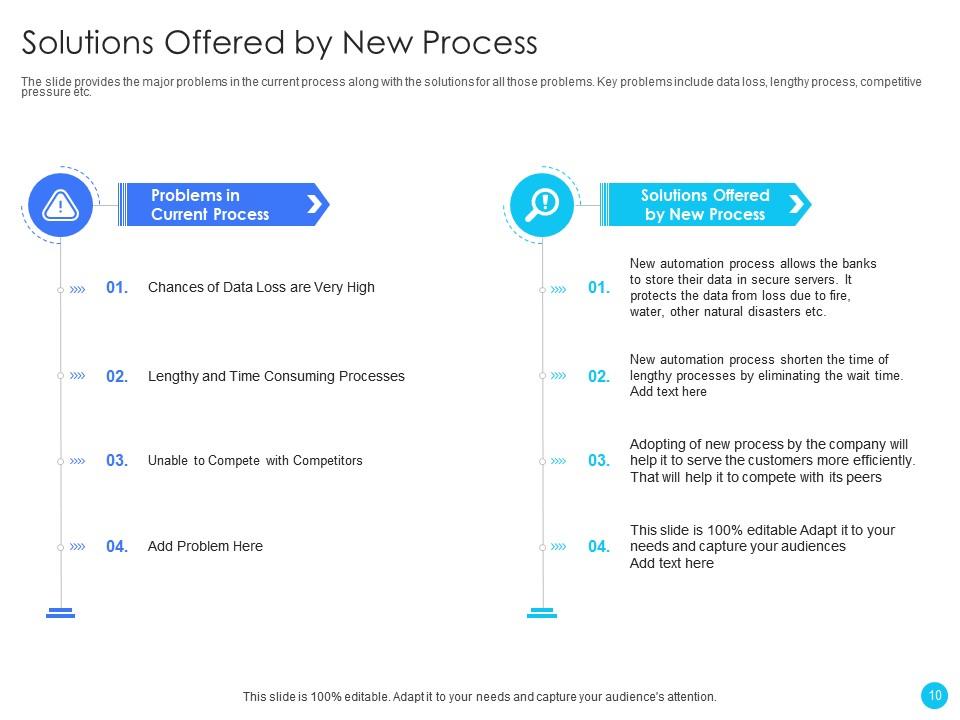
Slide 10: The slide provides the major problems in the current process along with the solutions for all those problems.
Slide 11: This slide depicts title for 'Industry overviews & FMEA analysis'.
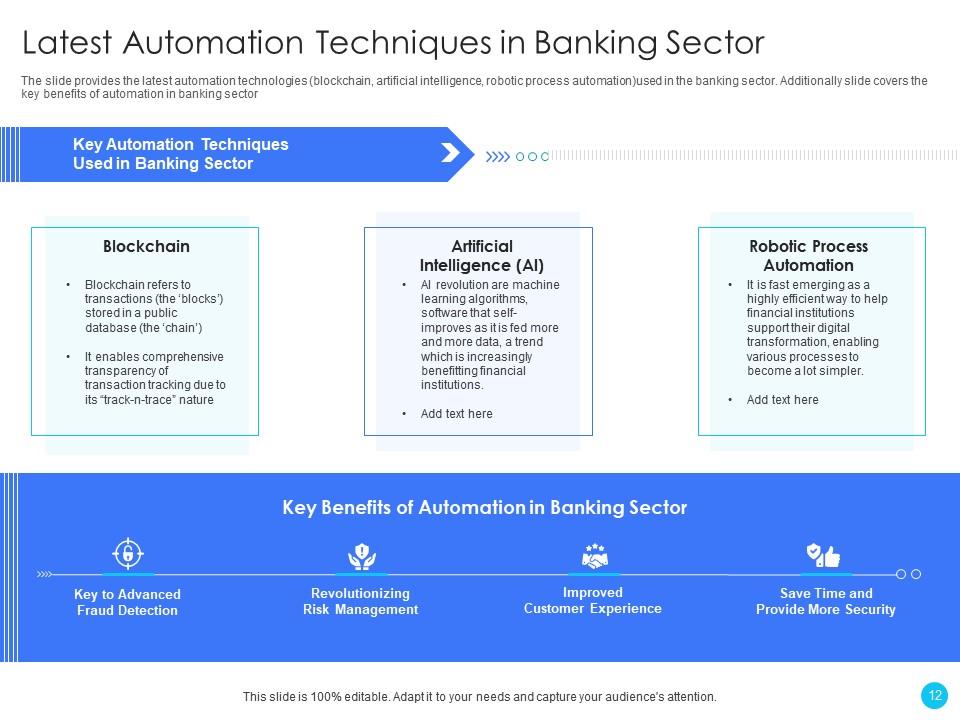
Slide 12: The slide provides the latest automation technologies.
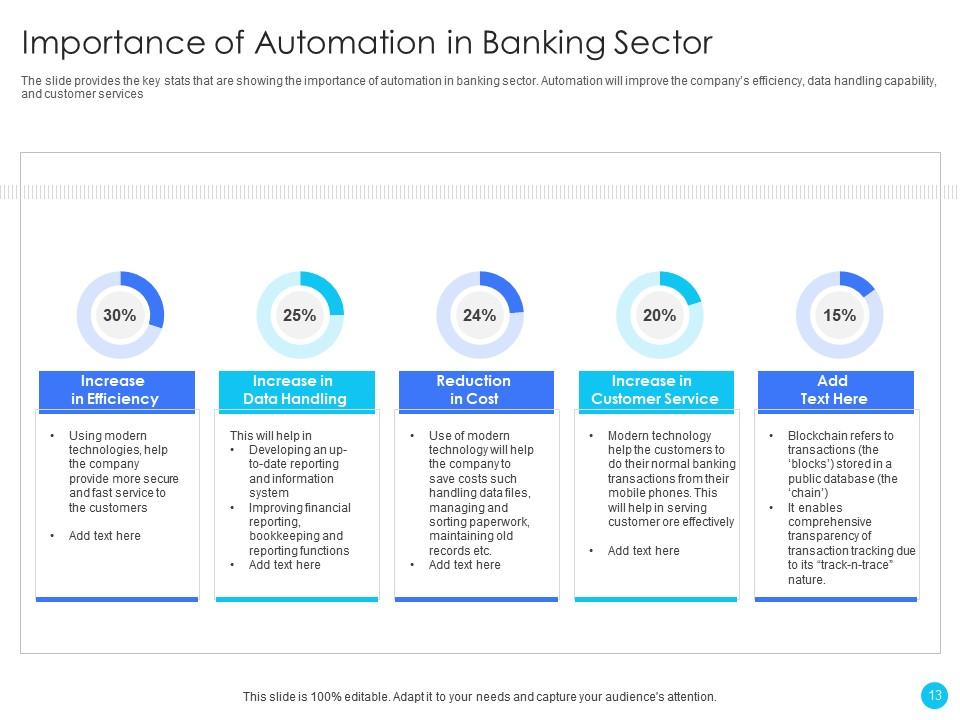
Slide 13: The slide provides the key stats that are showing the importance of automation in banking sector.
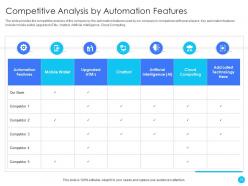
Slide 14: The slide provides the competitive analysis of the company by the automation features.
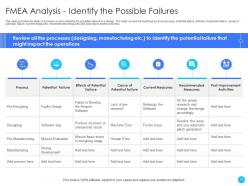
Slide 15: This slide provides the table of process review to identify the possible failures in a design.
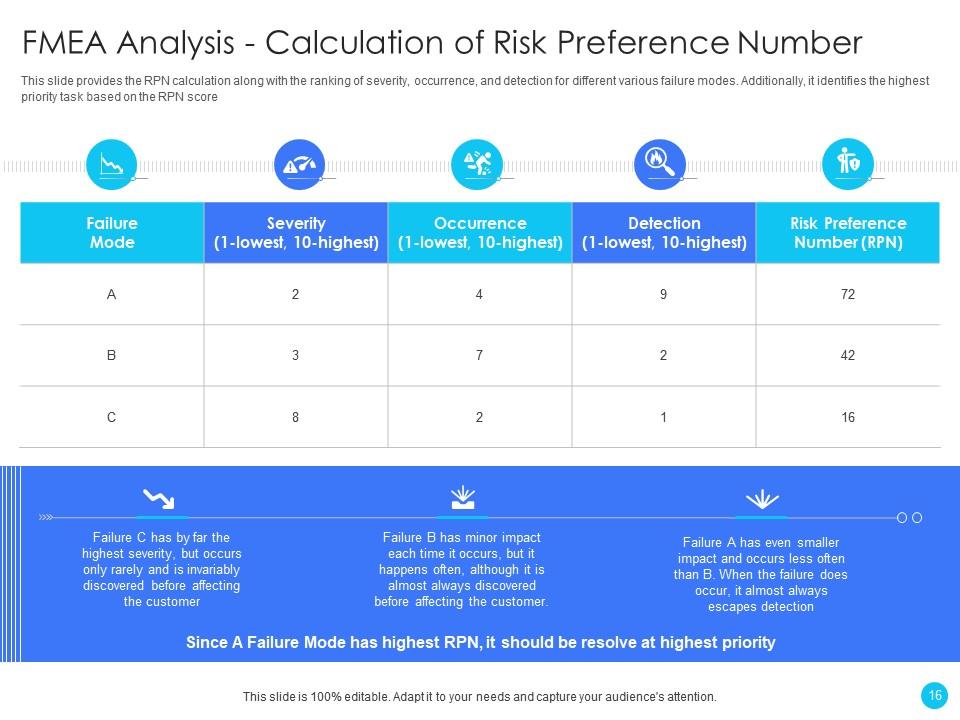
Slide 16: This slide provides the RPN calculation along with the ranking of severity, occurrence, and detection for different various failure modes.
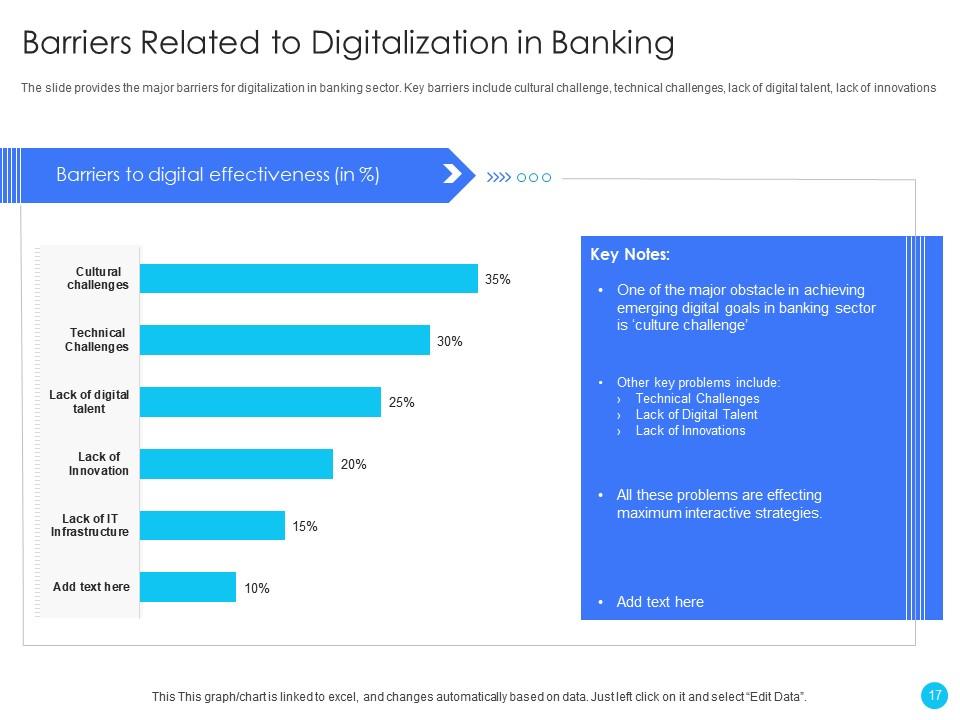
Slide 17: The slide provides the major barriers for digitalization in banking sector.
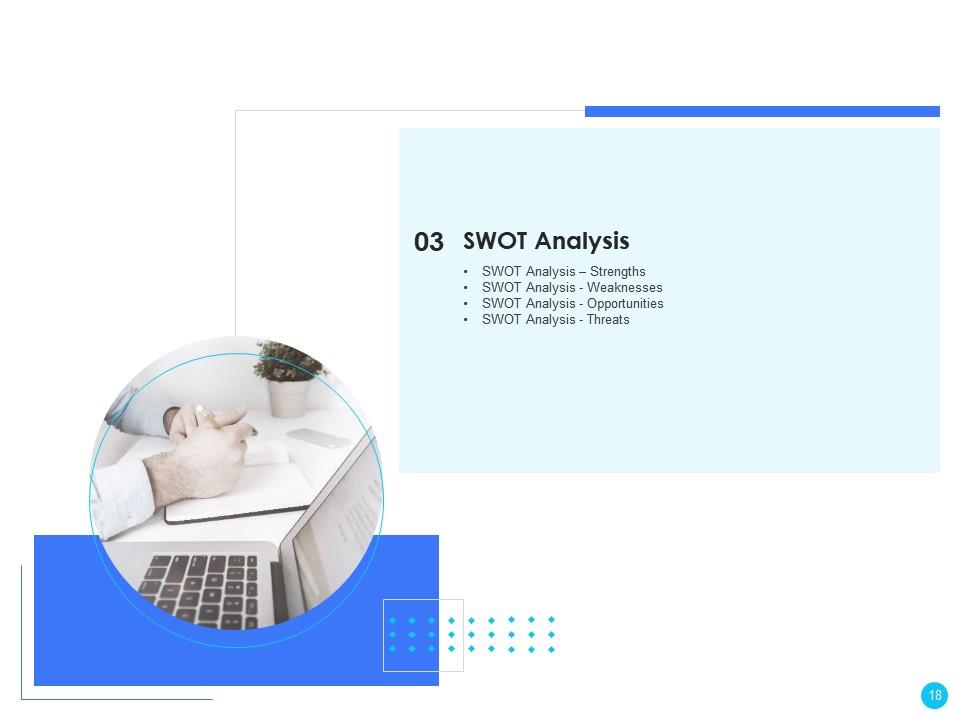
Slide 18: This slide displays title for 'SWOT Analysis'.
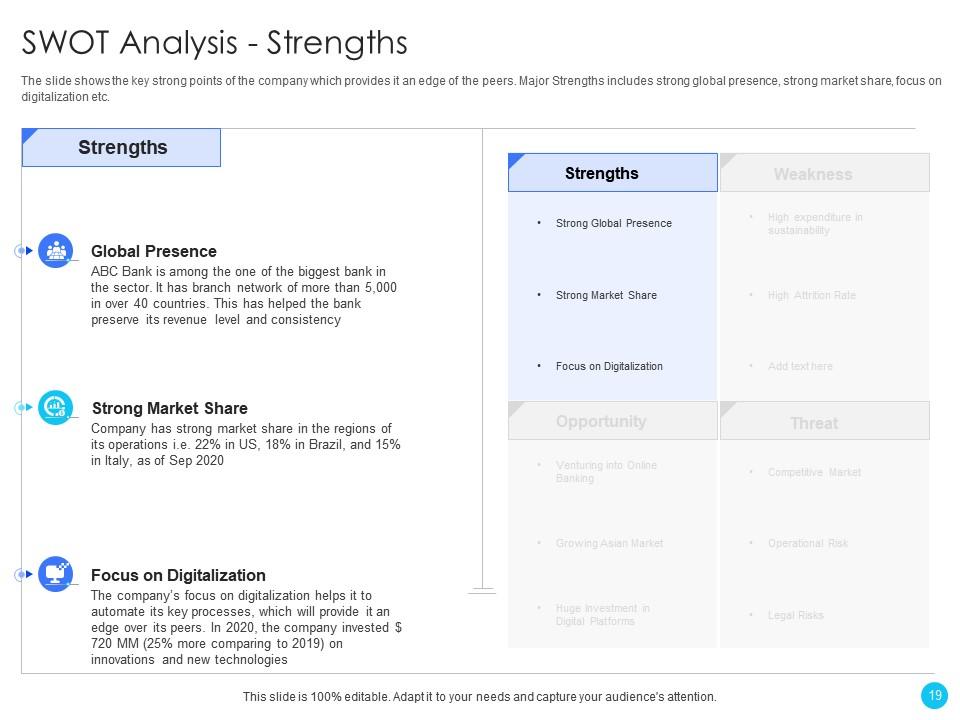
Slide 19: The slide shows the key strong points of the company which provides it an edge of the peers.
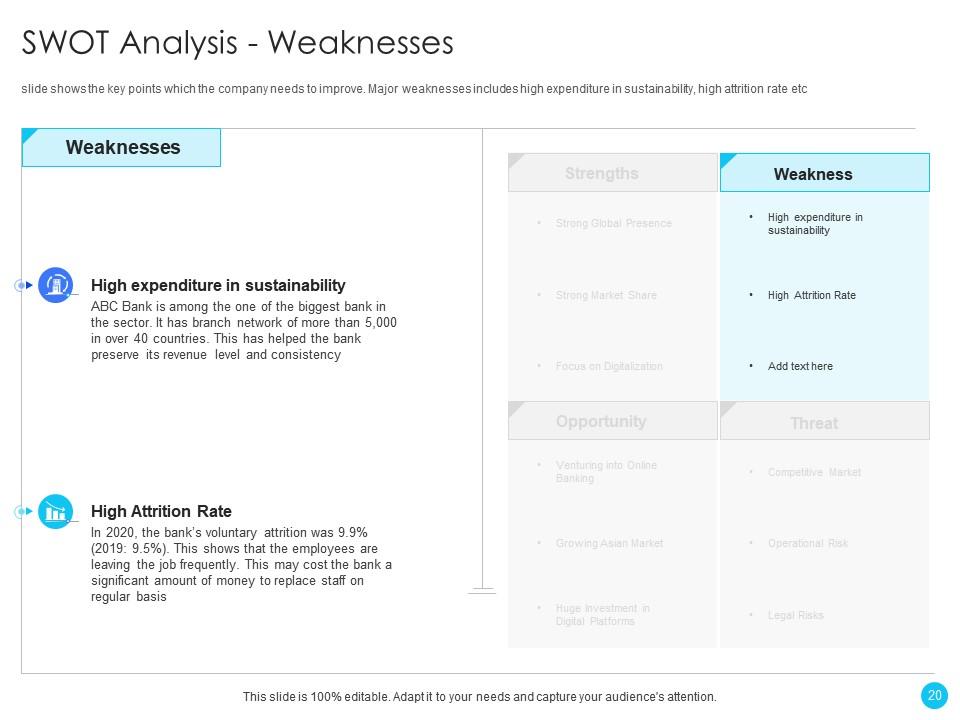
Slide 20: This slide shows the key points which the company needs to improve.
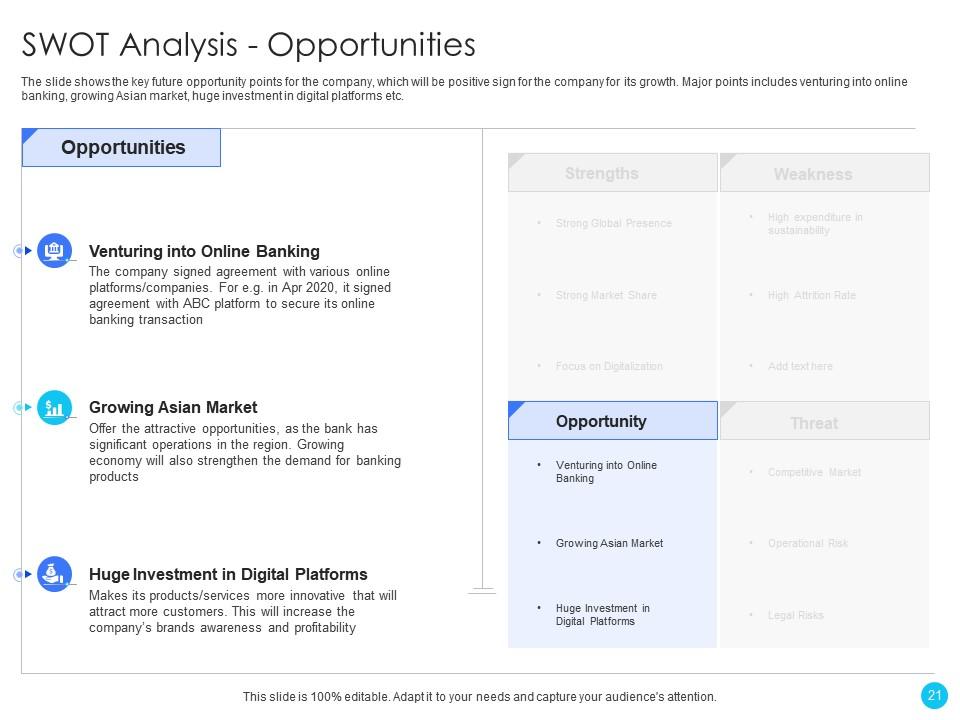
Slide 21: The slide shows the key future opportunity points for the company, which will be positive sign for the company for its growth.
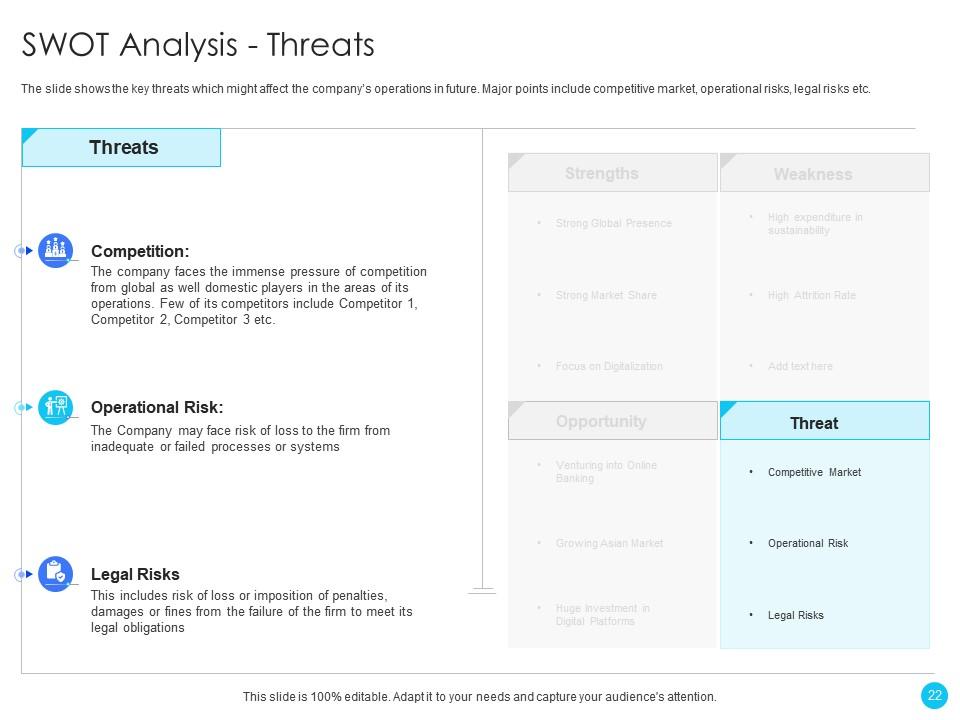
Slide 22: The slide shows the key threats which might affect the company’s operations in future.
Slide 23: This slide presents title for 'Strategic steps to improve process'.
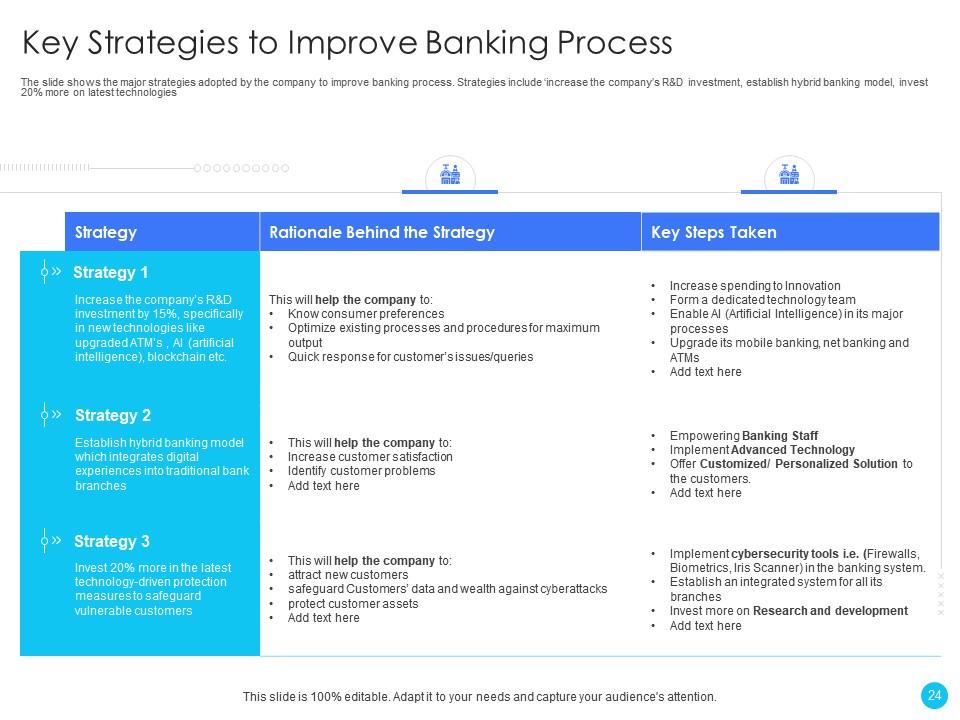
Slide 24: The slide shows the major strategies adopted by the company to improve banking process.
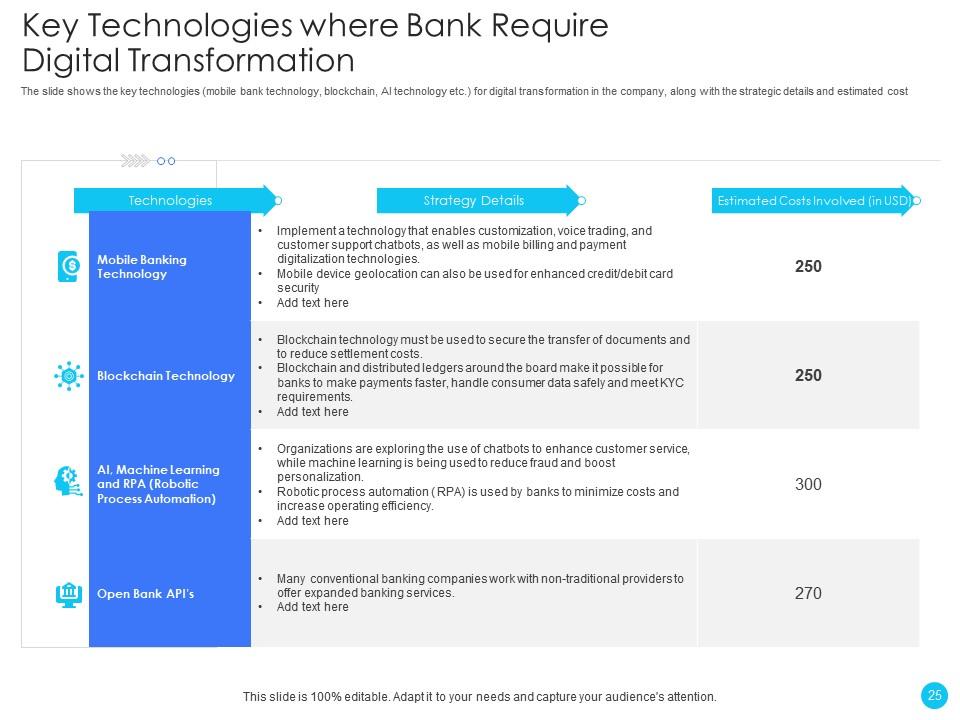
Slide 25: The slide shows the key technologies (mobile bank technology, blockchain, AI technology etc.) for digital transformation.
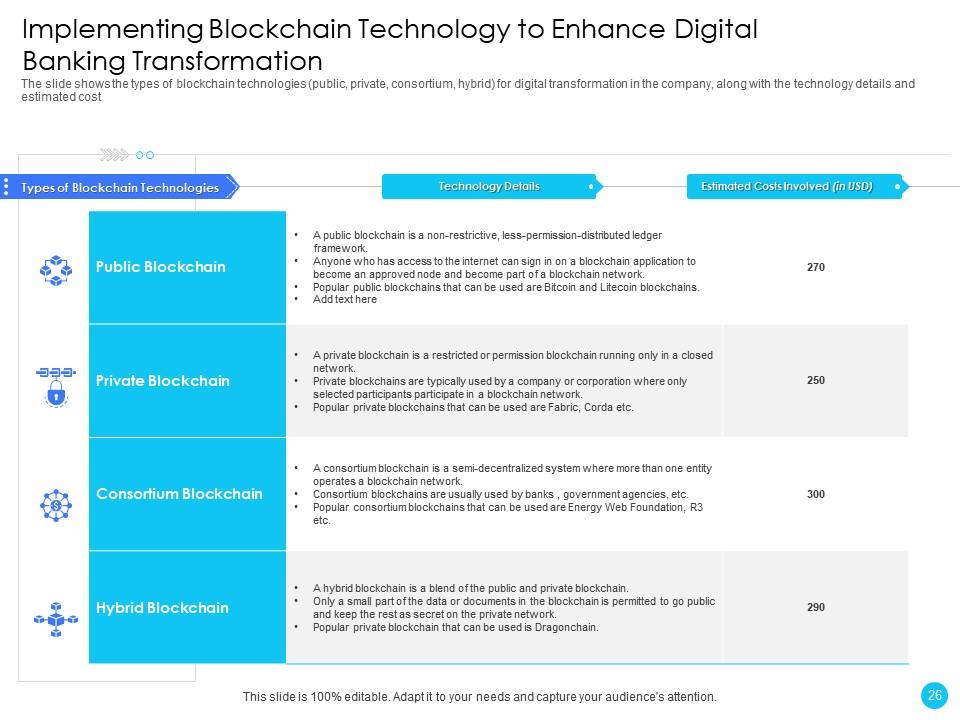
Slide 26: The slide shows the types of blockchain technologies.
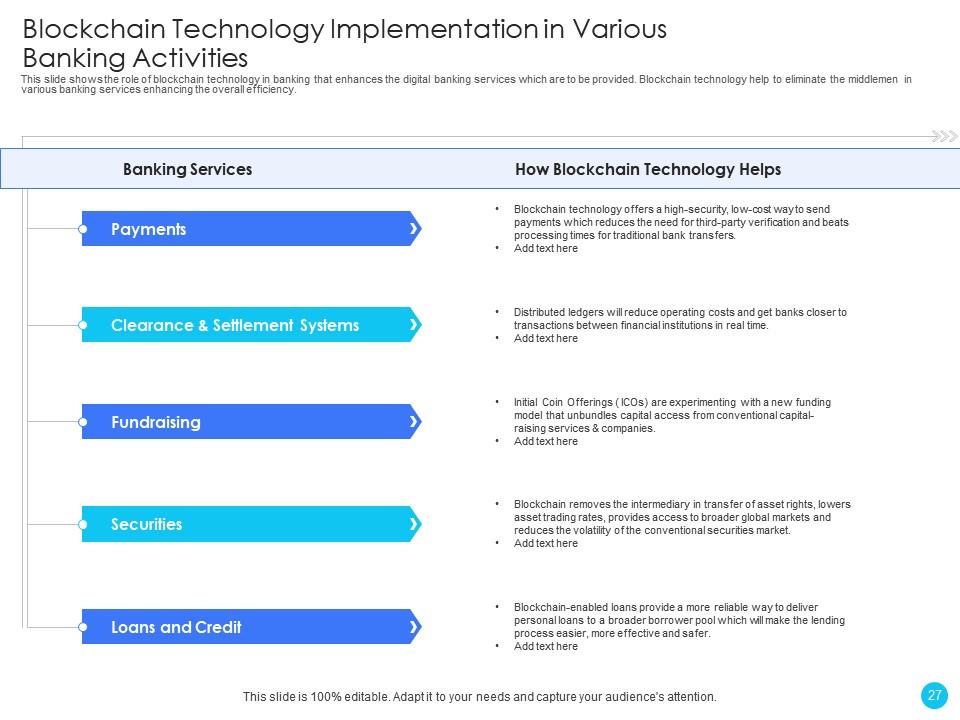
Slide 27: This slide shows the role of blockchain technology in banking that enhances the digital banking services which are to be provided.
Slide 28: This slide presents title for 'Future forecast - after process improvement'.
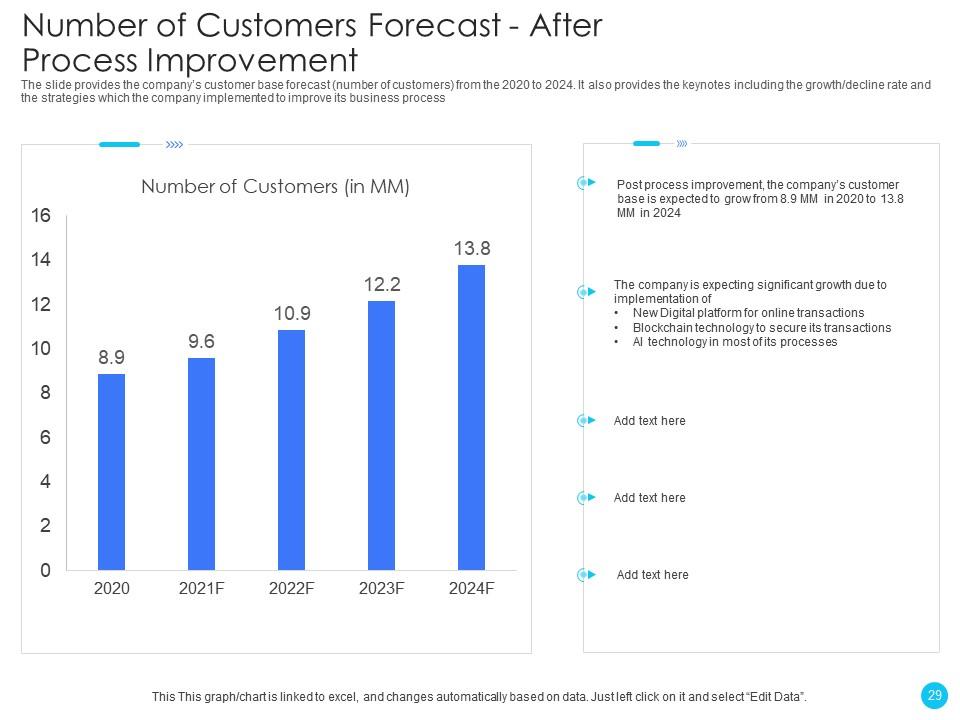
Slide 29: The slide provides the company’s customer base forecast (number of customers) from the 2020 to 2024.
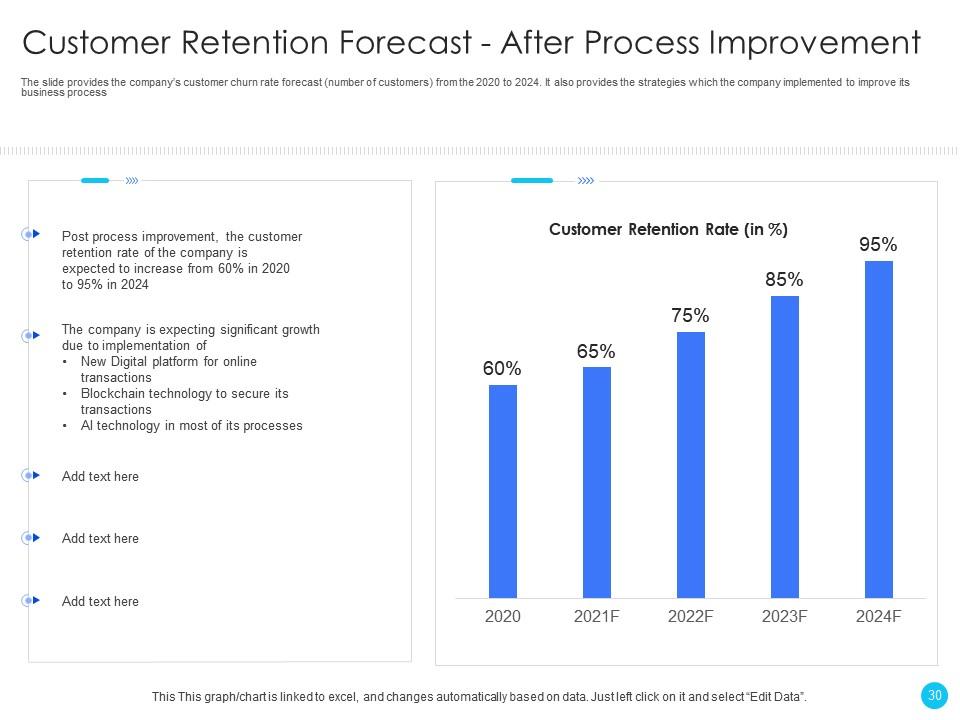
Slide 30: The slide provides the company’s customer churn rate forecast (number of customers) from the 2020 to 2024.
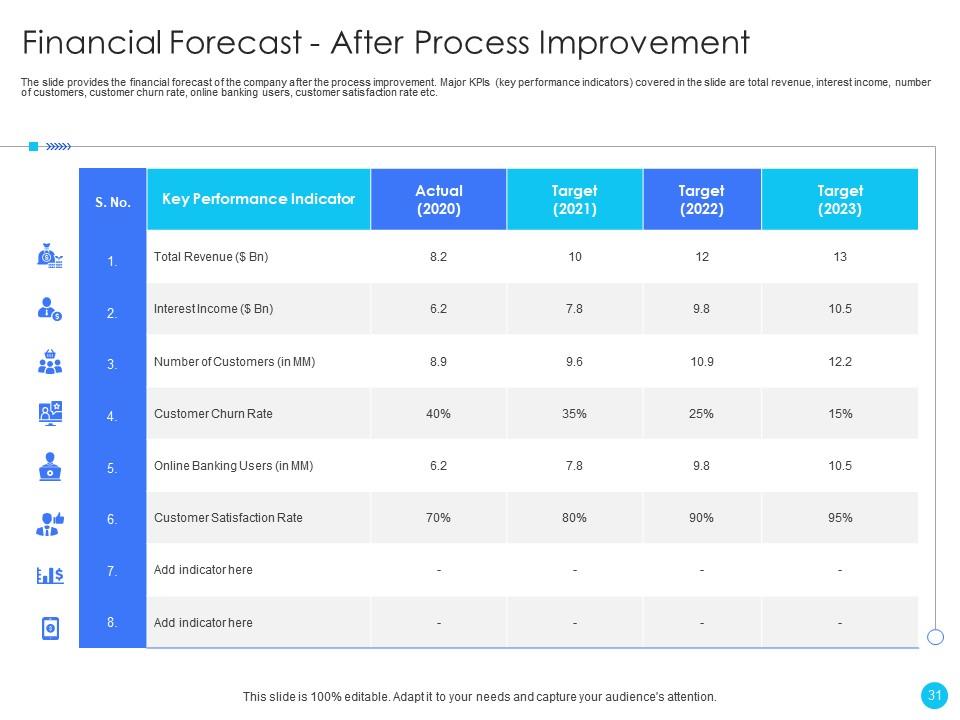
Slide 31: The slide provides the financial forecast of the company after the process improvement.
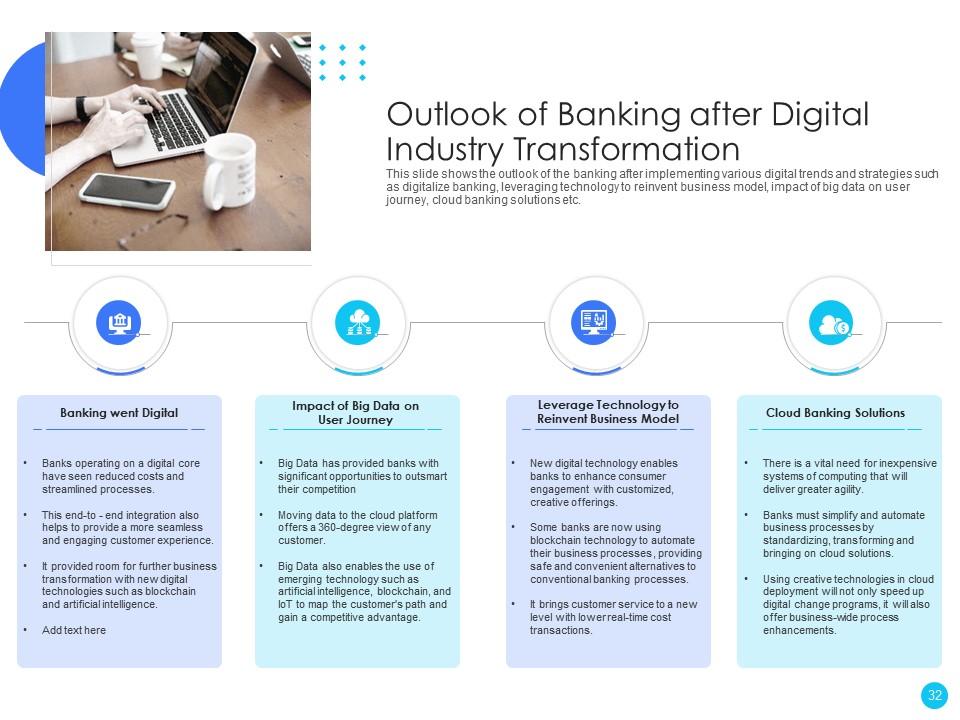
Slide 32: This slide shows the outlook of the banking after implementing various digital trends and strategies.
Slide 33: This slide exhibits title for 'Dashboards'.
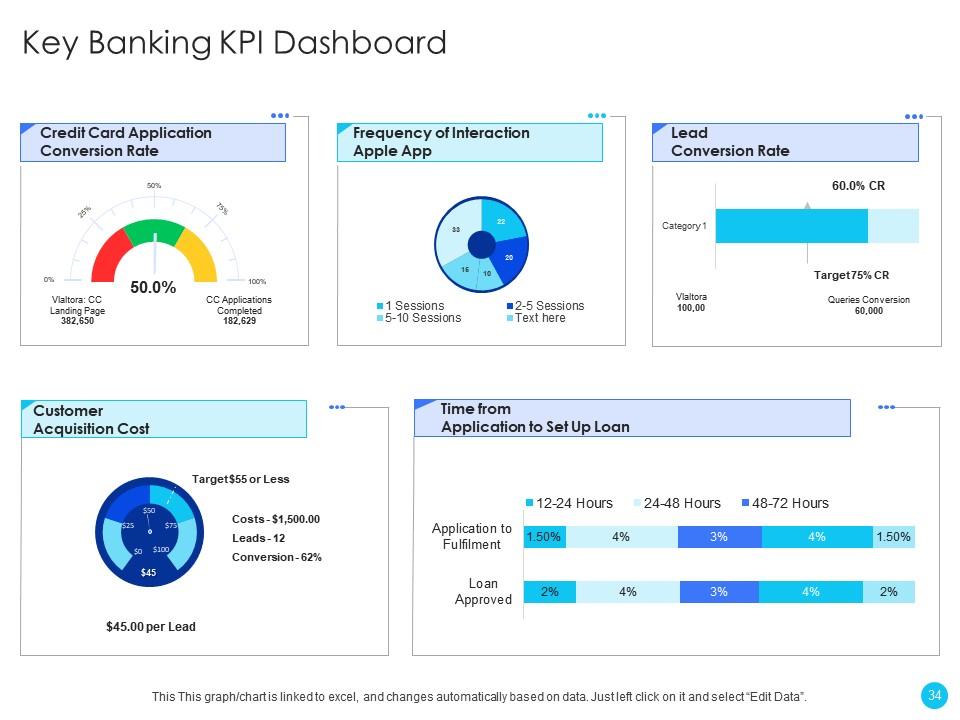
Slide 34: This slide shows 'Key Banking KPI Dashboard'.
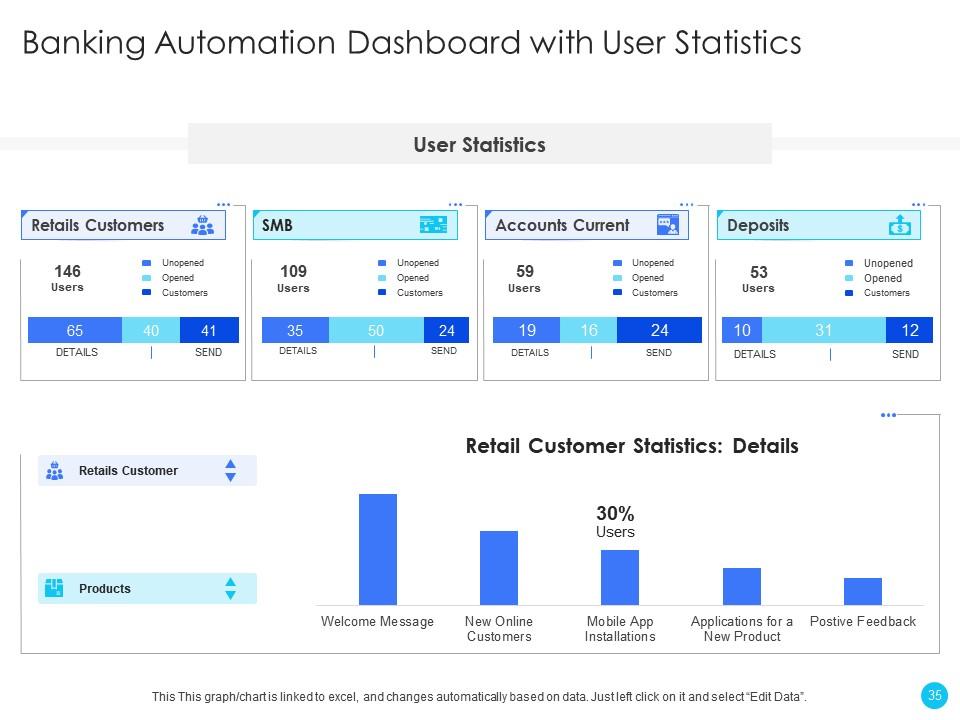
Slide 35: This slide depicts 'Banking Automation Dashboard with User Statistics'.
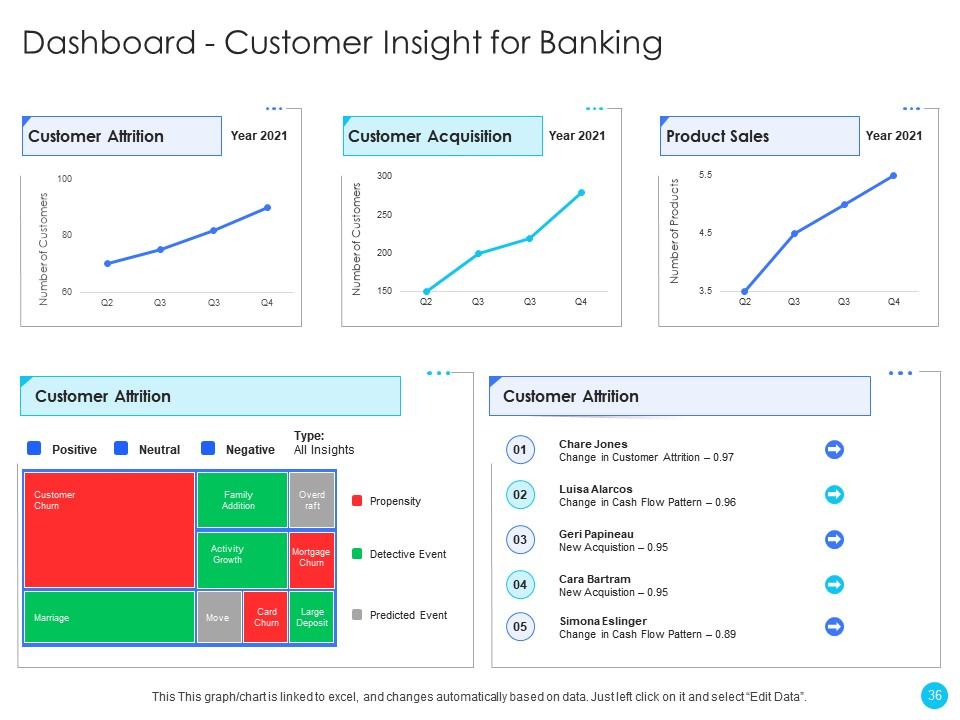
Slide 36: This slide highlights 'Dashboard - Customer Insight for Banking'.
Slide 37: This is the icons slide.
Slide 38: This slide presents title for additional slides.
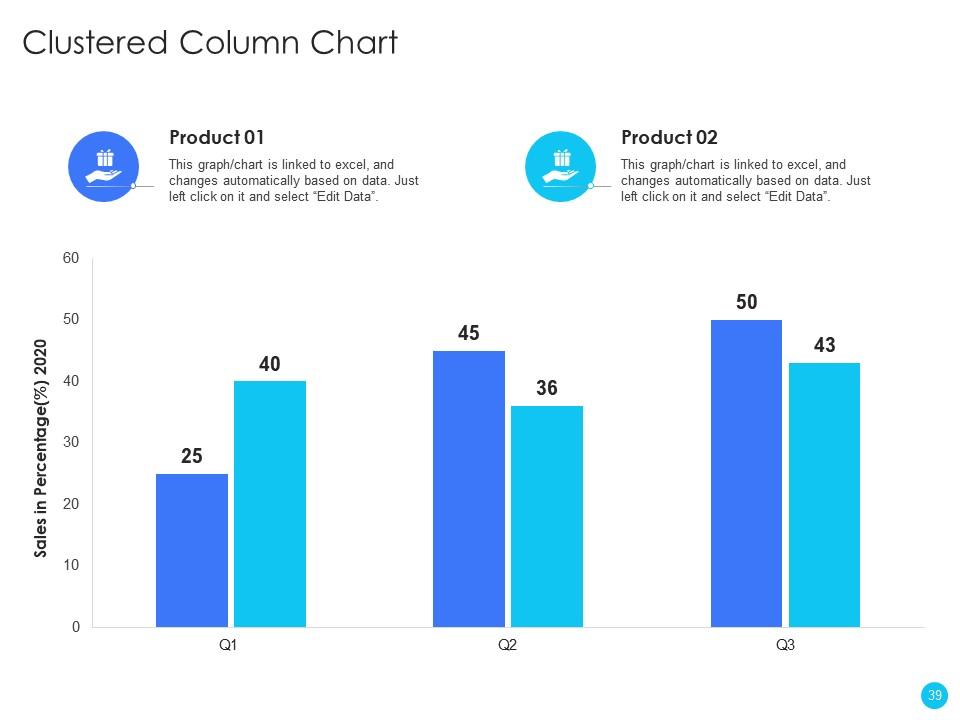
Slide 39: This slide exhibits quarterly sales clustered column charts for different products. The charts are linked to Excel.
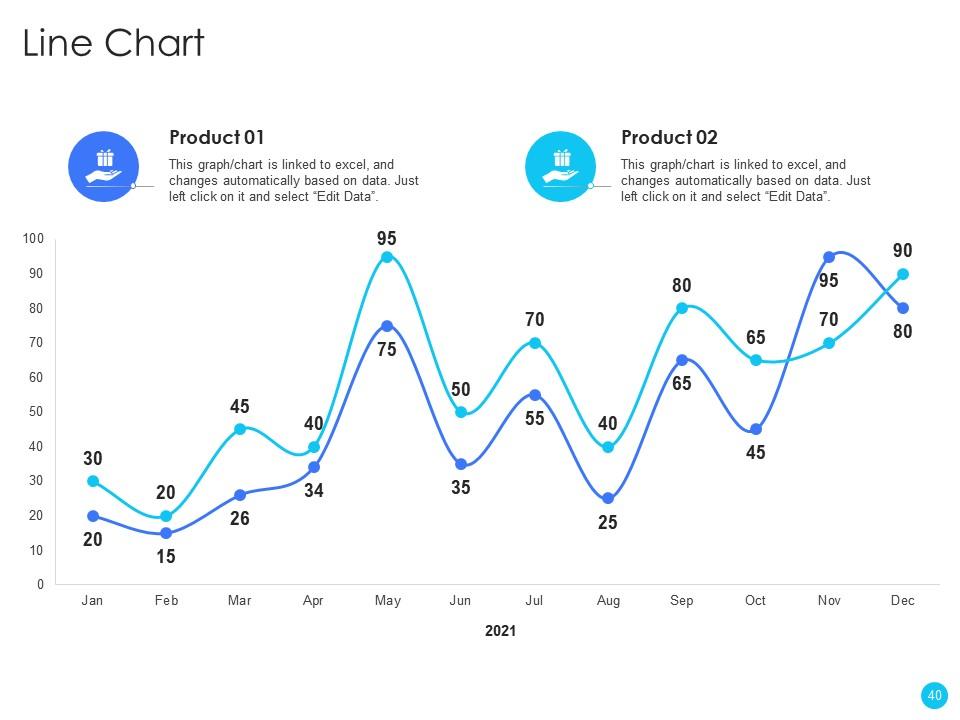
Slide 40: This slide displays monthly line charts for different products. The charts are linked to Excel.
Slide 41: This slide presents your company's vision, mission and goals.
Slide 42: This slide depicts posts for past experiences of clients.
Slide 43: This slide displays Venn.
Slide 44: This slide exhibits yearly timeline.
Slide 45: This slide shows about your company, target audience and its client's values.
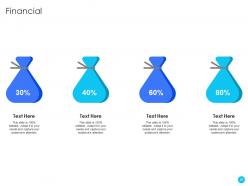
Slide 46: This slide showcases financials.
Slide 47: This slide displays targets.
Slide 48: This slide shows details of team members like name, designation, etc.
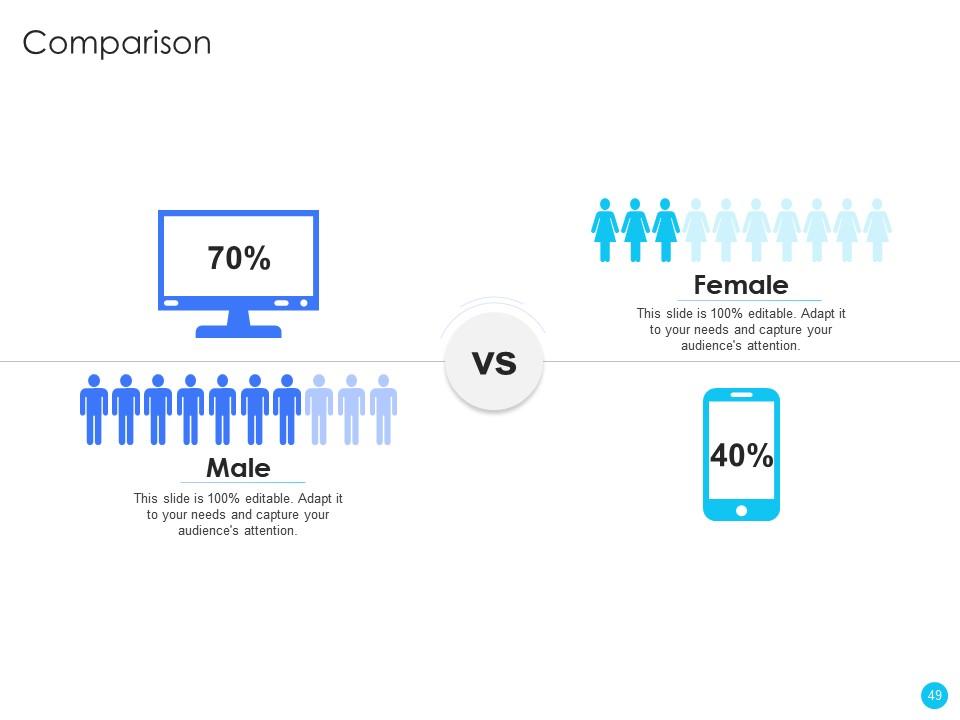
Slide 49: This slide highlights comparison of products based on selects.
Slide 50: This is thank you slide & contains contact details of company like office address, phone no., etc.
Challenges and opportunities identification in a process powerpoint presentation slides with all 50 slides:
Use our Challenges And Opportunities Identification In A Process Powerpoint Presentation Slides to effectively help you save your valuable time. They are readymade to fit into any presentation structure.
-
Content of slide is easy to understand and edit.
-
Topic best represented with attractive design.


