Characteristics of current workforce m1744 ppt powerpoint presentation professional vector
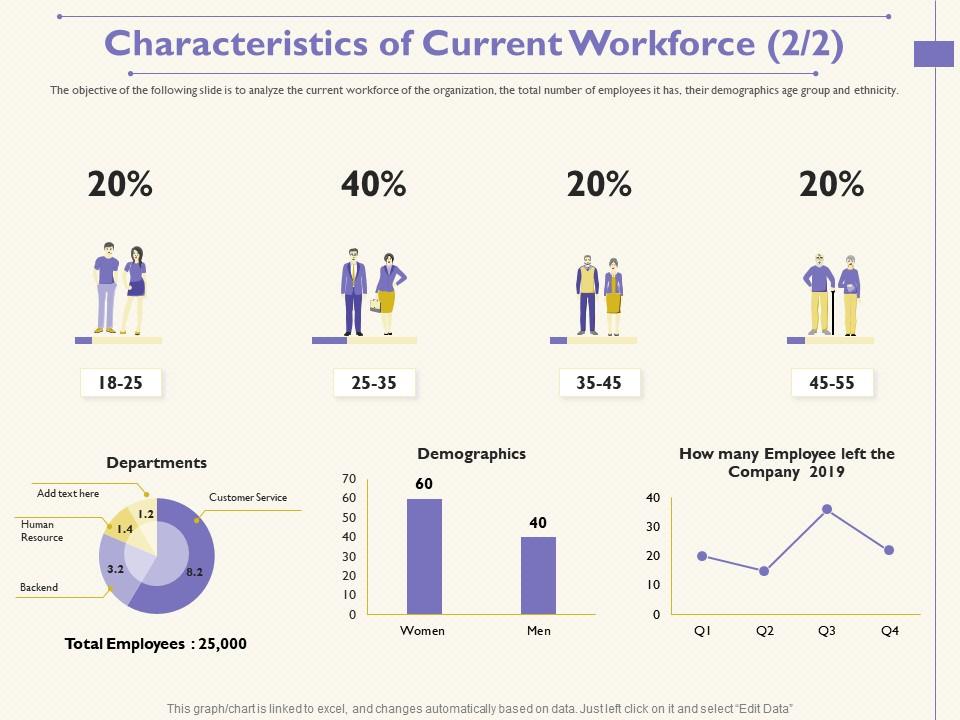
The objective of the following slide is to analyze the current workforce of the organization, the total number of employees it has, their demographics age group and ethnicity.
The objective of the following slide is to analyze the current workforce of the organization, the total number of employees..
- Google Slides is a new FREE Presentation software from Google.
- All our content is 100% compatible with Google Slides.
- Just download our designs, and upload them to Google Slides and they will work automatically.
- Amaze your audience with SlideTeam and Google Slides.
-
Want Changes to This PPT Slide? Check out our Presentation Design Services
- WideScreen Aspect ratio is becoming a very popular format. When you download this product, the downloaded ZIP will contain this product in both standard and widescreen format.
-

- Some older products that we have may only be in standard format, but they can easily be converted to widescreen.
- To do this, please open the SlideTeam product in Powerpoint, and go to
- Design ( On the top bar) -> Page Setup -> and select "On-screen Show (16:9)” in the drop down for "Slides Sized for".
- The slide or theme will change to widescreen, and all graphics will adjust automatically. You can similarly convert our content to any other desired screen aspect ratio.
Compatible With Google Slides

Get This In WideScreen
You must be logged in to download this presentation.
PowerPoint presentation slides
The objective of the following slide is to analyze the current workforce of the organization, the total number of employees it has, their demographics age group and ethnicity. Presenting this set of slides with name Characteristics Of Current Workforce M1744 Ppt Powerpoint Presentation Professional Vector. The topics discussed in these slides are Employees, Demographics, Customer Service. This is a completely editable PowerPoint presentation and is available for immediate download. Download now and impress your audience.
People who downloaded this PowerPoint presentation also viewed the following :
Content of this Powerpoint Presentation
Description:
The image represents a PowerPoint slide titled "Characteristics of Current Workforce (2/2)," indicating its place within a larger presentation focused on workforce analysis within an organization. The slide aims to provide insights into the organization's current workforce, specifically highlighting the total number of employees, their age distribution, departmental breakdown, gender demographics, and employee turnover data.
The slide is structured into three distinct sections, each presenting different facets of the workforce:
1. Age Distribution:
This section displays the age distribution of the organization's workforce in the form of percentages.
Age groups and their respective percentages are outlined: 20% aged 18-25, 40% aged 25-35, 20% aged 35-45, and another 20% in the 45-55 age bracket.
Visual representations of professionals from each age group are provided, offering a graphical summary of the age diversity within the company.
2. Departmental Breakdown:
The second section features a pie chart labeled "Departments," with a legend indicating various departments, such as Human Resources, Customer Service, and Backend.
Figures within the pie chart visually represent the departmental composition of the workforce. A placeholder encourages the addition of specific text or details.
The total number of employees in the organization is mentioned below the pie chart, totaling 25,000.
3. Gender Demographics and Employee Turnover:
In the third section, the slide delves into gender demographics, revealing that 60% of the workforce comprises women, while 40% are men.
Additionally, a line chart illustrates the number of employees who left the company in 2019 across four quarters (Q1 to Q4), reflecting fluctuations in staff retention over time.
A disclaimer at the bottom of the slide informs viewers that the graphs and charts are linked to Excel and can be automatically updated, hinting at dynamic data integration for real-time analysis.
Use Cases:
This versatile slide can find relevance across various industries and sectors, serving as a valuable tool for reporting and presenting workforce-related data. Here are potential use cases in different industries:
1. Human Resources:
Use: To report on workforce demographics and turnover.
Presenter: HR Analyst or Manager.
Audience: Company executives or HR department.
2. Education:
Use: For analyzing staff composition in educational institutions.
Presenter: Dean or Administrative Director.
Audience: Academic council or institutional stakeholders.
3. Healthcare:
Use: Reviewing the employee age distribution and departmental staffing in a hospital.
Presenter: Hospital Administrator.
Audience: Hospital board members or department heads.
4. Information Technology:
Use: To present the composition of technical and support staff within an IT company.
Presenter: CTO or IT Department Lead.
Audience: Company management or IT team members.
5. Retail:
Use: Exhibition of employee statistics within different retail departments.
Presenter: Head of Retail Operations.
Audience: Retail management and corporate officers.
6. Finance:
Use: Evaluating age demographics and departmental spread in a financial firm.
Presenter: CFO or Finance Manager.
Audience: Investors or the finance department.
7. Government:
Use: To showcase statistics on public sector employees' demographics.
Presenter: Public Affairs Officer or Department Head.
Audience: Government officials, policymakers, or the public.
Characteristics of current workforce m1744 ppt powerpoint presentation professional vector with all 2 slides:
Use our Characteristics Of Current Workforce M1744 Ppt Powerpoint Presentation Professional Vector to effectively help you save your valuable time. They are readymade to fit into any presentation structure.
-
Nice and innovative design.


