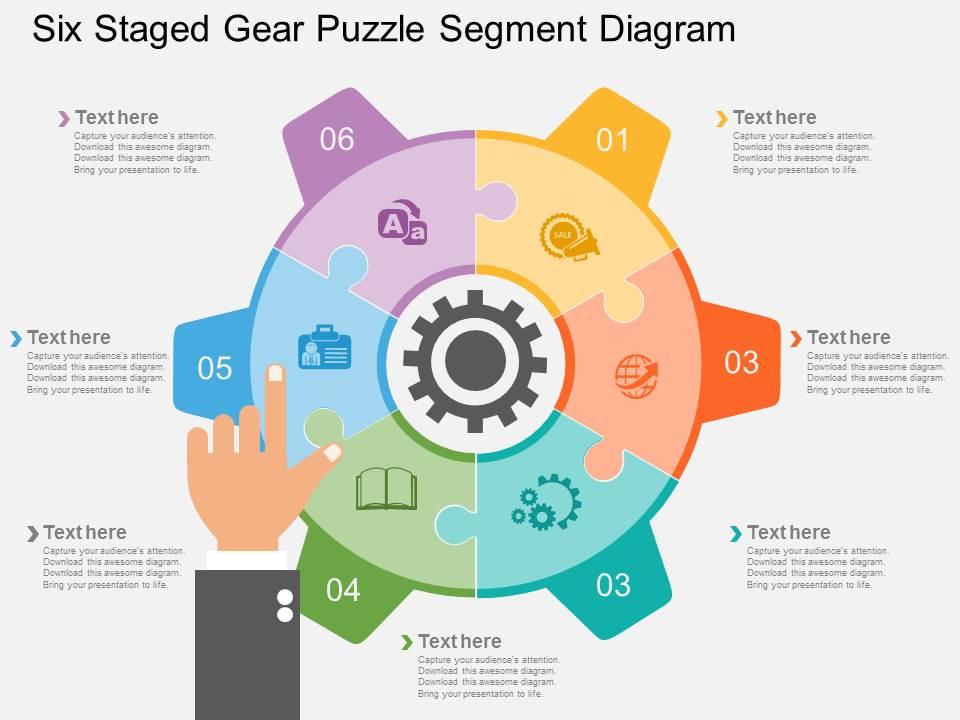
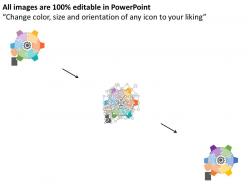
Cj six staged gear puzzle segment diagram flat powerpoint design

Rating:
80%
Cj six staged gear puzzle segment diagram flat powerpoint design
Slide 1 of 4
Favourites Favourites

Try Before you Buy Download Free Sample Product

Audience Impress Your
Audience
Editable 100%
Editable
Time Save Hours
of Time
The Biggest Sale is ending soon in
0
0
:
0
0
:
0
0
Rating:
80%
Presenting cj six staged gear puzzle segment diagram flat powerpoint design. Six staged gear puzzle segment diagram has been used to craft this power point template diagram. This PPT diagram contains the concept of business process control representation .Use this PPT diagram for business and marketing related presentations.

People who downloaded this PowerPoint presentation also viewed the following :

FAQs for Cj six staged gear puzzle segment diagram

The key components include interconnected gear wheels, sequential stage indicators, directional flow arrows, problem-solving pathways, and outcome measurement points. This strategic visualization tool enhances project management and process optimization by illustrating complex workflows, identifying bottlenecks, and streamlining decision-making sequences, with many organizations finding that such systematic approaches ultimately deliver improved operational efficiency and clearer strategic alignment.

The CJ six-staged gear puzzle effectively illustrates interconnected project phases, showing how planning, initiation, execution, monitoring, control, and closure work together sequentially. This visual metaphor demonstrates that each project stage must engage properly for smooth progression, helping teams understand dependencies, identify bottlenecks, and streamline workflow coordination, ultimately delivering enhanced project visibility and operational efficiency.

The six-staged design enhances understanding by breaking complex concepts into digestible sequential phases, creating visual hierarchy through progressive revelation, and enabling audiences to follow logical development patterns step-by-step. This structured approach streamlines knowledge transfer across organizations, with many training departments and strategic planning teams finding that segmented presentations significantly improve comprehension rates and decision-making processes.

Visual elements crucial for effectively communicating concepts within the six-staged gear puzzle segment diagram include clear gear iconography, distinct color coding for each stage, directional arrows showing process flow, consistent typography, and strategic spacing between components. These design elements streamline complex information by enhancing visual hierarchy, enabling immediate stage identification, and facilitating seamless navigation through interconnected processes, ultimately delivering improved audience comprehension and engagement.

The CJ six-staged gear puzzle segment diagram uses interlocking circular gear visuals to represent interconnected processes, while traditional flowcharts rely on linear boxes and arrows showing sequential steps. This gear-based approach emphasizes how each stage mechanically depends on others, making it particularly effective for illustrating complex operational workflows in manufacturing, project management, and system integration processes where simultaneous coordination is essential.

Industries with complex multi-stage processes benefit most from six-staged gear puzzle diagrams, including manufacturing, project management, software development, financial services, and supply chain management. These sectors leverage such visuals to illustrate interconnected workflows, operational dependencies, and sequential processes, ultimately enhancing stakeholder understanding and streamlining communication across teams.

Strategic use of colors and shapes in the six-staged gear puzzle segment diagram significantly enhances audience engagement by creating visual hierarchy, improving information retention, and facilitating pattern recognition across complex processes. These design elements enable viewers to distinguish between stages more effectively, process relationships faster, and maintain attention longer, with many organizations finding that well-designed visual frameworks increase comprehension rates and presentation impact.

Common mistakes include overcrowding segments with excessive text, using inconsistent color schemes across stages, failing to maintain proportional sizing between gear components, neglecting clear directional flow indicators, and omitting logical connections between sequential phases. These presentation errors undermine audience comprehension and engagement, with many organizations finding that streamlined visual hierarchy, strategic color coding, and balanced information density ultimately deliver clearer communication and stronger stakeholder understanding.

Animations enhance the six-staged gear puzzle diagram through sequential reveals, synchronized gear rotations, and progressive stage highlighting that mirror real mechanical processes. These dynamic elements transform static presentations into compelling narratives, with many organizations finding that animated workflows increase audience engagement by 40%, ultimately delivering clearer process understanding and stronger stakeholder buy-in.

The six-staged framework provides a structured approach to strategic planning by breaking complex initiatives into manageable phases, enabling systematic progress tracking, resource allocation, and risk mitigation throughout execution. This methodology helps organizations maintain strategic focus while adapting to market changes, with many businesses finding that staged implementation reduces project failures, enhances team alignment, and ultimately delivers more predictable outcomes and competitive advantage.

**INPUT**: How can the CJ six-staged gear puzzle help in identifying bottlenecks in a process? **OUTPUT**: The CJ six-staged gear puzzle segment diagram visualizes process interdependencies, enabling managers to identify bottlenecks by mapping workflow connections, analyzing gear interactions, and pinpointing constraint points across sequential stages. This visual approach streamlines bottleneck analysis by highlighting critical path dependencies, resource allocation gaps, and timing mismatches, with many organizations finding that gear-based process mapping delivers faster problem identification and enhanced operational efficiency.

**INPUT**: What software tools are recommended for creating professional-looking gear diagrams? **OUTPUT**: Professional gear diagram creation tools include AutoCAD, SolidWorks, Visio, Lucidchart, and specialized PowerPoint templates with pre-designed mechanical components. These platforms streamline technical visualization by offering precision drawing capabilities, extensive symbol libraries, and collaborative features, with many engineering teams and manufacturing organizations finding that template-based solutions significantly reduce design time while maintaining professional standards.

This diagram facilitates better collaboration by providing a visual framework for complex processes, enabling teams to align on sequential stages, identify dependencies, and coordinate responsibilities more effectively. Through clear segmentation of workflows, team members can better understand their roles within the larger process, streamline handoffs between departments, and ultimately deliver more cohesive outcomes.

**INPUT**: What are the best practices for labeling and annotating each stage in the gear puzzle? **OUTPUT**: Best practices include using consistent terminology, sequential numbering, clear descriptive headers, color-coded annotations, and concise explanatory text for each stage. These approaches enhance audience comprehension by maintaining visual hierarchy, reducing cognitive load, and ensuring seamless information flow, with many organizations finding that strategic labeling ultimately delivers stronger stakeholder engagement and clearer process communication.

The CJ diagram's iterative six-stage structure aligns perfectly with continuous improvement cycles by enabling systematic progression through problem identification, analysis, solution development, implementation, evaluation, and refinement phases. This cyclical approach supports methodologies like Kaizen and Lean Six Sigma, with manufacturing teams, healthcare organizations, and service providers finding that each iteration builds upon previous learnings, ultimately delivering enhanced operational efficiency and sustainable process optimization.

Ratings and Reviews

80% of 100
Review Form
Write a review
Most Relevant Reviews
  1. 80%

    by Jake Smith

    Innovative and Colorful designs.
  2. 80%

    by Johnson Morris

    Wonderful templates design to use in business meetings.

2 Item(s)

per page: