Strategic overview of oil and gas industry case competition powerpoint presentation slides
Our strategic overview of oil and gas industry case competition PPT template helps you identify the key problems and challenges faced by companies in the oil and gas sector. It offers recommendations and risk management strategies to help you tackle these challenges. This operational challenges in the oil and gas industry PPT slideshow gives you the industry overview, including future growth perspective, recent and prospective trends, key factors that affect growth, and more. Our oil and gas industry trends and challenges PPT theme helps you to explore key performance indicators and key market players. It helps you devise a plan of action to meet those parameters and get on the route to growth and success. This oil and gas industry strategic recommendations PPT layout explains risk management strategies to secure your company against potential dangers that threaten to wreck your company. Download our oil and gas industry inspection PPT set today.
Our strategic overview of oil and gas industry case competition PPT template helps you identify the key problems and challe..
- Google Slides is a new FREE Presentation software from Google.
- All our content is 100% compatible with Google Slides.
- Just download our designs, and upload them to Google Slides and they will work automatically.
- Amaze your audience with SlideTeam and Google Slides.
-
Want Changes to This PPT Slide? Check out our Presentation Design Services
- WideScreen Aspect ratio is becoming a very popular format. When you download this product, the downloaded ZIP will contain this product in both standard and widescreen format.
-

- Some older products that we have may only be in standard format, but they can easily be converted to widescreen.
- To do this, please open the SlideTeam product in Powerpoint, and go to
- Design ( On the top bar) -> Page Setup -> and select "On-screen Show (16:9)” in the drop down for "Slides Sized for".
- The slide or theme will change to widescreen, and all graphics will adjust automatically. You can similarly convert our content to any other desired screen aspect ratio.
Compatible With Google Slides

Get This In WideScreen
You must be logged in to download this presentation.
PowerPoint presentation slides
Presenting our illustrative strategic overview of oil and gas industry case competition PowerPoint template. This PPT presentation is available for download in both standard and widescreen formats. You can easily edit the content inside the PPT design. It is compatible with all prominent presentation software, including Microsoft Office and Google Slides, among others. This PPT slide can also be edited for print and digital formats such as JPEG, PNG, and PDF.
People who downloaded this PowerPoint presentation also viewed the following :
Content of this Powerpoint Presentation
Slide 1: This title slide introduces the Strategic Overview of the Oil and Gas Industry (Case Competition). Add the name of your company here.
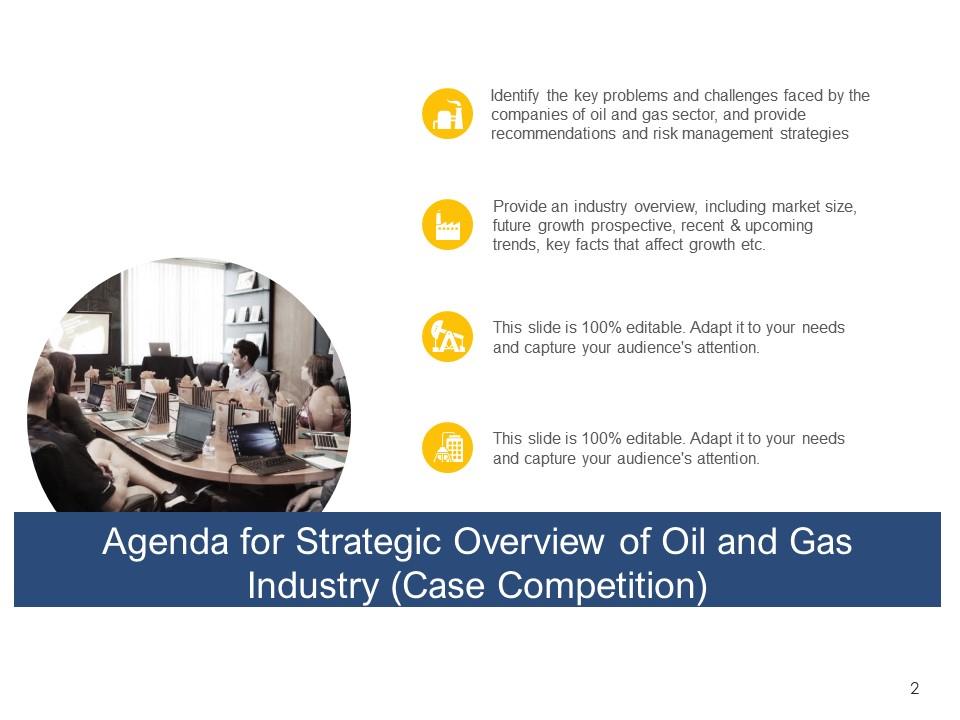
Slide 2: This is the Agenda slide for the Strategic Overview of the Oil and Gas Industry (Case Competition).
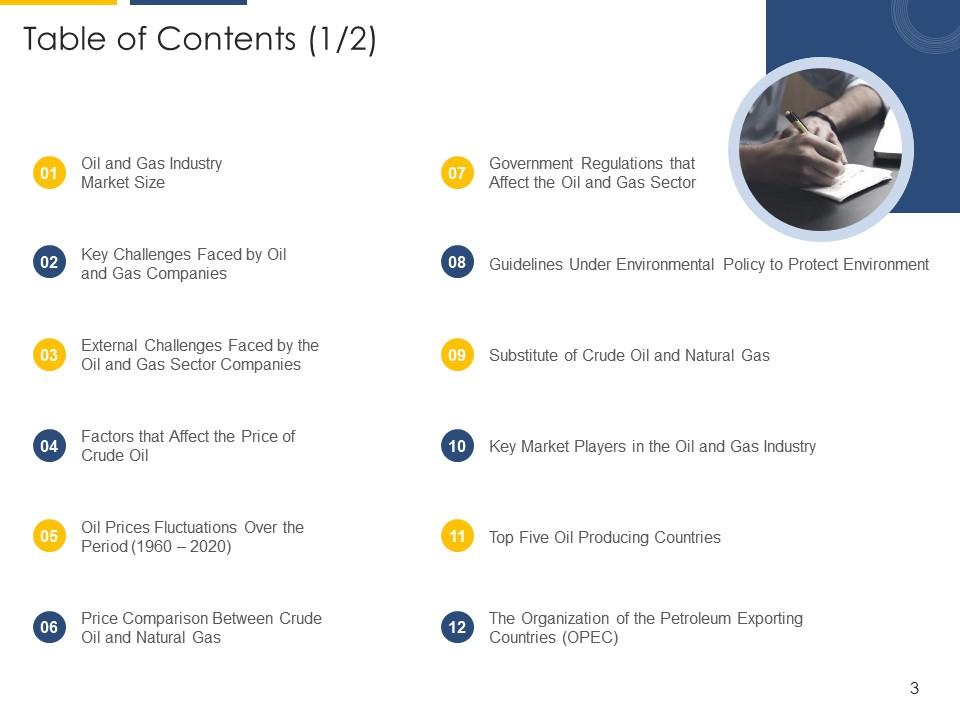
Slide 3: This slide contains the Table of Contents (1/2). It includes - Oil and Gas Industry Market Size, Key Challenges Faced by Oil and Gas Companies, External Challenges Faced by Oil and Gas Sector Companies, etc.
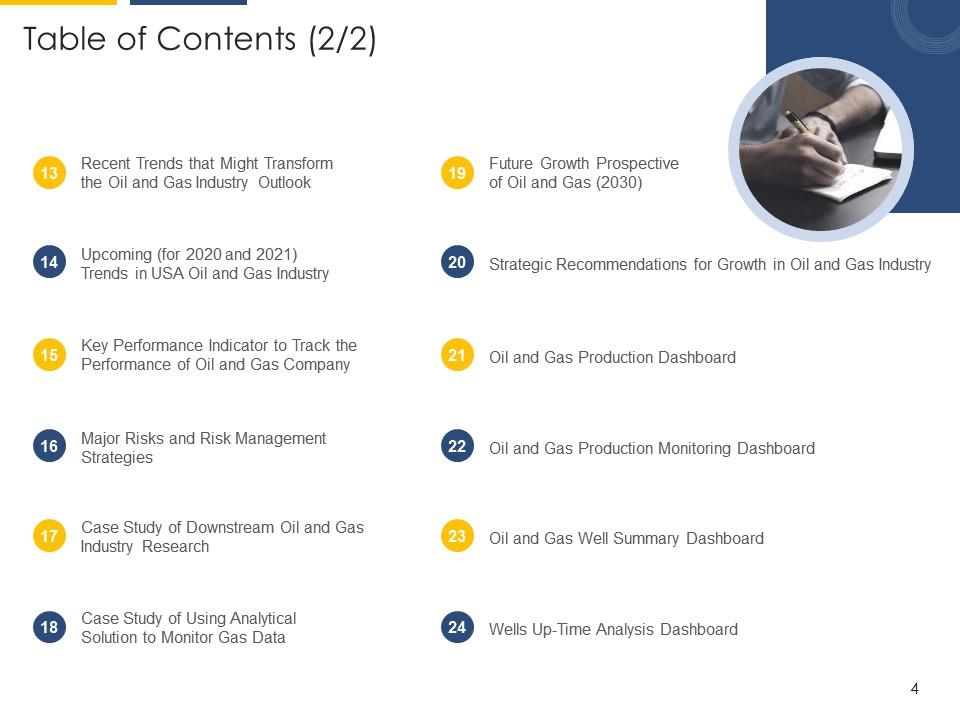
Slide 4: This slide contains the Table of Contents (2/2). It includes - Recent Trends that Might Transform the Oil and Gas Industry Outlook, Upcoming (for 2020 and 2021) Trends in USA Oil and Gas Industry, Key Performance Indicator to Track the Performance of Oil and Gas Company, etc.
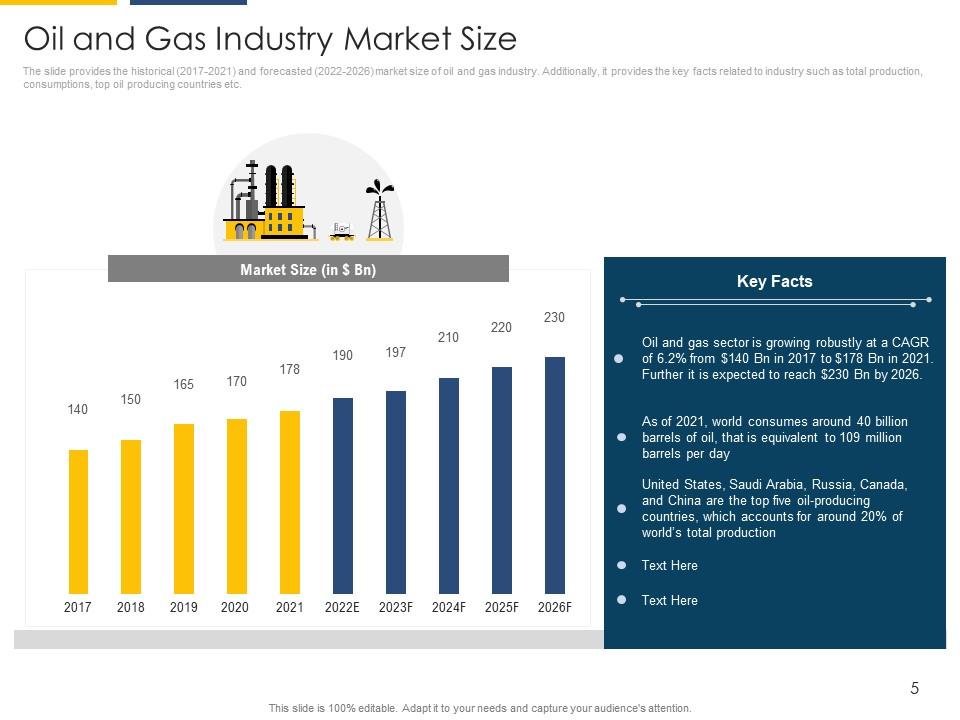
Slide 5: This slide presents the Oil and Gas Industry Market Size. It provides the historical (2017-2021) and forecasted (2022-2026) market size of the oil and gas industry.
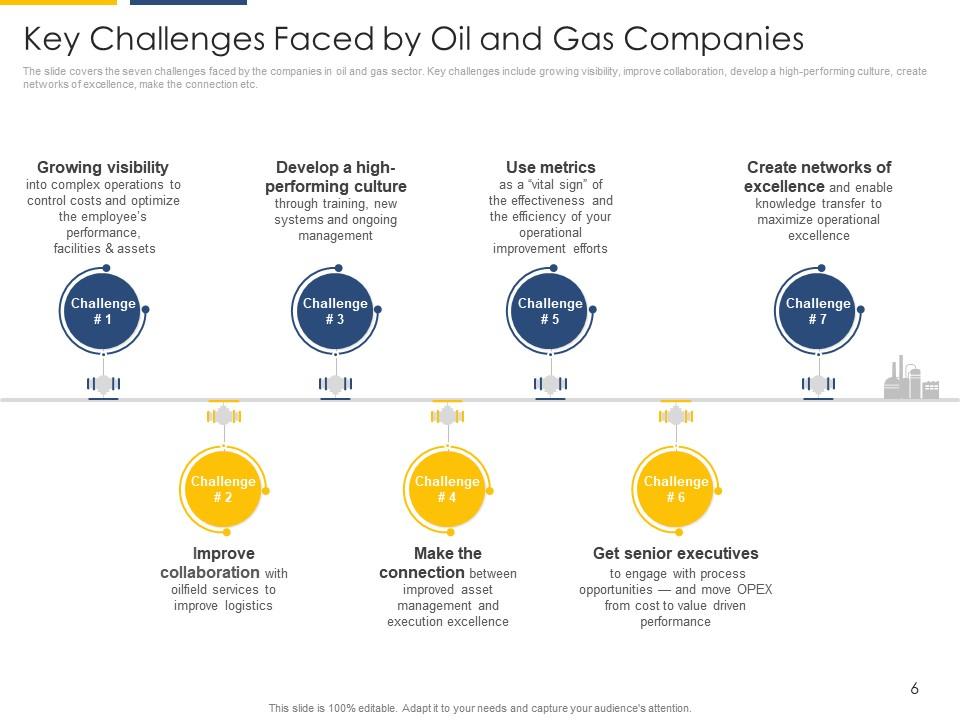
Slide 6: This slide presents the Key Challenges Faced by Oil and Gas Companies. It covers the seven challenges faced by the companies in the oil and gas sector.
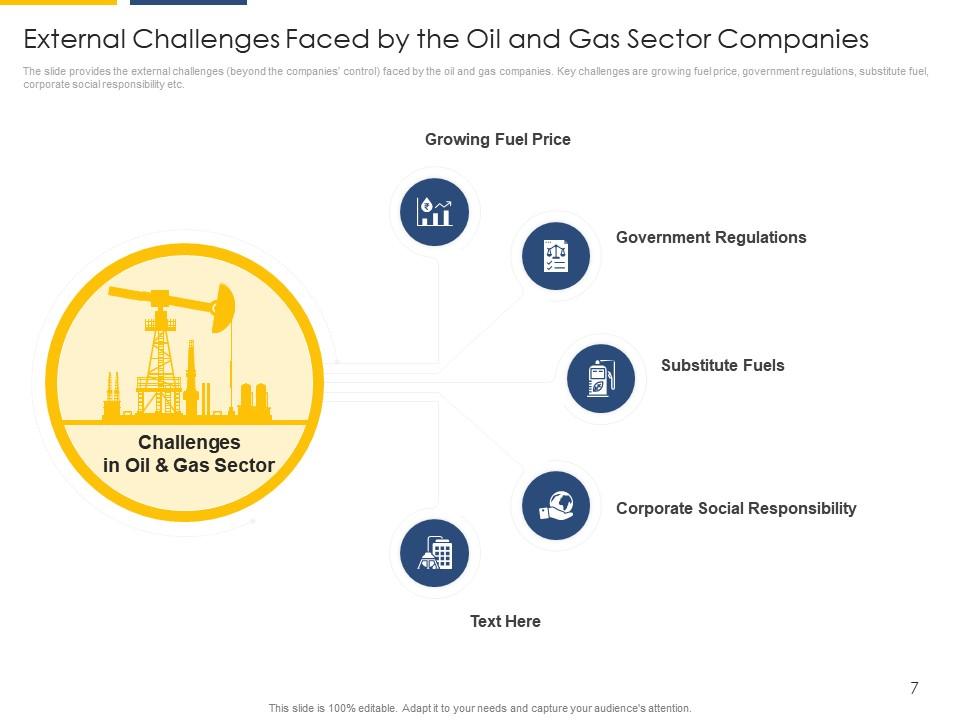
Slide 7: This slide presents the External Challenges Faced by the Oil and Gas Sector Companies. It provides the external challenges (beyond the companies’ control) faced by the oil and gas companies.
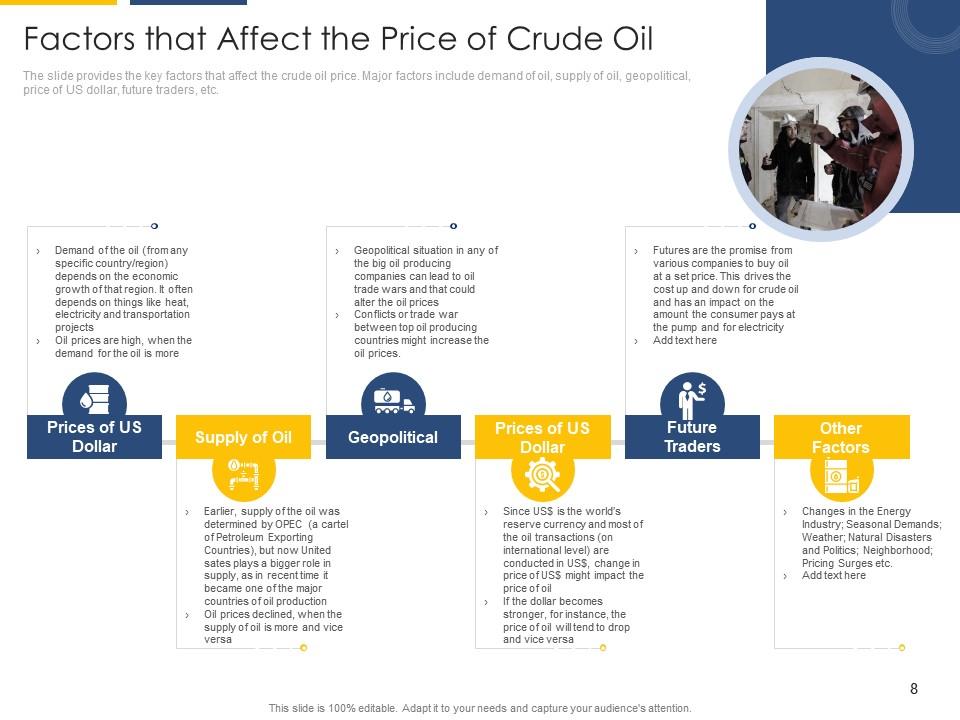
Slide 8: This slide presents the Factors that Affect the Price of Crude Oil. It provides the key factors that affect the crude oil price. Major factors include demand of oil, supply of oil, geopolitical, price of US dollar, future traders, etc.
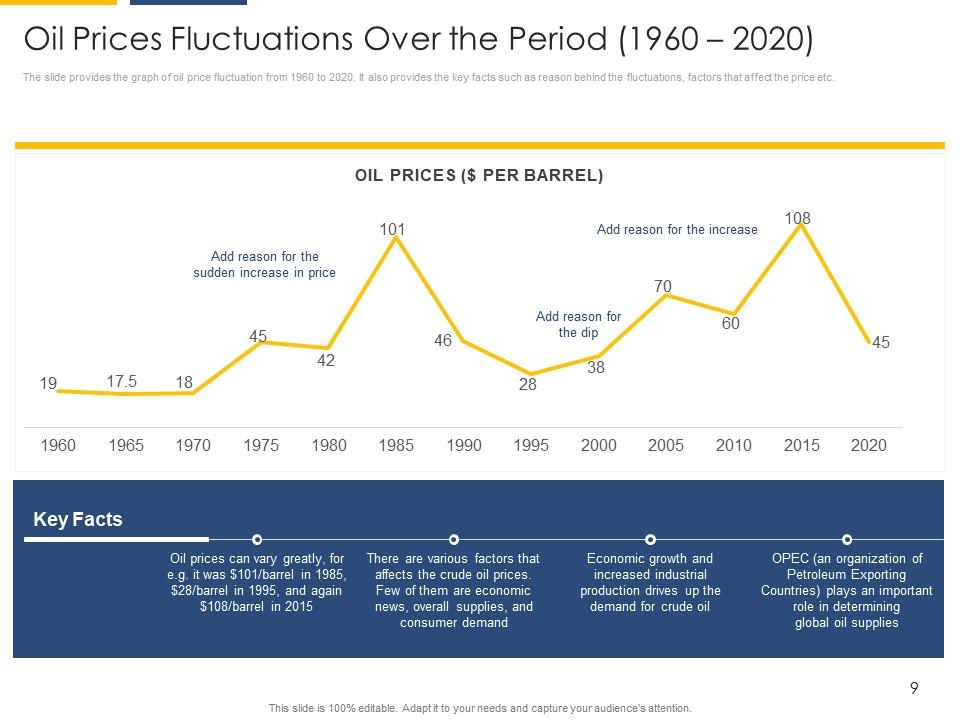
Slide 9: This slide presents the Oil Prices Fluctuations Over the Period (1960 – 2020). It provides the graph of oil price fluctuation from 1960 to 2020. It also provides the key facts such as the reason behind the fluctuations, factors that affect the price, etc.
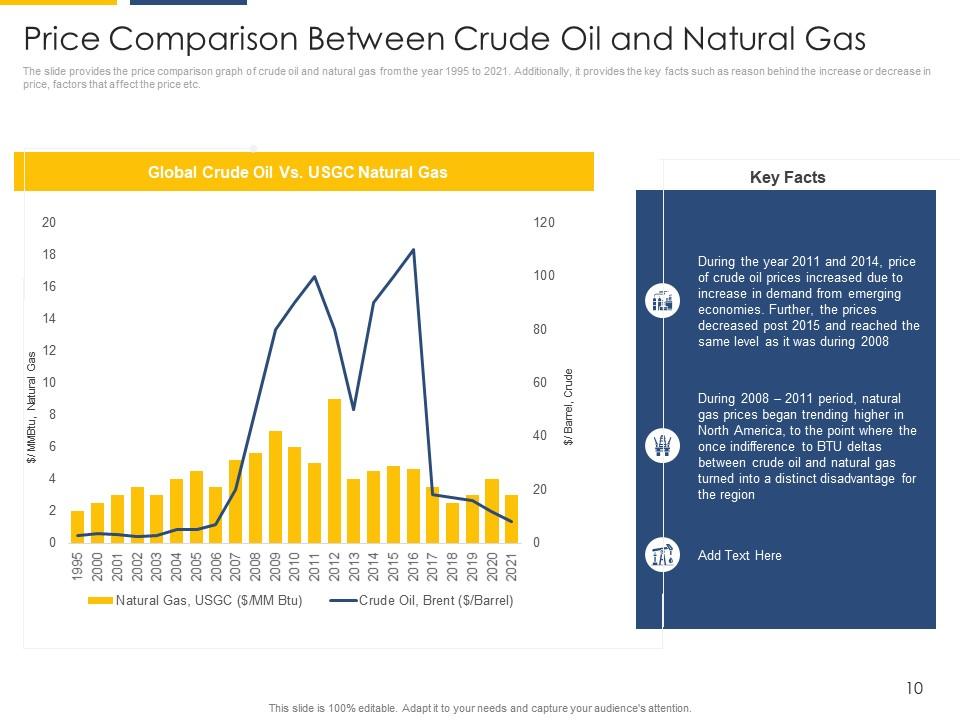
Slide 10: This slide presents the Price Comparison Between Crude Oil and Natural Gas. It provides the price comparison graph of crude oil and natural gas from the year 1995 to 2021.
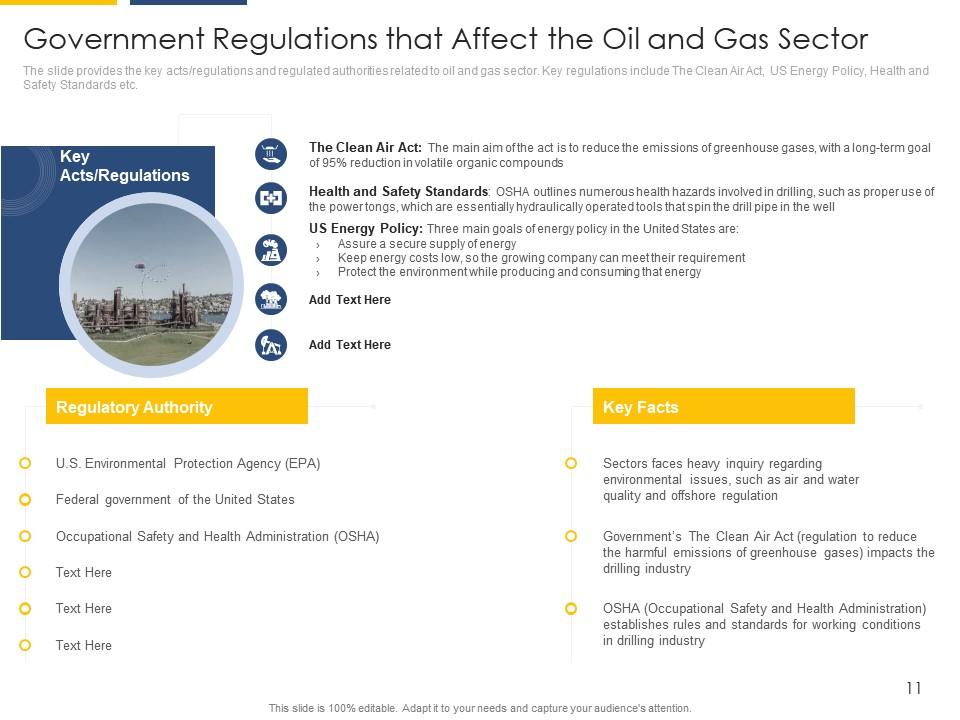
Slide 11: This slide presents the Government Regulations that Affect the Oil and Gas Sector. It provides the key acts/regulations and regulated authorities related to the oil and gas sector. Key regulations include The Clean Air Act, US Energy Policy, Health, and Safety Standards, etc.
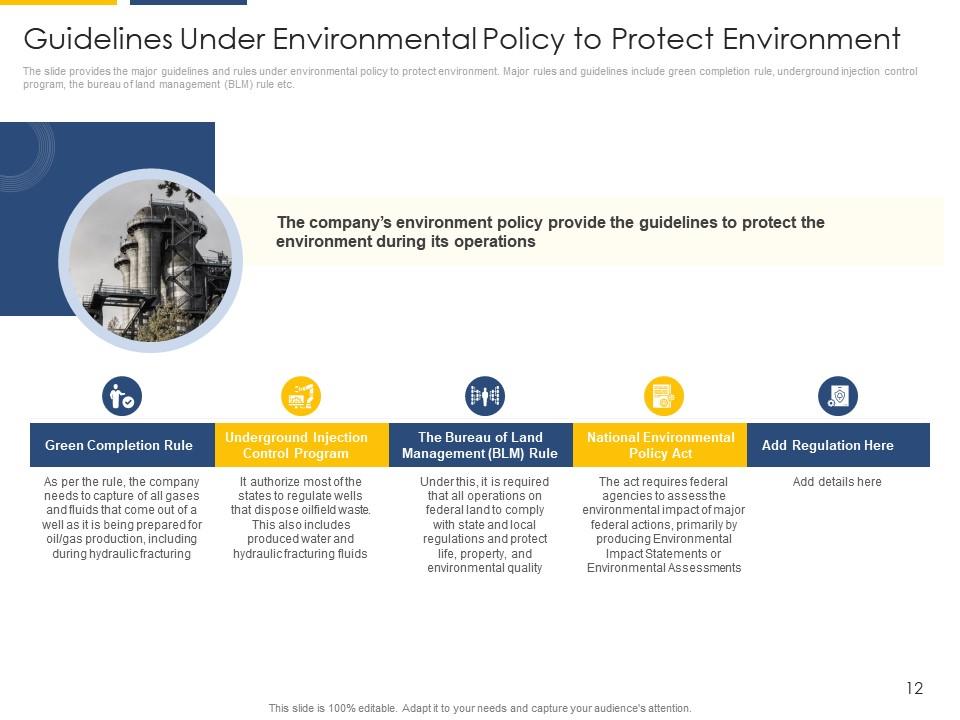
Slide 12: This slide presents the Guidelines Under Environmental Policy to Protect Environment. It provides the major guidelines and rules under the environmental policy to protect the environment.
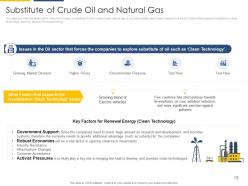
Slide 13: This slide presents the Substitute of Crude Oil and Natural Gas. It provides detail about clean technology, a substitute for crude oil and natural gas.
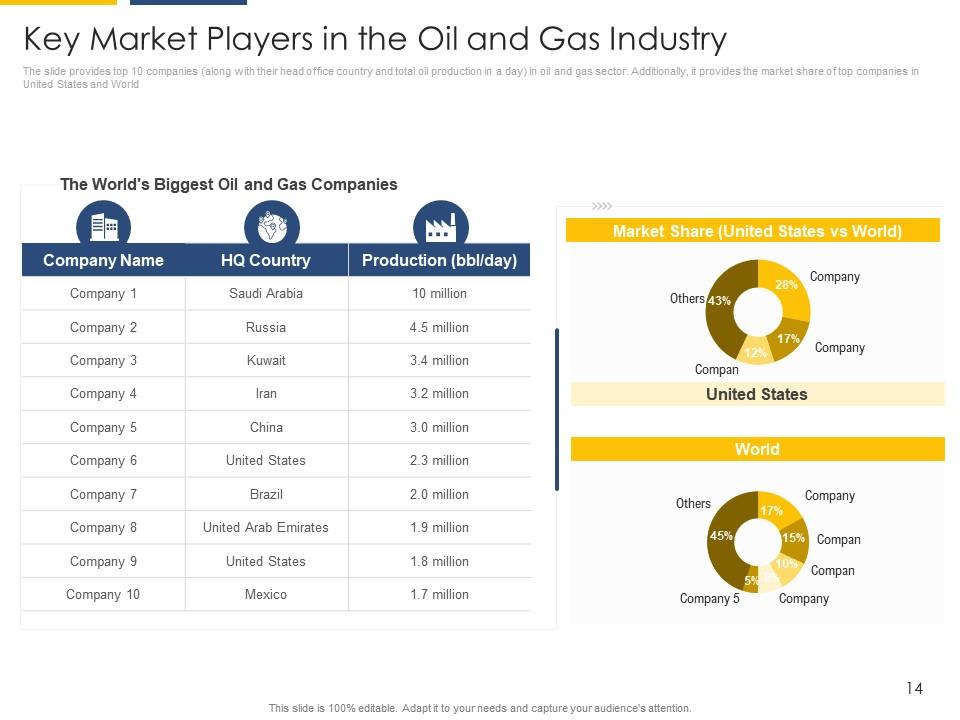
Slide 14: This slide presents the Key Market Players in the Oil and Gas Industry. It provides top 10 companies (along with their head office country and total oil production in a day) in the oil and gas sector.
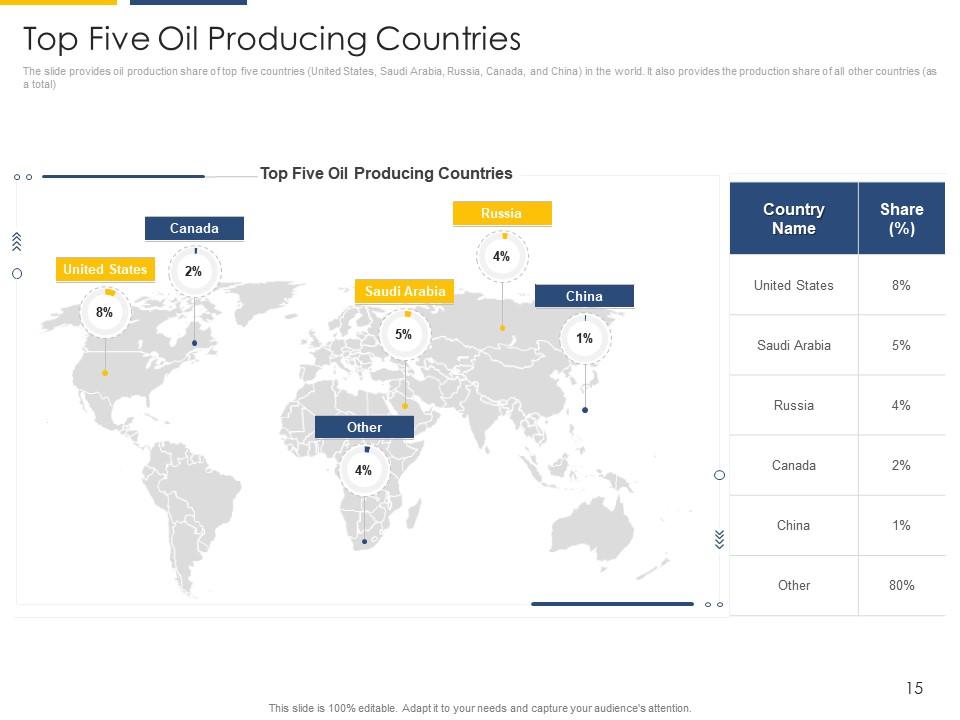
Slide 15: This slide presents the Top Five Oil Producing Countries. It provides oil production share of the top five countries (United States, Saudi Arabia, Russia, Canada, and China) in the world.
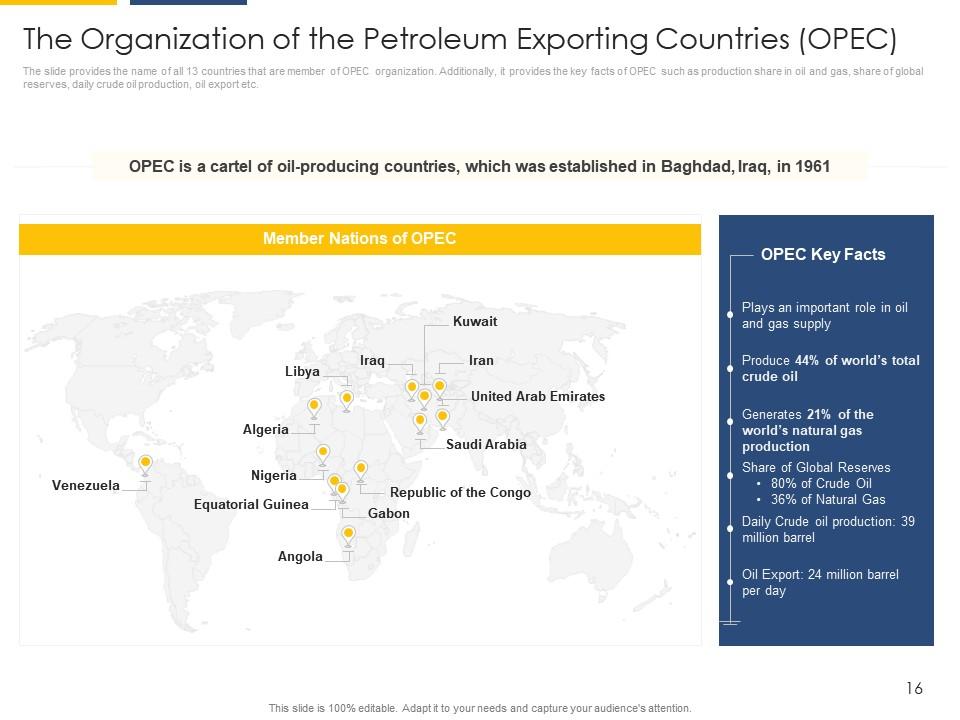
Slide 16: This slide presents The Organization of the Petroleum Exporting Countries (OPEC). It provides the name of all 13 countries that are members of the OPEC organization.
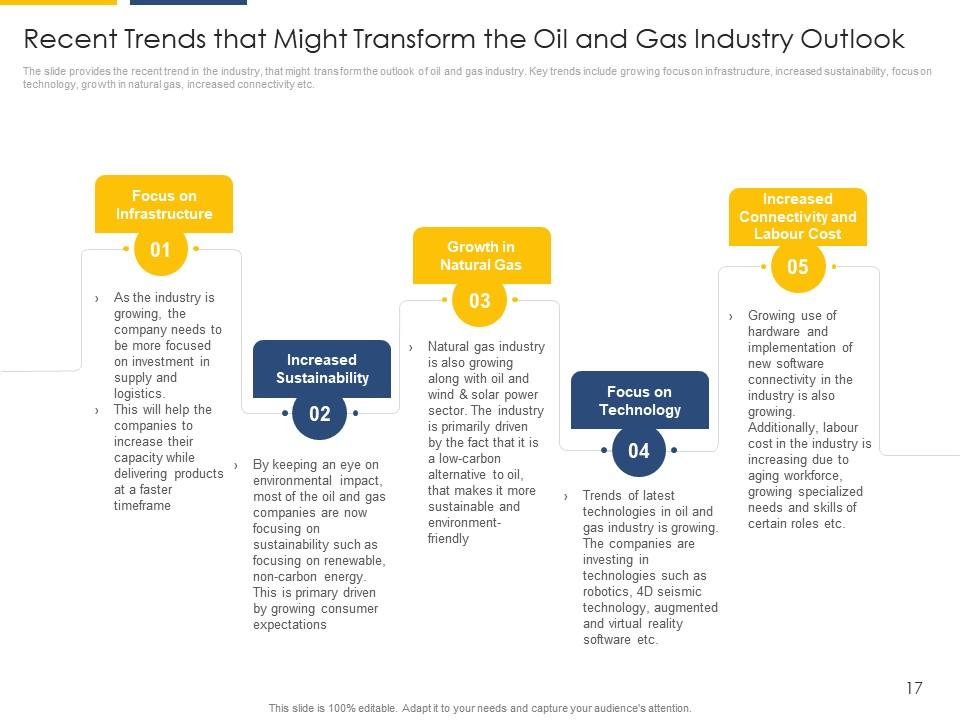
Slide 17: This slide presents the Recent Trends that Might Transform the Oil and Gas Industry Outlook. It provides the recent trend in the industry, that might transform the outlook of the oil and gas industry.
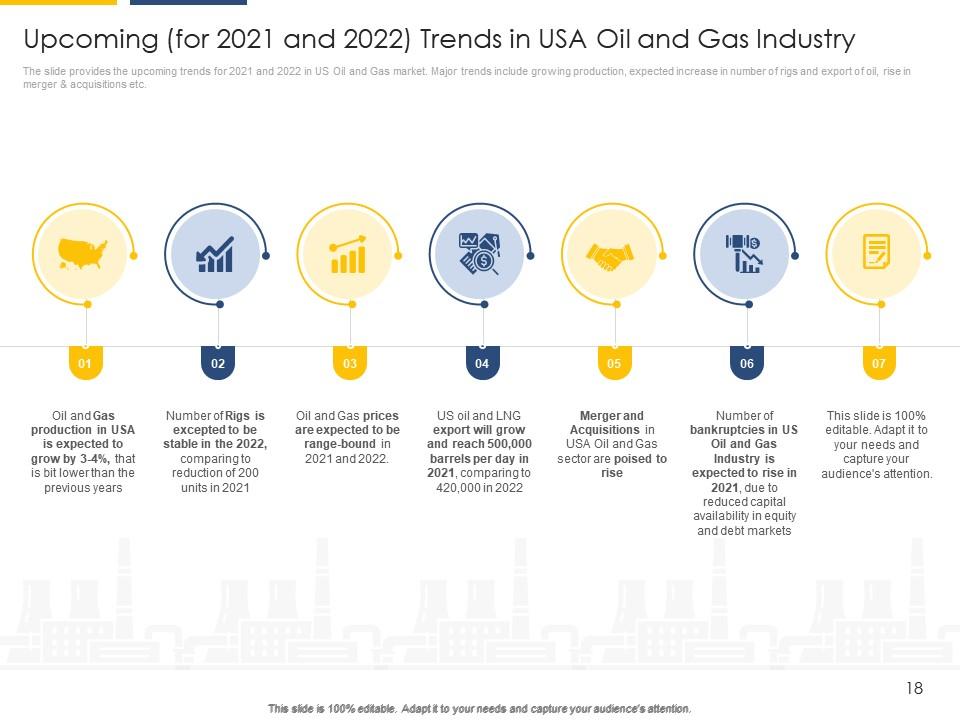
Slide 18: This slide presents the Upcoming (for 2021 and 2022) Trends in USA Oil and Gas Industry. It provides the upcoming trends for 2021 and 2022 in US Oil and Gas market.
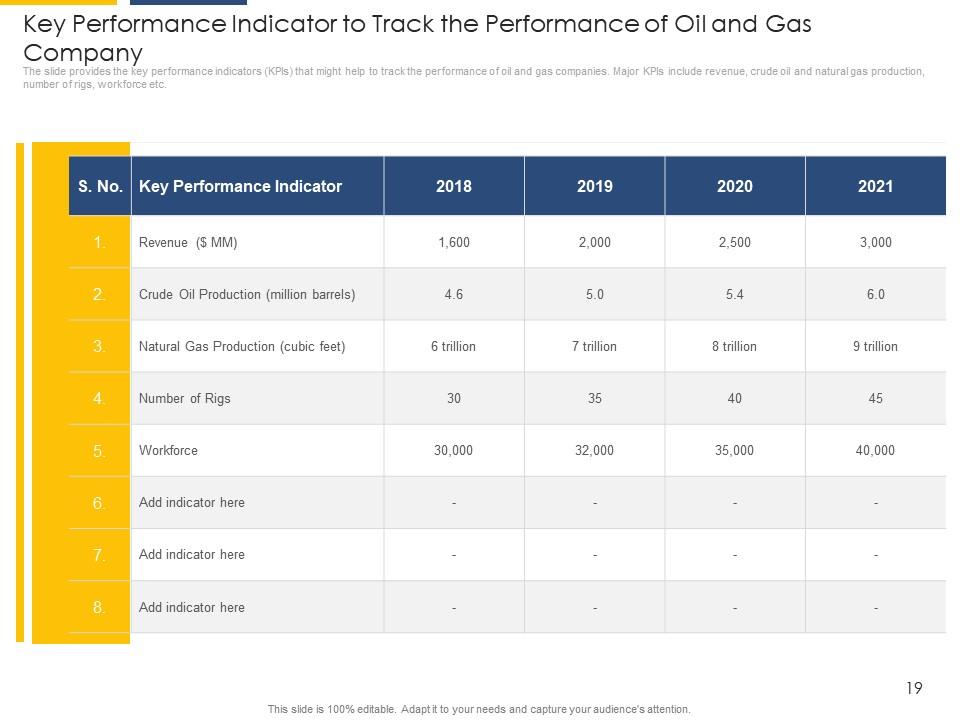
Slide 19: This slide presents the Key Performance Indicator to Track the Performance of Oil and Gas Company. It provides the key performance indicators (KPIs) that might help to track the performance of oil and gas companies.
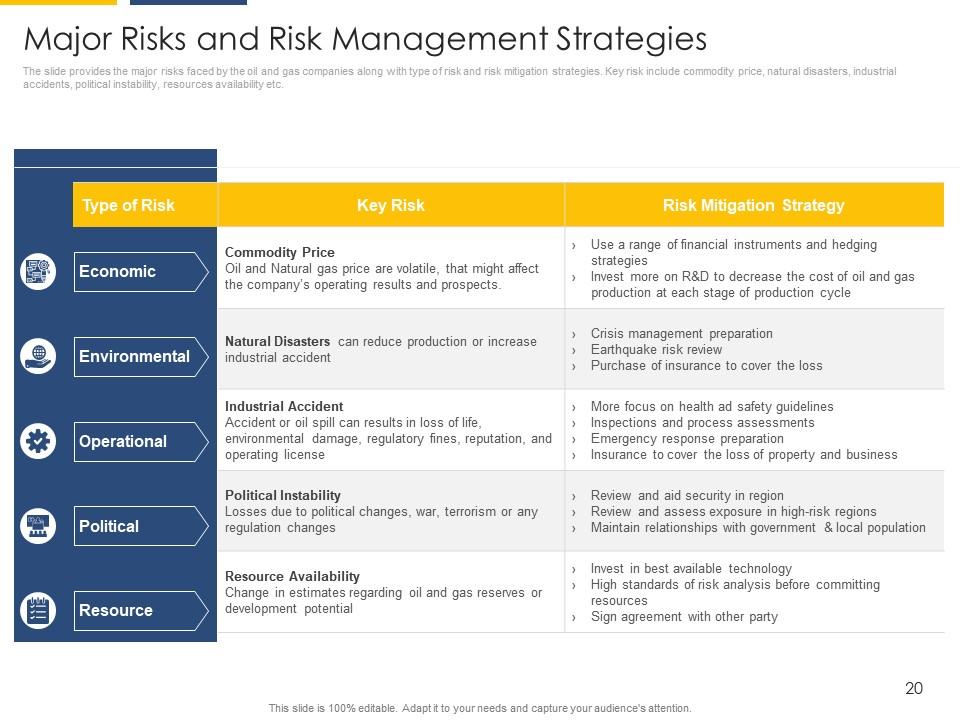
Slide 20: This slide presents the Major Risks and Risk Management Strategies. It provides the major risks faced by the oil and gas companies along with the type of risk and risk mitigation strategies.
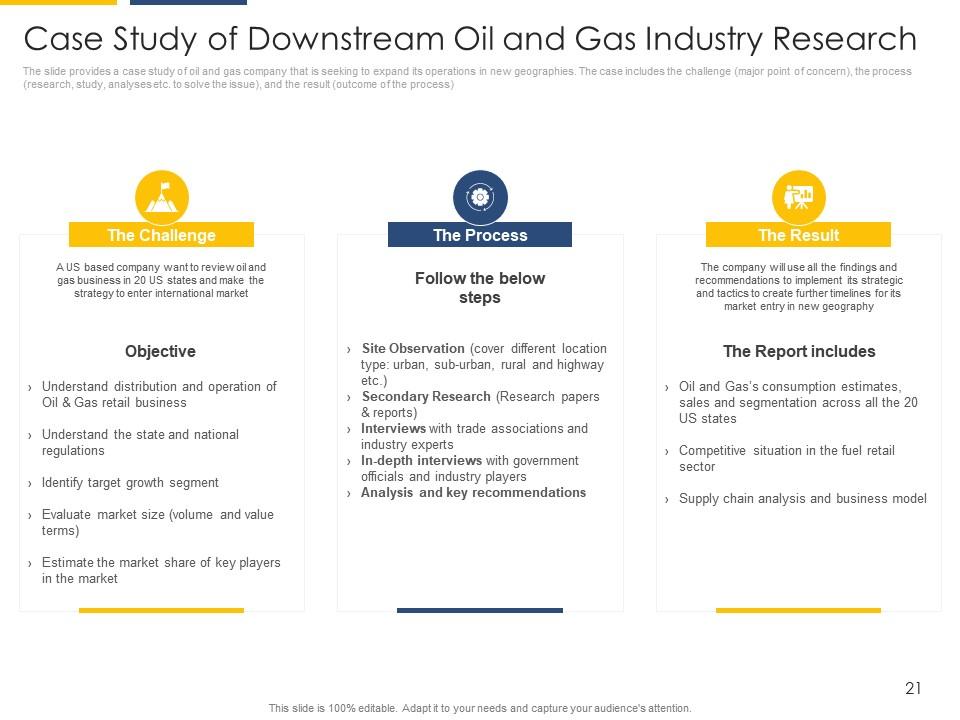
Slide 21: This slide presents the Case Study of Downstream Oil and Gas Industry Research. It provides a case study of the oil and gas company that is seeking to expand its operations in new geographies.
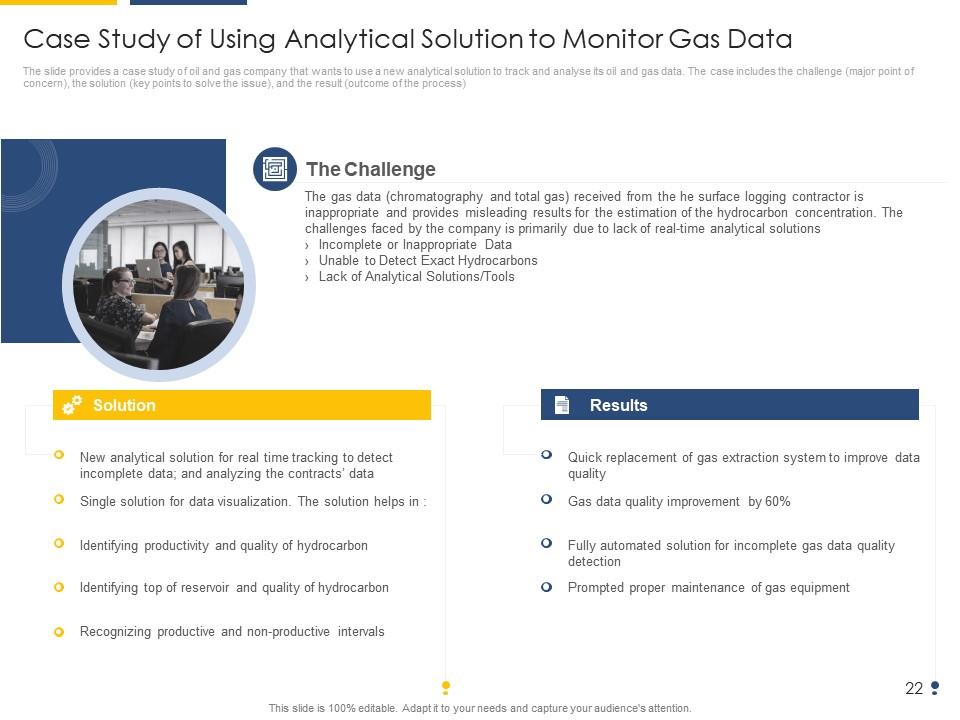
Slide 22: This slide presents the Case Study of Using Analytical solutions to Monitor Gas Data. It provides a case study of the oil and gas company that wants to use a new analytical solution to track and analyze its oil and gas data.
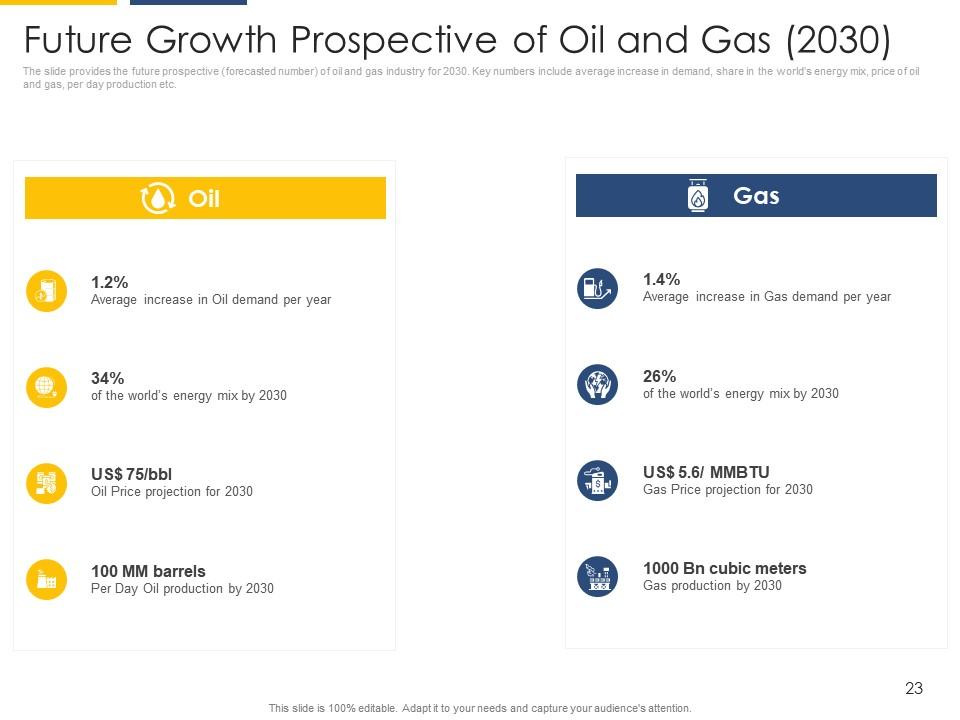
Slide 23: This slide presents the Future Growth Prospective of Oil and Gas (2030). It provides the future prospective (forecasted number) of the oil and gas industry for 2030.
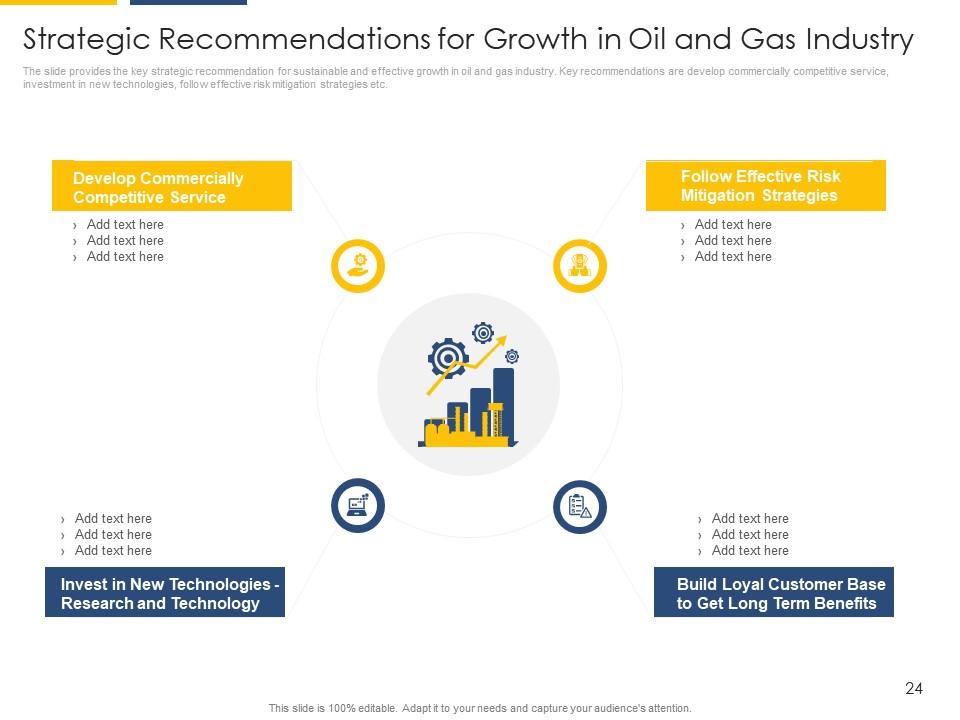
Slide 24: This slide presents the Strategic Recommendations for Growth in the Oil and Gas Industry. It provides the key strategic recommendation for sustainable and effective growth in the oil and gas industry.
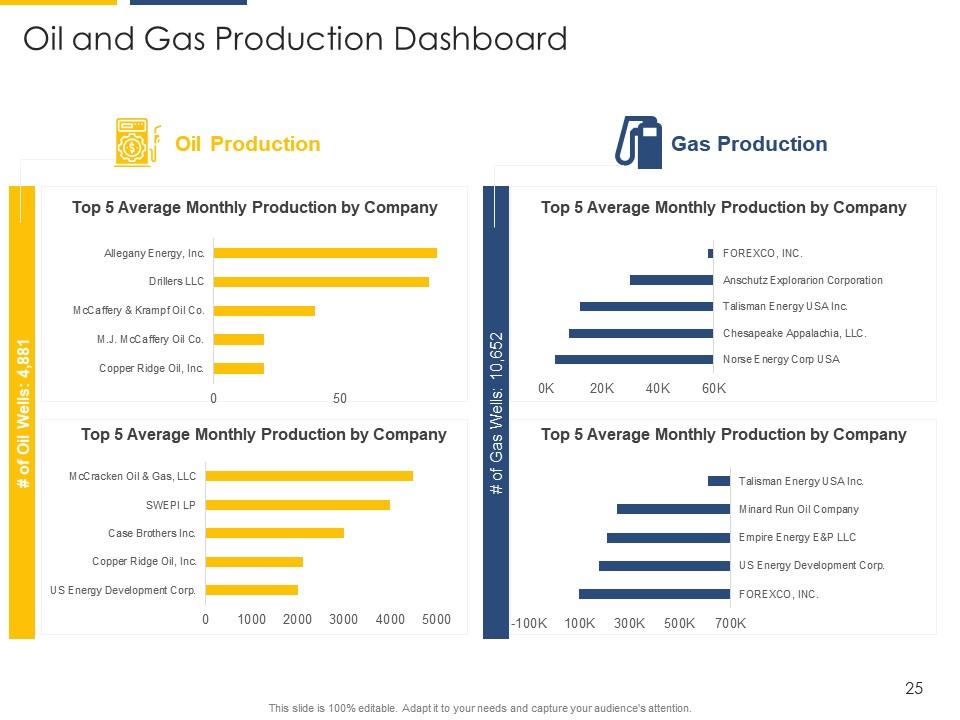
Slide 25: This slide presents the Oil and Gas Production Dashboard. It showcases - Top 5 Average Monthly Production by Company, Top 5 Average Monthly Production by Company, Top 5 Average Monthly Production by Company, etc.
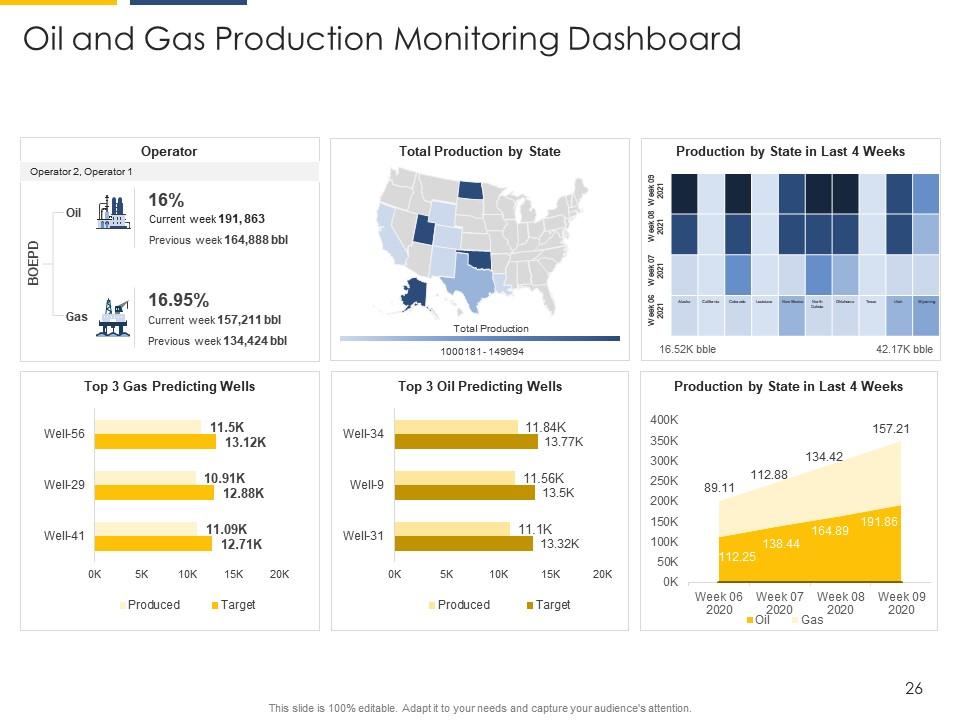
Slide 26: This slide presents the Oil and Gas Production Monitoring Dashboard. It showcases the Production by State in the Last 4 Weeks.
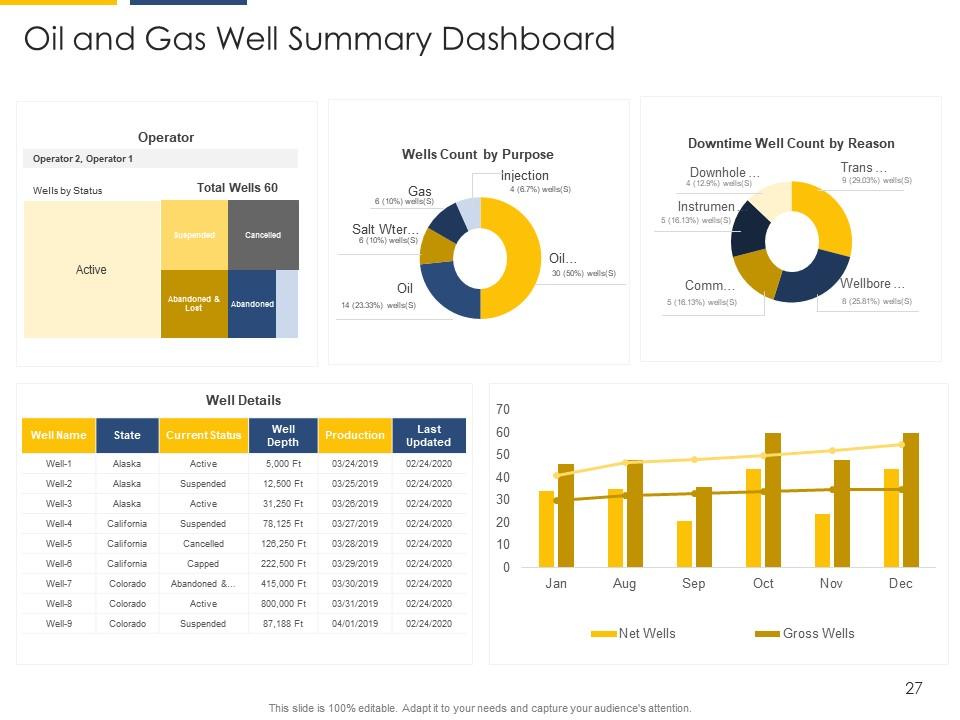
Slide 27: This slide presents the Oil and Gas Well Summary Dashboard.
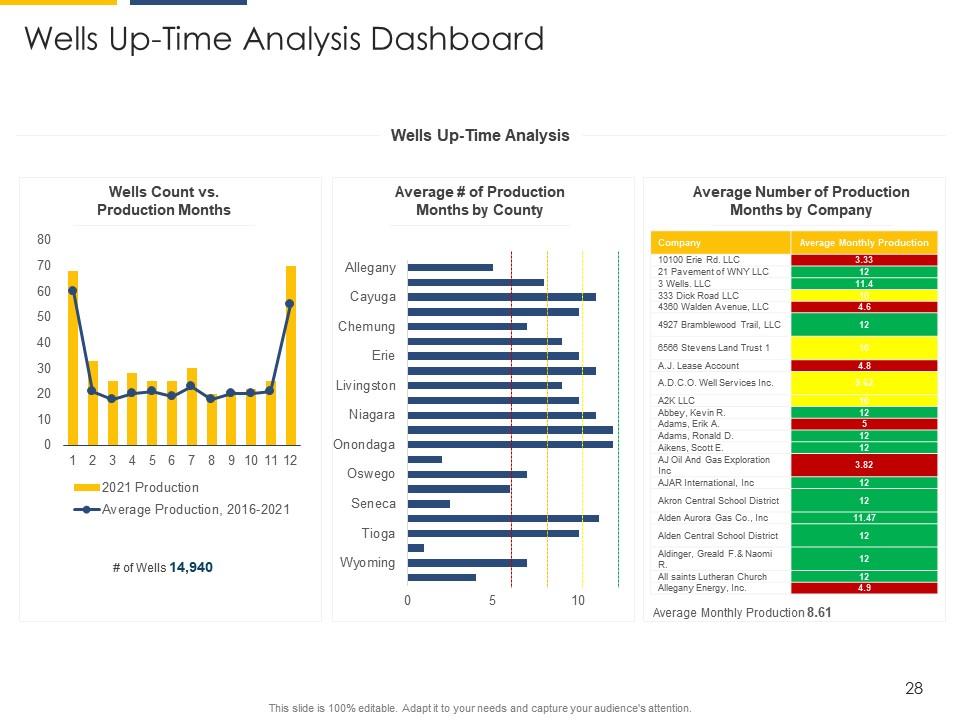
Slide 28: This slide presents the Wells Up-Time Analysis Dashboard. It shows the Average Monthly Production, Average Number of Production Months by County, Average Number of Production Months by Company, etc.
Slide 29: This is the Strategic Overview of the Oil and Gas Industry (Case Competition) Icons Slide.
Slide 30: This slide presents the Additional Slides.
Slide 31: This slide contains the information about the company aka the ‘About Us’ section. This includes Creative, Talented, and Professional.
Slide 32: This slide provides the Mission for the entire company. This includes the vision, the mission, and the goal.
Slide 33: This slide shows the members of the company team with their name, designation, and photo.
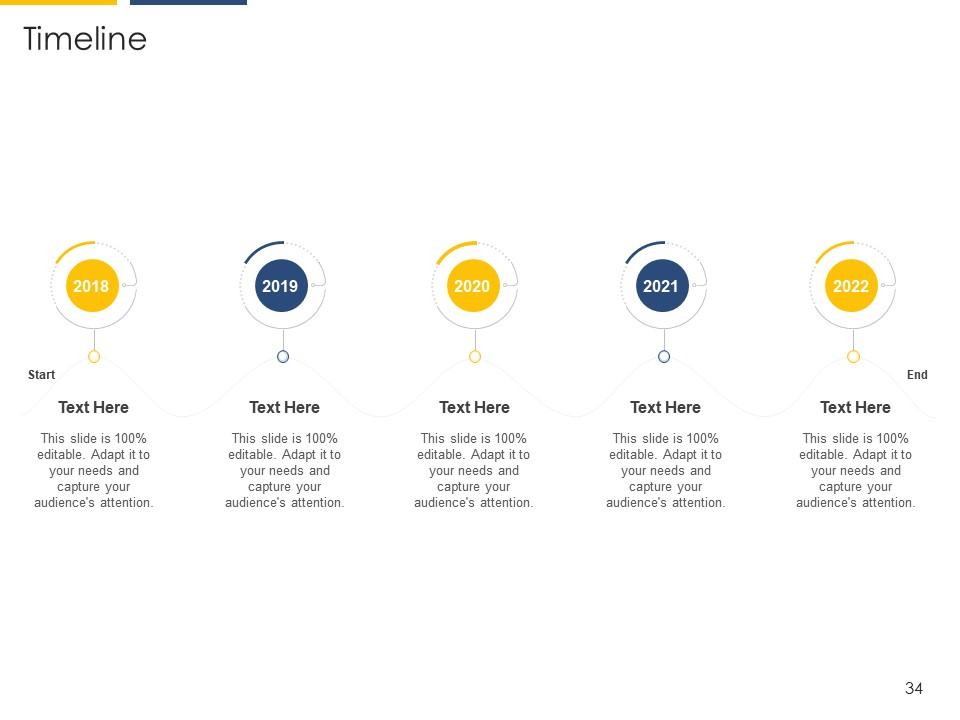
Slide 34: This slide is a Timeline template to showcase the progress of the steps of a project with time.
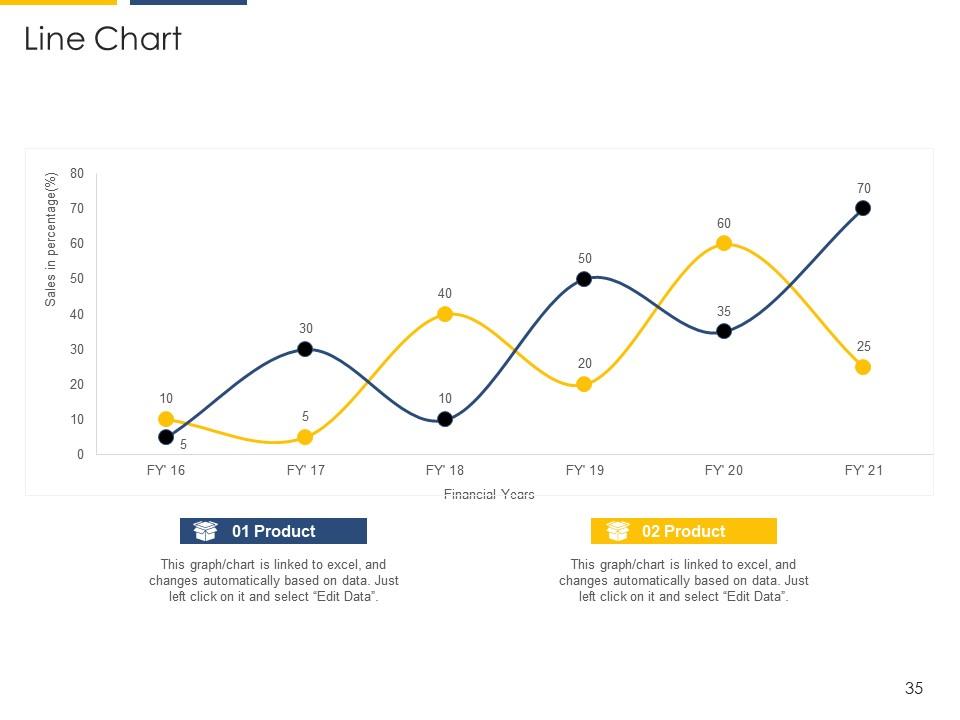
Slide 35: This slide shows a Line Chart that compares 2 products’ sales over a timeline of financial years.
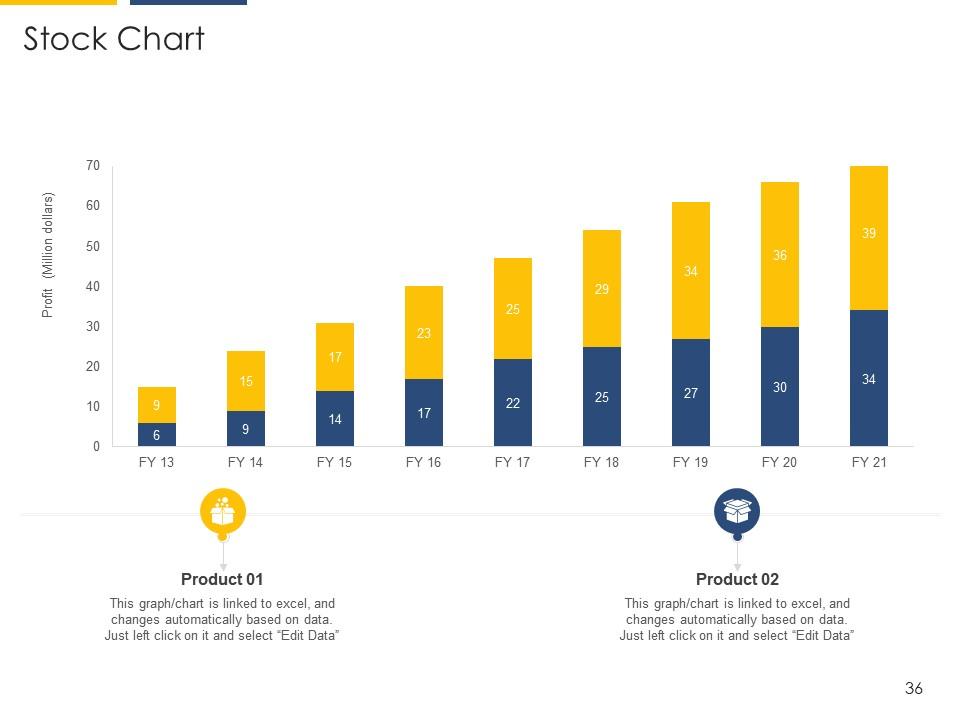
Slide 36: This slide shows a Stock Chart that compares 2 products’ profits over a timeline of financial years.
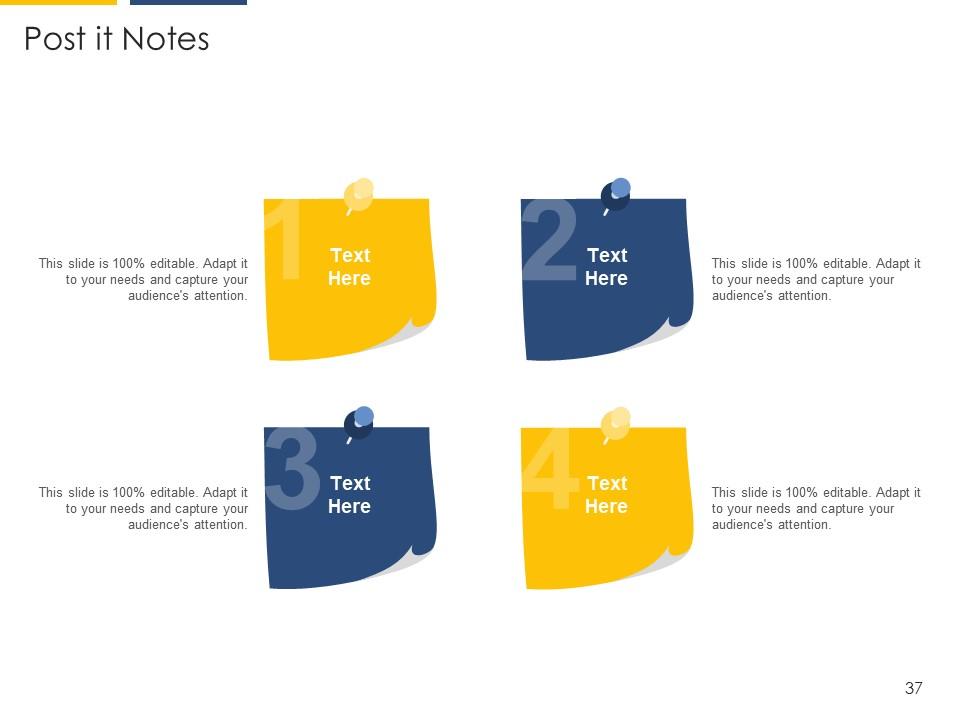
Slide 37: This slide contains Post-It Notes that can be used to express any brief thoughts or ideas.
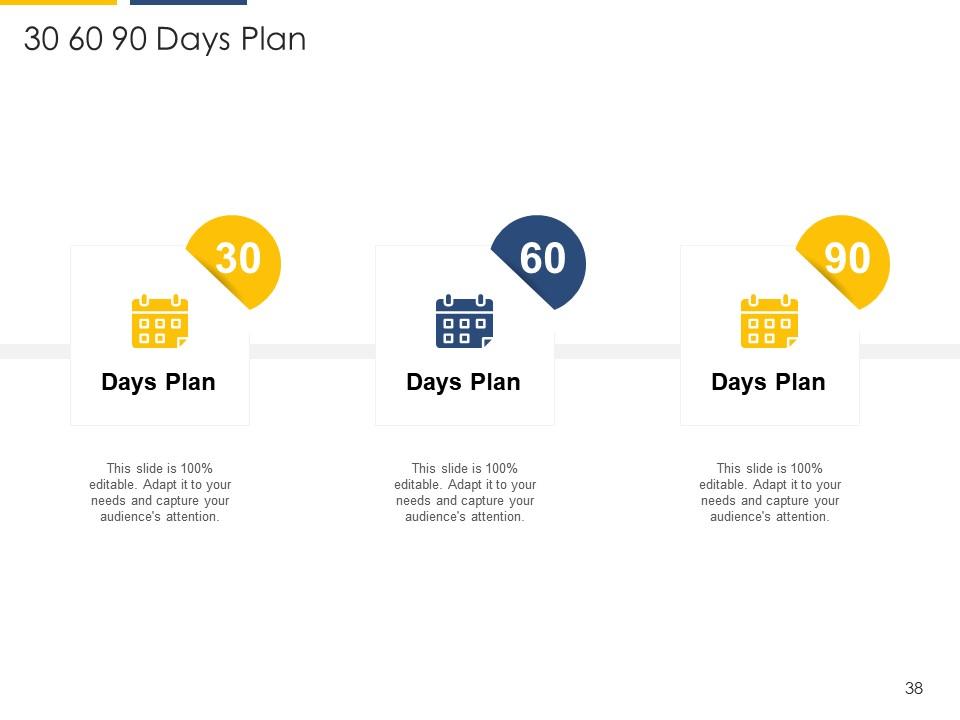
Slide 38: This is a slide with a 30-60-90-Days Plan to set goals for these important intervals.
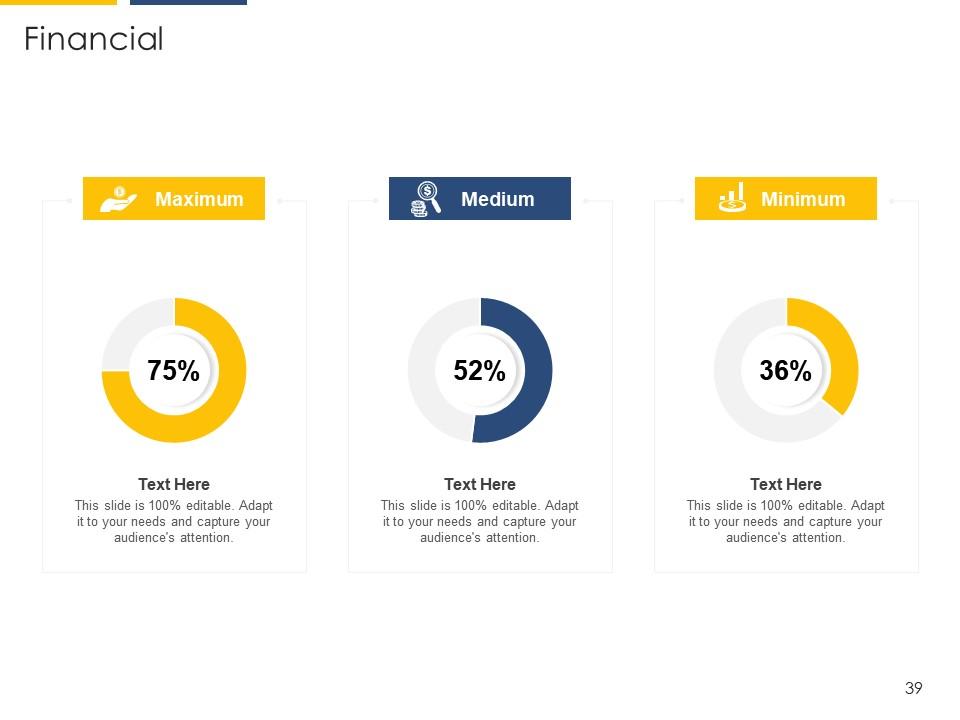
Slide 39: This slide presents the financial data with the data’s numbers at minimum, medium, and maximum percentages.
Slide 40: This is a Thank You slide where details such as the address, contact number, email address are added.
Strategic overview of oil and gas industry case competition powerpoint presentation slides with all 40 slides:
Use our Strategic Overview Of Oil And Gas Industry Case Competition Powerpoint Presentation Slides to effectively help you save your valuable time. They are readymade to fit into any presentation structure.
-
Appreciate the research and its presentable format.
-
Design layout is very impressive.
-
Content of slide is easy to understand and edit.
-
Excellent products for quick understanding.
-
Unique research projects to present in meeting.
-
Easily Editable.


