Customer Investment Profile Powerpoint Presentation Slides
Need to showcase the steps of investment profile? Not sure where to locate the best designs that can make your presentation impressive, we are here to give you best solution. Our 60 slides content-ready Customer Investment Profile Powerpoint Presentation Slides is ideal for you. Our investment ppt presentation file includes various slides such as company investor update, about company, our team, product team, growth team, business canvas model, annual run rate, revenue model, monthly revenue, monthly recurring churn, investment deals, production cost, investor scorecard, competitive analysis, market dynamics, marketing budget and many more. Our investment profile PowerPoint slide show demonstrate all the possible ways in which a company can showcase their investment figures. There is additional slide design like platform build on value chain, operating excellence, financial highlights and reports, dashboards for revenue, marketing and investment timeline etc. So, you can easily present your data in front of the target audience. This deck file will save you time and will also make you a hero among your peers. So, do not wait just download our Customer Investment Profile Powerpoint Presentation Slides and enjoy the benefits that comes with this visual PPT deck design. Eliminate demoralizing factors with our Customer Investment Profile Powerpoint Presentation Slides. Ensure good cheer continues to exist.
- Google Slides is a new FREE Presentation software from Google.
- All our content is 100% compatible with Google Slides.
- Just download our designs, and upload them to Google Slides and they will work automatically.
- Amaze your audience with SlideTeam and Google Slides.
-
Want Changes to This PPT Slide? Check out our Presentation Design Services
- WideScreen Aspect ratio is becoming a very popular format. When you download this product, the downloaded ZIP will contain this product in both standard and widescreen format.
-

- Some older products that we have may only be in standard format, but they can easily be converted to widescreen.
- To do this, please open the SlideTeam product in Powerpoint, and go to
- Design ( On the top bar) -> Page Setup -> and select "On-screen Show (16:9)” in the drop down for "Slides Sized for".
- The slide or theme will change to widescreen, and all graphics will adjust automatically. You can similarly convert our content to any other desired screen aspect ratio.
Compatible With Google Slides

Get This In WideScreen
You must be logged in to download this presentation.
PowerPoint presentation slides
Download our professional Customer Investment Profile Powerpoint Presentation Slides PPT comprising extensively researched content and professional design layouts. Don’t waste hours fiddling with PowerPoint toolbars and finding professional PowerPoint templates. This complete presentation saves hours of your time. Comprising a total of 60 slides, the PowerPoint presentation is a visual masterpiece with professional PPT templates, data-driven graphs, charts and tables, a beautiful theme, impressive slide designs, icons, imagery and more. It is fully editable so that you can make changes to colors, data and fonts if you need to. Just enter your text in the placeholders provided and rock the meeting or conference you are presenting at.
People who downloaded this PowerPoint presentation also viewed the following :
Content of this Powerpoint Presentation
Slide 1: This slide introduces Customer Investment Profile.State your Company Name and begins.
Slide 2: This slide showcases Agenda. You can put your agenda and use as per your requirement.
Slide 3: This slide shows Company Investor Update. With these three factors you can edit/alter- Name, Position, Email Address.
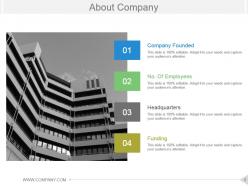
Slide 4: This slide showcases About Company. It also includes four parameters- Company Founded, Funding, No. Of Employees, Headquarters.
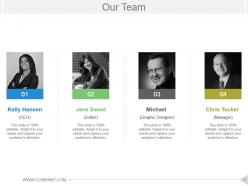
Slide 5: This slide show Our Team. You can showcase your team member and write thier designation
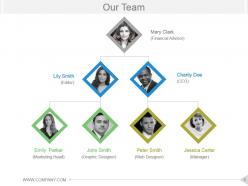
Slide 6: This slide presents our team hierarchy. You can put names with designation.
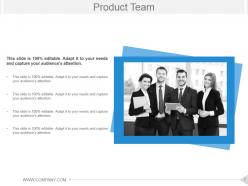
Slide 7: This slide displays Product Team with imagery background.
Slide 8: This slide shows Growth Team with name and designation also you can put your image.
Slide 9: This slide presents Business Model Canvas. We have shortlisted some of them for your reference. KEY ACTIVITIES, KEY PARTNER, KEY RESOURCES, CUSTOMERS, CUSTOMER RELATIONSHIP, VALUE PROVIDED, COSTS, CHANNELS.
Slide 10: This slide showcases Business Model Canvas. You can use it as per your requirement.
Slide 11: This slide displays Annual Run Rate with three financial year. You can add/alter as per your requirement.
Slide 12: This slide showcases Revenue Model. You can add five point parameters as per your need.
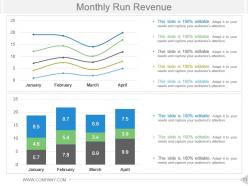
Slide 13: This slide shows Monthly Run Revenue with a bar graph and line chart.
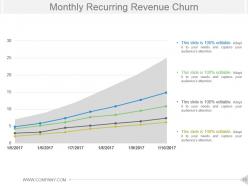
Slide 14: This slide displays Monthly Recurring Revenue Churn with a wave form chart
Slide 15: This slide showcases Monthly Recurring Revenue Churn showing date wise.
Slide 16: This slide displays Investment Deals. You can add your investment deals in table and add your information.
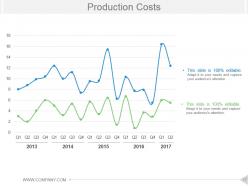
Slide 17: This slide presents Production Costs. You put your information or data into this and use it.
Slide 18: This slide showcases Production Costs. You can use the information as such or edit/alter as per requirement.
Slide 19: This slide displays Investor Scorecard with a talent scorecard. It also includes imagenery and space to add information.
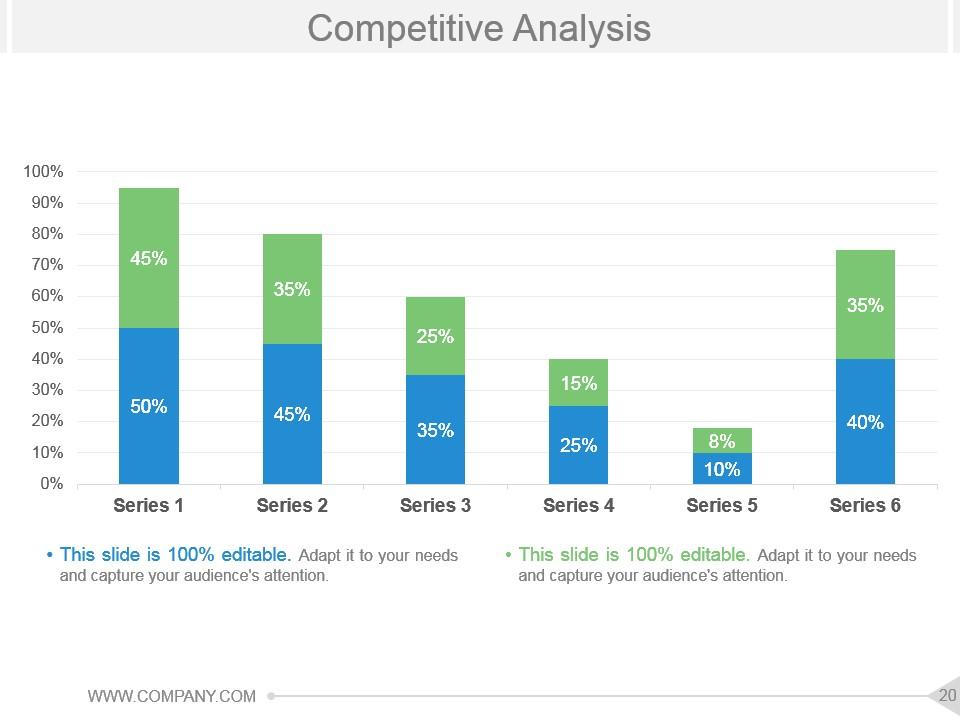
Slide 20: This slide shows Competitive Analysis with bar charts. You can edit/alter make as per your requirement.
Slide 21: This slide presents Market Dynamics four different pie chart form comparison analysis. Market Dynamics, Market Opportunity Description, Economic Outlook, Competitive Landscape.
Slide 22: This slide shows Marketing Budget with different percentage in specific areas- Competition, Target Marketing, Business Opportunities, Products & Services, Marketing Objectives.
Slide 23: This slide showcases Value Chain with primary function. we have listed some of the parameters- Inbound Logistics, Operations, Outbound Logistics, Marketing & Sales, Infrastructure, HR Management, Procurement, Research & Development, SUPPORTING FUNCTION, VALUE ADDED, PRIMARY FUNCTION.
Slide 24: This slide presents Platform Build On Value Chain. With this you can put your data and make the best use of it.
Slide 25: This slide showcases four different categories listed in this as follows- Operating Excellence, Operating Income, Operating Expenses, Capacity Utilization, Cash Flow.
Slide 26: This slide showing Financial Highlights which we have presented in tabular and bar graph form.
Slide 27: This slide showcases Financial Highlights with these important parameters for your reference. Recurring Revenue, Performance, Adjusted EBITDA, Revenue.
Slide 28: This Financial Report with bar chart showing variations for four product or business growth.
Slide 29: This slide is for Financial Strength comparison. It also includes Four different pie chart and bar chart.
Slide 30: This slide showcases Sales Performance Dashboard which is showing these parameters- Opportunities Total Sales By Probability, Lead Sources Revenue Share, Total Sales By Month, Opportunities By Total Sales Amount.
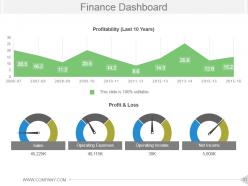
Slide 31: This slide Finance Dashboard. It also includes these parameters Profitability (Last 10 Years), Profit & Loss, Sales, Operating Expenses, Operating Income, Net Income.
Slide 32: This slide presents Revenue Dashboard with these parameters to be calculated for the business growth- Days, REVENUE ($) (Thousands), Deal Drop Off By Stage, Quarter Over Quarter Growth(%). You can add information as per your requirement.
Slide 33: This slide showcases Marketing Dashboard. We have made line graph for comparison , You can refer this as per your requirement.
Slide 34: This slide presents Investment Timeline with several number of years.
Slide 35: Thi slide showcases Customer Traction. This slide also include comparison in graph and a funnel and listed are the some the parameters- Signed Up 800 User, Visited Signup Page, Traffic, Impressions, Funnel.
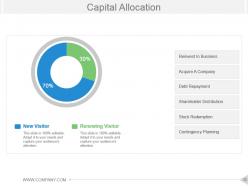
Slide 36: This slide displays Capital Allocation with a pie chart with two different percentage- Reinvest In Business, Acquire A Company, Debt Repayment, Shareholder Distribution, Stock Redemption, Contingency Planning, Renewing Visitor, New Visitor.
Slide 37: This slide shows Capital Spending with bar chart comparing three categories.
Slide 38: This slide presents Project Progress And Reasons For Delay with a pie chart and bar graph. You can fill in the details as per the requirements.
Slide 39: This slide showcases Distribution Growth. With this you can see the business growth.
Slide 40: This slide displays Midstream Organic Growth with three category you can compare.
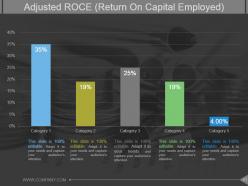
Slide 41: This slide presents Adjusted ROCE with five category. With this you can compare through bar chart.
Slide 42: This slide shows ROCE and the you can notice these two factor through this graph- Cost Of Capital, Adjusted ROCE (Return On Capital Employed).
Slide 43: This slide shows world map Global Demand showing these countries mapped- North America, Latin America, Africa, India, Other Asia pacific, China, Japan, Middle East, Russia/Caspian.
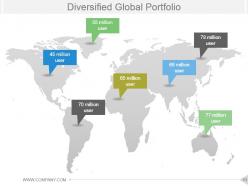
Slide 44: This slide presents Diversified Global Portfolio and showing information about the
Slide 45: This slide is titled Additional Slides.
Slide 46: This slide represents Our Mission. State your mission, goals etc.
Slide 47: This is a Dashboard slide to show- Strategic System, Success, Goal Process, Sales Review, Communication Study.
Slide 48: This is a Location slide to show global growth, presence etc. on world map.
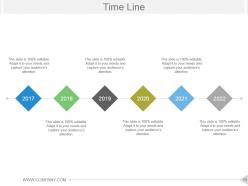
Slide 49: This is a Timelines slide to show- Plan, Budget, Schedule, Review.
Slide 50: This slide shows Target image with text boxes.
Slide 51: This is a Circular image slide to show information etc.
Slide 52: This is a Venn diagram slide to show information etc.
Slide 53: This slide presents a Mind map with text boxes.
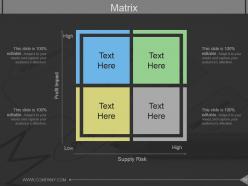
Slide 54: This slide presents a growth matrix with a high to low or low to high.
Slide 55: This slide presents Hierarchy. You can use it for your company hierarchy.
Slide 56: This idea shows an image of Bulb Or Idea to state your facts, notes etc.
Slide 57: This is a Magnifying glass image slide to show information, scoping aspects etc.
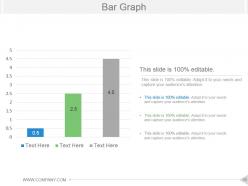
Slide 58: This is a Bar Graph image slide to show product comparison, growth etc.
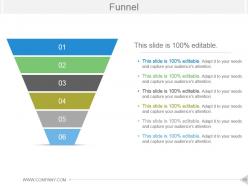
Slide 59: This slide showcases Funnel with six stages.
Slide 60: This is a Thank You slide with Address# street number, city, state, Contact Number, Email Address.
Customer Investment Profile Powerpoint Presentation Slides with all 60 slides:
Our Customer Investment Profile Powerpoint Presentation Slides are an asset for canvassing. Your cause will get the attention it deserves.
-
Awesomely designed templates, Easy to understand.
-
Topic best represented with attractive design.


