Earning projection powerpoint presentation slides
Revenue projection is an essential part of your future business planning, download Earning Projection PowerPoint Presentation Slides to forecast business revenue and sales.. This PowerPoint deck contains set of slides like retail store revenue projections, revenue forecast model, monthly revenue projection, income statement projection, revenue projection per share, earning sales forecast product wise, revenue projections by active users etc. Proper financial forecast helps you to develop operational and staffing plans. Charts and reports given in this financial projections presentation layout allow you to present financial data in an organized way. Use these charts to represent the process for projecting estimates for future sales and revenue. Additionally, revenue forecast PPT layout also goes well with the topics such as financial planning, revenue forecasting, sales revenue forecast and plan, forecasting income statement, revenue management strategy and many more. Download profit planning PPT templates to showcase revenue forecasting methods and techniques. Cover your back with our Earning Projection Powerpoint Presentation Slides. Have full faith that they will get behind you.
You must be logged in to download this presentation.
PowerPoint presentation slides
Presenting this set of slides with name - Earning Projection Powerpoint Presentation Slides. Download our professional PPT comprising extensively researched content and professional design layouts. Do not waste hours fiddling with PowerPoint toolbars and finding professional PowerPoint templates. This complete Earning Projection Powerpoint Presentation Slides saves hours of your time. Comprising a total of nineteen slides, the PowerPoint presentation is a visual masterpiece with professional PPT templates, data driven graphs, charts and tables, a beautiful theme, impressive slide designs, icons, imagery and more. It is fully editable so that you can make changes to colors, data and fonts if you need to. Just enter your text in the placeholders provided and rock the meeting or conference you are presenting at.
People who downloaded this PowerPoint presentation also viewed the following :
Content of this Powerpoint Presentation
Slide 1: This slide introduces Earning Projection. State Your Company Name and begins.
Slide 2: This slide presents Retails Store Revenue Projection.
Slide 3: This slide showcases Revenue Forecast Model table. You can use this for adding revenue.
Slide 4: This slide shows Three Year Revenue Projection. You can add the revenue projection.
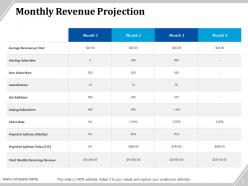
Slide 5: This slide presents Monthly Revenue Projection.
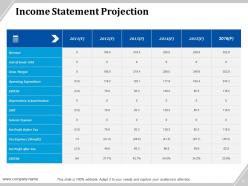
Slide 6: This slide showcases Income Statement Projection.
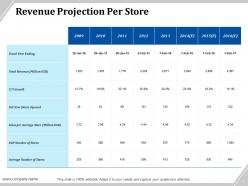
Slide 7: This slide presents Revenue Projection Per Store. Add the revenue for the different years.
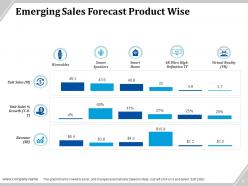
Slide 8: This slide showcases Emerging Sales Forecast Product Wise which further showing the different ways for it.
Slide 9: This slide presents Revenue Projection by Active users.
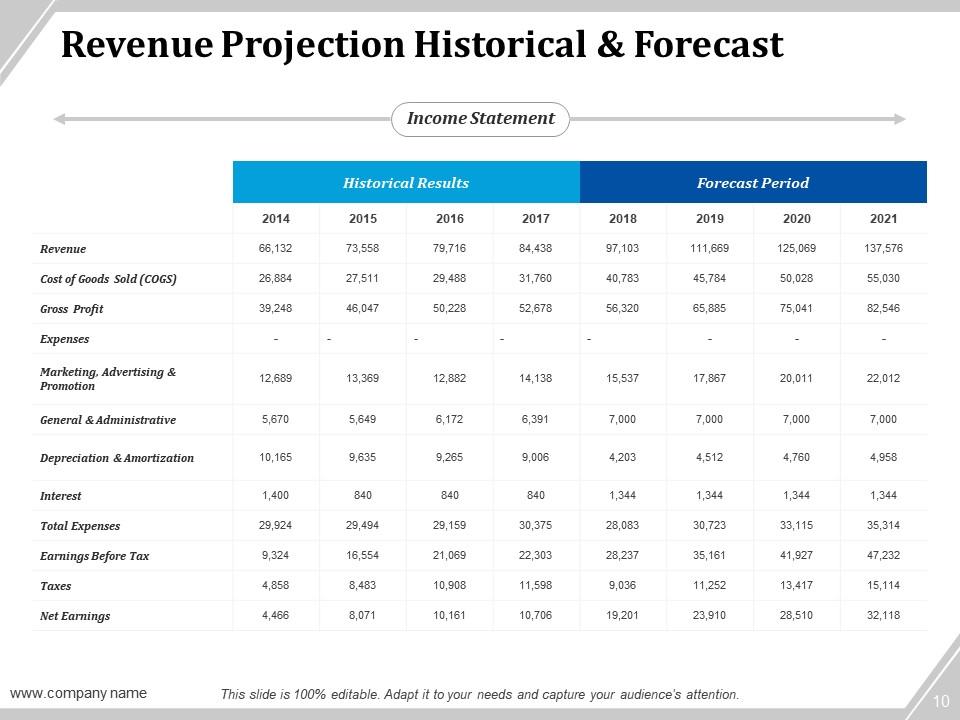
Slide 10: This slide shows Revenue Projection Historical & Forecast. Add the Income Statement and use it accordingly.
Slide 11: This slide is titled Additional Slides to move forward.
Slide 12: This is a Bar Graph image slide to show product comparison, growth etc.
Slide 13: This slide shows a Stacked Line graph in terms of percentage and years for comparison of Product 01, Product 02, Product 03 etc.
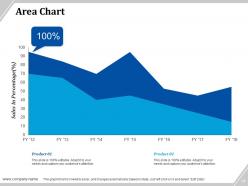
Slide 14: This is an Area Chart slide for product/entity comparison.
Slide 15: This is a Vision, Mission and Goals slide. State them here.
Slide 16: This is an Our Team slide with name, image&text boxes to put the required information.
Slide 17: This is a Target slide. State targets here.
Slide 18: This is a Venn diagram image slide to show information, specifications etc.
Slide 19: This is a Thank You slide for acknowledgement.
Earning projection powerpoint presentation slides with all 19 slides:
Our Earning Projection Powerpoint Presentation Slides are effective across cultures. Exercise control across the globe.
No Reviews


