


Consumer electronics sales decline case competition powerpoint presentation slides


Try Before you Buy Download Free Sample Product
 Impress Your
 Audience
Editable
of Time


Our Consumer Electronics Sales Decline Case Competition Powerpoint Presentation Slides are topically designed to provide an attractive backdrop to any subject. Use them to look like a presentation pro.
Deliver this complete deck to your team members and other collaborators. Encompassed with stylized slides presenting various concepts, this Consumer Electronics Sales Decline Case Competition Powerpoint Presentation Slides is the best tool you can utilize. Personalize its content and graphics to make it unique and thought provoking. All the thirty nine slides are editable and modifiable, so feel free to adjust them to your business setting. The font, color, and other components also come in an editable format making this PPT design the best choice for your next presentation. So, download now.
People who downloaded this PowerPoint presentation also viewed the following :
Content of this Powerpoint Presentation
Slide 1: This slide is titled “Consumer Electronics Sales Decline (Case Competition).” State your company name and get started.
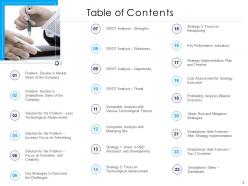
Slide 2: This slide is titled “Table of Contents.” It shows Problem: Decline in Market Share of the Company, Problem: Decline in Smartphone Sales of the Company, Solution for the Problem – Less Technological Advancement, etc.
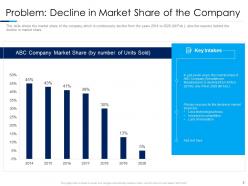
Slide 3: This slide is titled “Problem: Decline in Market Share of the Company.” It shows the market share of the company which is continuously declining from the years 2014 to 2020 (till Feb.), and also the reasons behind the decline in market share.
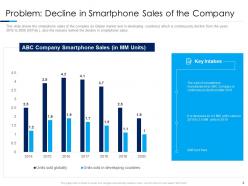
Slide 4: This slide is titled “Problem: Decline in Smartphone Sales of the Company.” It shows the smartphone sales of the company (in the Global market and developing countries) which continuously declined from the years 2016 to 2020 (till Feb.), also the reasons behind the decline in smartphone sales.
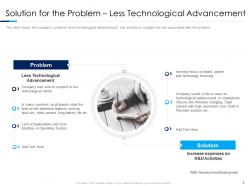
Slide 5: This slide is titled “Solution for the Problem – Less Technological Advancement.” It shows the company’s problem (less technological advancement) and solutions to mitigate the risk associated with the problem.
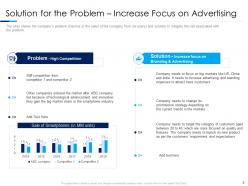
Slide 6: This slide is titled “Solution for the Problem – Increase Focus on Advertising.” It shows the company’s problem (decline in the sales of the company from six years) and solutions to mitigate the risk associated with the problem.
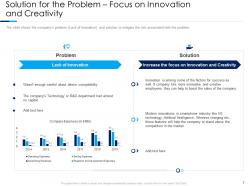
Slide 7: This slide is titled “Solution for the Problem – Focus on Innovation and Creativity.” It shows the company’s problem (lack of Innovation) and solutions to mitigate the risk associated with the problem.
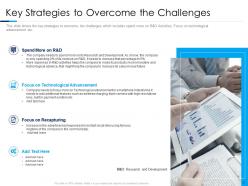
Slide 8: This slide is titled “Key Strategies to Overcome the Challenges.” It shows the key strategies to overcome the challenges which include spending more on R&D Activities, focusing on technological advancement, etc.
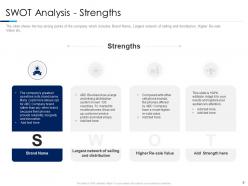
Slide 9: This slide is titled “SWOT Analysis – Strengths.” It shows the key strong points of the company which include Brand Name, the Largest network of selling and distribution, Higher Resale Value, etc.
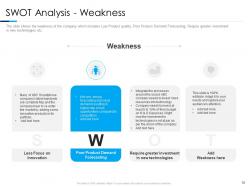
Slide 10: This slide is titled “SWOT Analysis – Weakness.” It shows the weakness of the company which includes Low Product quality, Poor Product Demand Forecasting, Requiring greater investment in new technologies, etc.
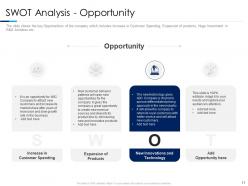
Slide 11: This slide is titled “SWOT Analysis – Opportunity.” It shows the key Opportunities of the company which include an Increase in Customer Spending, Expansion of products, Huge Investment in R&D Activities, etc.
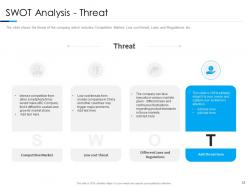
Slide 12: This slide is titled “SWOT Analysis – Threat.” It shows the threat of the company which includes Competitive Market, Low-cost threat, Laws, and Regulations, etc.
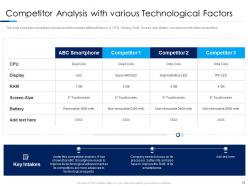
Slide 13: This slide is titled “Competitor Analysis with various Technological Factors.” It shows the competitor’s analysis which includes different factors, i.e CPU, Display, RAM, Screen-size, Battery comparison with other competitors.
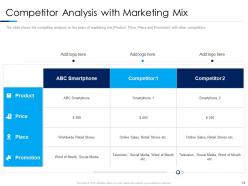
Slide 14: This slide is titled “Competitor Analysis with Marketing Mix.” It shows the competitor analysis based on the marketing mix (Product, Price, Place, and Promotion) with other competitors.
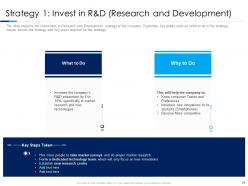
Slide 15: This slide is titled “Strategy 1: Invest in R&D (Research and Development).” It explains the investment in the Research and Development strategy of the company. It provides key points such as what to do in the strategy, the reason behind the strategy, and key steps required for the strategy.
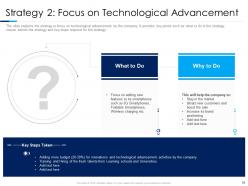
Slide 16: This slide is titled “Strategy 2: Focus on Technological Advancement.” The slide explains the strategy to focus on technological advancement by the company. It provides key points such as what to do in the strategy, the reason behind the strategy, and key steps required for the strategy.
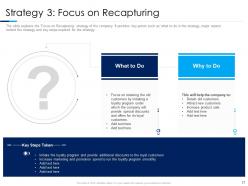
Slide 17: This slide is titled “Strategy 3: Focus on Recapturing.” It explains the ‘Focus on Recapturing’ strategy of the company. It provides key points such as what to do in the strategy, the major reason behind the strategy, and key steps required for the strategy.
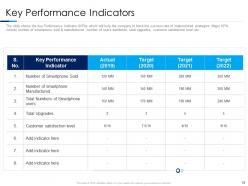
Slide 18: This slide is titled “Key Performance Indicators.” It shows the Key Performance Indicator KPIs which will help the company to track the success rate of implemented strategies., total upgrades, customer satisfaction level, etc.
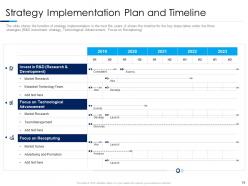
Slide 19: This slide is titled “Strategy Implementation Plan and Timeline.” It shows the timeline of strategy implementation in the next five years. It shows the timeline for the key steps taken under the three strategies (R&D investment strategy, Technological Advancement, Focus on Recapturing).
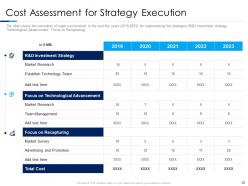
Slide 20: This slide is titled “Cost Assessment for Strategy Execution.” It shows the estimation of major costs involved in the next five years (2019-2023) for implementing the strategies (R&D investment strategy, Technological Advancement, Focus on Recapturing).
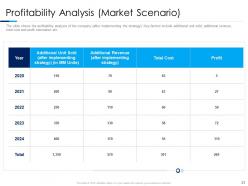
Slide 21: This slide is titled “Profitability Analysis (Market Scenario).” It shows the profitability analysis of the company (after implementing the strategy). Key factors include additional units sold, additional revenue, total cost, and profit estimation, etc.
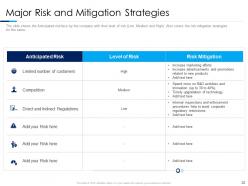
Slide 22: This slide is titled “Major Risk and Mitigation Strategies.” It shows the Anticipated risk faced by the company with their level of risk (Low, Medium, and High). Also covers the risk mitigation strategies for the same.
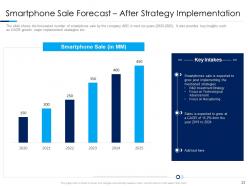
Slide 23: This slide is titled “Smartphone Sale Forecast – After Strategy Implementation.” It shows the forecasted number of smartphone sales by the company ABC in the next six years (2020-2025). It also provides key insights such as CAGR growth, major implemented strategies, etc.
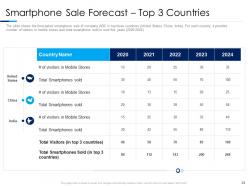
Slide 24: This slide is titled “Smartphone Sale Forecast – Top 3 Countries.” It shows the forecasted smartphone sale of company ABC in the top three countries (United States, China, India). For each country, it provides the number of visitors in mobile stores and total smartphones sold in the next five years (2020-2024)
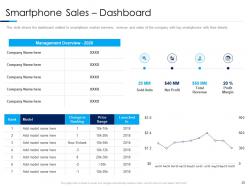
Slide 25: This slide is titled “Smartphone Sales – Dashboard.” It shows the dashboard related to smartphone market overview, revenue, and sales of the company with top smartphones with their details.
Slide 26: This slide is titled “Consumer Electronics Sales Decline - Icons Slide.”
Slide 27: This slide is titled “Additional Slides.”
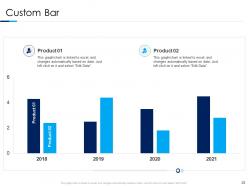
Slide 28: This slide is titled “Custom Bar.” It shows a comparison between two products.
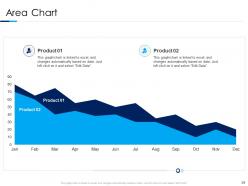
Slide 29: This slide is titled “Area Chart.” Evaluate your product performance for the different fiscal years.
Slide 30: This slide shows the members of the company team with their name, designation, and photo.
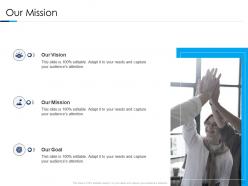
Slide 31: This slide provides the Mission for the entire company. This includes the vision, the mission, and the goal.
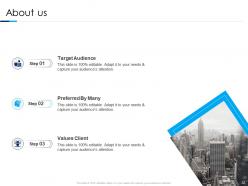
Slide 32: This slide contains the information about the company aka the ‘About Us’ section. This includes the Valued Clients, the Target Audience, and Preferred by Many.
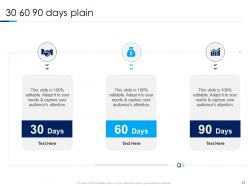
Slide 33: This is a slide with a 30-60-90-Days Plan to set goals for these important intervals.
Slide 34: This slide presents the overall Target of the company as well as smaller targets within that main Target.
Slide 35: This slide presents the financial data with the data’s numbers at minimum, medium, and maximum percentages.
Slide 36: This slide is a Timeline template to showcase the progress of the steps of a project with time.
Slide 37: This slide is a Roadmap template to showcase the stages of a project, for example.
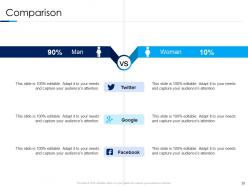
Slide 38: This slide presents a comparison between the percentage of social media users (Google plus, Tumblr, and LinkedIn) between The USA and Canada.
Slide 39: This is a Thank You slide where details such as the address, contact number, and email address are added.
Consumer electronics sales decline case competition powerpoint presentation slides with all 39 slides:
Use our Consumer Electronics Sales Decline Case Competition Powerpoint Presentation Slides to effectively help you save your valuable time. They are readymade to fit into any presentation structure.


Most Relevant Reviews
-
Excellent work done on template design and graphics.
-
Unique and attractive product design.
-
Informative design.