Customer service resolutions and response time dashboard
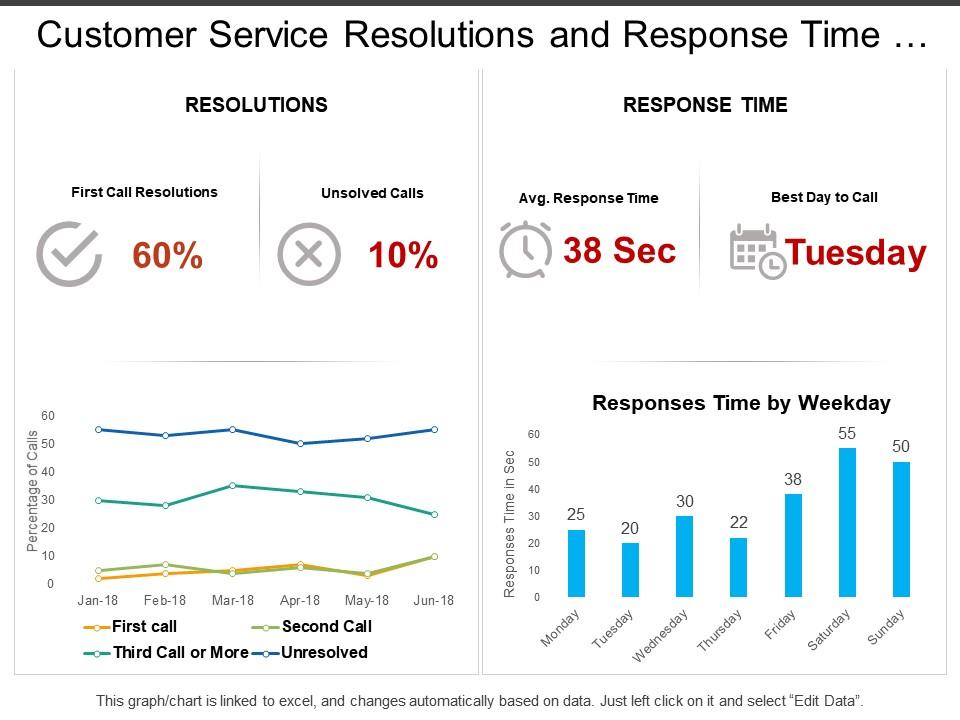
Are you looking for a customer support PowerPoint template that can help you in illustrating the customer problems and solutions? Let us help you! We have come up with a predesigned customer service resolutions and response time dashboard PPT template slide crafted by professional PowerPoint and presentation experts. Graphics of line graph and bar graph has been used to prepare this customer service KPI PowerPoint template that can be utilized to highlight the different resolutions and response time took to provide the solutions. Using this editable customer support problems and solutions template slide in your presentation, you will be easily able to depict that how you have ensured customer satisfaction with a product or service. With the application of this stunning customer relationship management dashboard PPT template, you will be able to throw light on the various aspects such as first call resolution, unsolved calls, Average response time, bets day to call, response time by a week, and percentage of the calls. Use this template for creating a presentation on customer retention, product selling, building a relationship with consumers, and CRM. Download this consumer service resolutions and response dashboard presentation template. Our Customer Service Resolutions And Response Time Dashboard give an elaborate touch. Each segment recieves adequate attention.
Are you looking for a customer support PowerPoint template that can help you in illustrating the customer problems and solu..
- Google Slides is a new FREE Presentation software from Google.
- All our content is 100% compatible with Google Slides.
- Just download our designs, and upload them to Google Slides and they will work automatically.
- Amaze your audience with SlideTeam and Google Slides.
-
Want Changes to This PPT Slide? Check out our Presentation Design Services
- WideScreen Aspect ratio is becoming a very popular format. When you download this product, the downloaded ZIP will contain this product in both standard and widescreen format.
-

- Some older products that we have may only be in standard format, but they can easily be converted to widescreen.
- To do this, please open the SlideTeam product in Powerpoint, and go to
- Design ( On the top bar) -> Page Setup -> and select "On-screen Show (16:9)” in the drop down for "Slides Sized for".
- The slide or theme will change to widescreen, and all graphics will adjust automatically. You can similarly convert our content to any other desired screen aspect ratio.
Compatible With Google Slides

Get This In WideScreen
You must be logged in to download this presentation.
PowerPoint presentation slides
Presenting customer service resolutions and response time dashboard PPT template slide. This template slide is fully adjustable with Google Slide. You can edit the color, text style, font size of the template content as per need. The template is easy to download and can be saved in PDF, and JPEG formats. For guidance, additional instructional slides are available. Superior quality graphics are used. The quality of the slide image does not blur when viewed on a large screen. Dummy content can be replaced with other valuable information. You can personalize the template by adding your company name, and signature.
People who downloaded this PowerPoint presentation also viewed the following :
Content of this Powerpoint Presentation
Description:
The image displays a PowerPoint slide titled "Customer Service Resolutions and Response Time". It is a data-driven dashboard that includes key performance indicators (KPIs) relevant to customer service efficiency and effectiveness.
The text elements on the slide include:
1. "RESOLUTIONS" with two key metrics:
a). First Call Resolutions: 60%, indicating that 60% of calls were resolved on the first contact.
b). Unsolved Calls: 10%, suggesting that 10% of customer calls remain unresolved.
2. "RESPONSE TIME" with two key metrics:
a). Avg. Response Time: 38 Sec, representing the average time taken to respond to a customer query.
b). Best Day to Call: Tuesday, implying that Tuesday is the most efficient day for customers to get in touch for a quick response.
Below these metrics are two graphs:
1. A line chart tracking the percentage of calls over six months for:
a). First Call
b). Second Call
c). Third Call or More
d). Unresolved
2. A bar chart showing "Responses Time by Weekday," with numerical values indicating the average response time in seconds for each day of the week, with the longest times on the weekends.
Use Cases:
This type of dashboard is widely applicable across various service-oriented industries:
1. Telecommunications:
Use: Monitoring customer support call efficiency.
Presenter: Customer Service Manager
Audience: Customer support agents, management
2. Healthcare:
Use: Tracking patient call center performance.
Presenter: Patient Relations Coordinator
Audience: Call center staff, healthcare administrators
3. Banking:
Use: Analyzing response times for customer inquiries.
Presenter: Operations Manager
Audience: Customer service team, bank staff
4. Retail:
Use: Measuring efficiency of customer inquiries handling.
Presenter: Retail Operations Manager
Audience: Customer service representatives, store managers
5. E-Commerce:
Use: Overview of customer support metrics for online shopping.
Presenter: E-Commerce Customer Support Head
Audience: Support team, data analysts
6. IT Services:
Use: Assessing tech support responsiveness and issue resolution.
Presenter: Technical Support Team Leader
Audience: IT support staff, service desk analysts
7. Hospitality:
Use: Evaluating guest service responsiveness in hotels.
Presenter: Guest Services Director
Audience: Hotel management, reception staff
Customer service resolutions and response time dashboard with all 6 slides:
Function freely with our Customer Service Resolutions And Response Time Dashboard. Express yourself as you find convenient.
No Reviews


