Data Statistics PowerPoint Templates, PowerPoint Statistics Slides
- Sub Categories
-
- Agriculture
- Chemicals and Resources
- Construction
- Consumer Goods and FMCG
- E-Commerce
- Energy and Environmental Services
- Finance Insurance and Real Estate
- Health and Pharmaceuticals
- Internet
- Life
- Media and Advertising
- Metals and Electronics
- Retail and Trade
- Services
- Society
- Sports and Recreation
- Survey
- Technology and Telecommunications
- Transportation and Logistics
- Travel Tourism and Hospitality
- USA
-
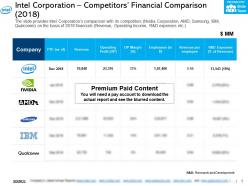 Intel corporation competitors financial comparison 2018
This is a professionally designed visual chart for Intel Corporation Competitors Financial Comparison 2018. This is part of our Data and Statistics products selection, and you will need a Paid account to download the actual report with accurate data and sources. Downloaded report will contain the editable graph with accurate data, an excel table with the actual data, the exact source of the data and the release date. The slide provides Intel Corporations comparison with its competitors Nvidia Corporation AMD Samsung IBM Qualcomm on the basis of 2018 financials Revenue Operating Income R and D expenses etc. Download it immediately and use it for your business.
-
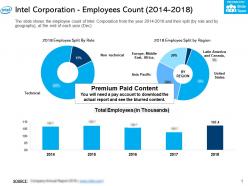 Intel corporation employees count 2014-2018
This is a professionally designed visual chart for Intel Corporation Employees Count 2014 to 2018. This is part of our Data and Statistics products selection, and you will need a Paid account to download the actual report with accurate data and sources. Downloaded report will contain the editable graph with accurate data, an excel table with the actual data, the exact source of the data and the release date. The slide shows the employee count of Intel Corporation from the year 2014 to 2018 and their split by role and by geography at the end of each year Dec. Download it immediately and use it for your business.
-
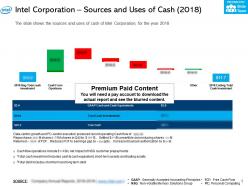 Intel corporation sources and uses of cash 2018
This is a professionally designed visual chart for Intel Corporation Sources And Uses Of Cash 2018. This is part of our Data and Statistics products selection, and you will need a Paid account to download the actual report with accurate data and sources. Downloaded report will contain the editable graph with accurate data, an excel table with the actual data, the exact source of the data and the release date. The slide shows the sources and uses of cash of Intel Corporation for the year 2018. Download it immediately and use it for your business.
-
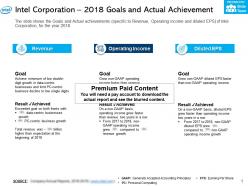 Intel corporation 2018 goals and actual achievement
The information presented in this slide has been researched by our team of professional business analysts. This is part of our Company Profiles products selection, and you will need a Paid account to download the actual report with accurate data and sources. Downloaded report will be in Powerpoint and will contain the actual editable slides with the actual data and sources for each data. The slide shows the Goals and Actual achievements specific to Revenue Operating income and diluted EPS of Intel Corporation for the year 2018. Download it immediately and use it for your business.
-
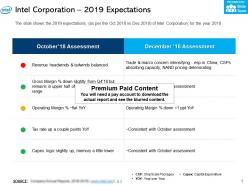 Intel corporation 2019 expectations
The information presented in this slide has been researched by our team of professional business analysts. This is part of our Company Profiles products selection, and you will need a Paid account to download the actual report with accurate data and sources. Downloaded report will be in Powerpoint and will contain the actual editable slides with the actual data and sources for each data. The slide shows the 2019 expectations as per the Oct 2018 vs Dec 2018 of Intel Corporation for the year 2018. Download it immediately and use it for your business.
-
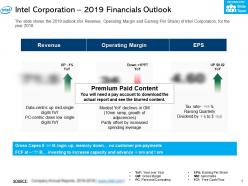 Intel corporation 2019 financials outlook
The information presented in this slide has been researched by our team of professional business analysts. This is part of our Company Profiles products selection, and you will need a Paid account to download the actual report with accurate data and sources. Downloaded report will be in Powerpoint and will contain the actual editable slides with the actual data and sources for each data. The slide shows the 2019 outlook for Revenue Operating Margin and Earning Per Share of Intel Corporation for the year 2018. Download it immediately and use it for your business.
-
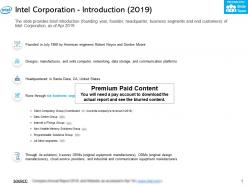 Intel corporation introduction 2019
The information presented in this slide has been researched by our team of professional business analysts. This is part of our Company Profiles products selection, and you will need a Paid account to download the actual report with accurate data and sources. Downloaded report will be in Powerpoint and will contain the actual editable slides with the actual data and sources for each data. The slide provides brief introduction founding year founder headquarter business segments and end customers of Intel Corporation as of Apr 2019. Download it immediately and use it for your business.
-
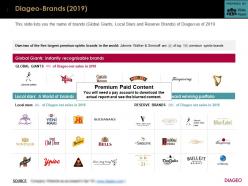 Diageo brands 2019
The information presented in this slide has been researched by our team of professional business analysts. This is part of our Company Profiles products selection, and you will need a Paid account to download the actual report with accurate data and sources. Downloaded report will be in Powerpoint and will contain the actual editable slides with the actual data and sources for each data. This slide lists you the name of brands Global Giants, Local Stars and Reserve Brands of Diageo as of 2019. Download it immediately and use it for your business.
-
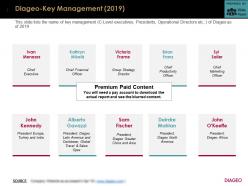 Diageo key management 2019
The information presented in this slide has been researched by our team of professional business analysts. This is part of our Company Profiles products selection, and you will need a Paid account to download the actual report with accurate data and sources. Downloaded report will be in Powerpoint and will contain the actual editable slides with the actual data and sources for each data. This slide lists the name of key management C Level executives, Presidents, Operational Directors etc. of Diageo as of 2019. Download it immediately and use it for your business.
-
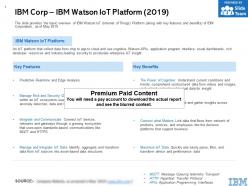 Ibm corp ibm watson iot platform 2019
The information presented in this slide has been researched by our team of professional business analysts. This is part of our Company Profiles products selection, and you will need a Paid account to download the actual report with accurate data and sources. Downloaded report will be in Powerpoint and will contain the actual editable slides with the actual data and sources for each data. The slide provides the basic overview of IBM Watson IoT Internet of Things Platform along with key features and benefits of IBM Corporation, as of May 2019. Download it immediately and use it for your business.
-
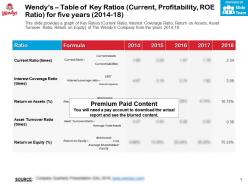 Wendys table of key ratios current profitability roe ratio for five years 2014-18
This is a professionally designed visual chart for Wendys Table Of Key Ratios Current Profitability Roe Ratio For Five Years 2014 to 18. This is part of our Data and Statistics products selection, and you will need a Paid account to download the actual report with accurate data and sources. Downloaded report will contain the editable graph with accurate data, an excel table with the actual data, the exact source of the data and the release date. This slide provides a graph of Key Ratios Current Ratio, Interest Coverage Ratio, Return on Assets, Asset Turnover Ratio, Return on Equity of The Wendys Company from the years 2014 to 18. Download it immediately and use it for your business.
-
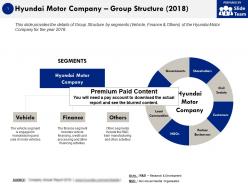 Hyundai motor company group structure 2018
The information presented in this slide has been researched by our team of professional business analysts. This is part of our Company Profiles products selection, and you will need a Paid account to download the actual report with accurate data and sources. Downloaded report will be in Powerpoint and will contain the actual editable slides with the actual data and sources for each data. This slide provides the details of Group Structure by segments Vehicle, Finance and Others of the Hyundai Motor Company for the year 2018. Download it immediately and use it for your business.
-
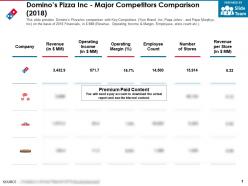 Dominos pizza inc major competitors comparison 2018
This is a professionally designed visual chart for Dominos Pizza Inc Major Competitors Comparison 2018. This is part of our Data and Statistics products selection, and you will need a Paid account to download the actual report with accurate data and sources. Downloaded report will contain the editable graph with accurate data, an excel table with the actual data, the exact source of the data and the release date. This slide provides Dominos Pizza Inc comparison with Key Competitors Yum Brand, Inc Papa Johns and Papa Murphys, Inc on the basis of 2018 Financials in JPY MM Revenue, Operating Income and Margin, Employees, store count etc. Download it immediately and use it for your business.
-
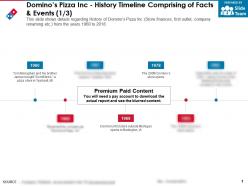 Dominos pizza inc history timeline comprising of facts and events
The information presented in this slide has been researched by our team of professional business analysts. This is part of our Company Profiles products selection, and you will need a Paid account to download the actual report with accurate data and sources. Downloaded report will be in Powerpoint and will contain the actual editable slides with the actual data and sources for each data. This slide shows details regarding History of Dominos Pizza Inc Store finances, first outlet, company renaming etc. from the years 1960 to 2018. Download it immediately and use it for your business.
-
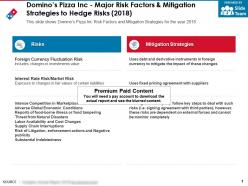 Dominos pizza inc major risk factors and mitigation strategies to hedge risks 2018
The information presented in this slide has been researched by our team of professional business analysts. This is part of our Company Profiles products selection, and you will need a Paid account to download the actual report with accurate data and sources. Downloaded report will be in Powerpoint and will contain the actual editable slides with the actual data and sources for each data. This slide shows Dominos Pizza Inc Risk Factors and Mitigation Strategies for the year 2018. Download it immediately and use it for your business.
-
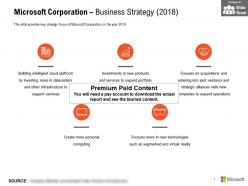 Microsoft corporation business strategy 2018
The information presented in this slide has been researched by our team of professional business analysts. This is part of our Company Profiles products selection, and you will need a Paid account to download the actual report with accurate data and sources. Downloaded report will be in Powerpoint and will contain the actual editable slides with the actual data and sources for each data. This slide provides key strategic focus of Microsoft Corporation in the year 2018. Download it immediately and use it for your business.
-
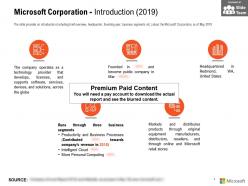 Microsoft corporation introduction 2019
The information presented in this slide has been researched by our team of professional business analysts. This is part of our Company Profiles products selection, and you will need a Paid account to download the actual report with accurate data and sources. Downloaded report will be in Powerpoint and will contain the actual editable slides with the actual data and sources for each data. The slide provides an introduction including brief overview headquarter founding year business segments etc about the Microsoft Corporation as of May 2019. Download it immediately and use it for your business.
-
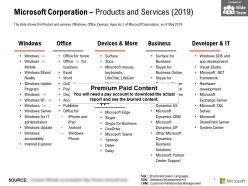 Microsoft corporation products and services 2019
The information presented in this slide has been researched by our team of professional business analysts. This is part of our Company Profiles products selection, and you will need a Paid account to download the actual report with accurate data and sources. Downloaded report will be in Powerpoint and will contain the actual editable slides with the actual data and sources for each data. The slide shows the Product and services Windows Office Devices Apps etc of Microsoft Corporation as of May 2019. Download it immediately and use it for your business.
-
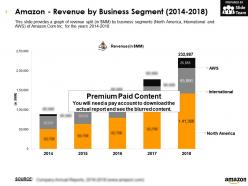 Amazon revenue by business segment 2014-2018
This is a professionally designed visual chart for Amazon Revenue By Business Segment 2014 to 2018. This is part of our Data and Statistics products selection, and you will need a Paid account to download the actual report with accurate data and sources. Downloaded report will contain the editable graph with accurate data, an excel table with the actual data, the exact source of the data and the release date. This slide provides a graph of revenue split in JPY MM by business segments North America, International and AWS of Amazon.Com Inc for the years 2014 to 2018. Download it immediately and use it for your business.
-
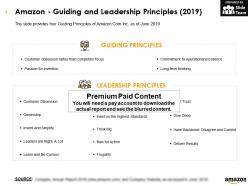 Amazon guiding and leadership principles 2019
The information presented in this slide has been researched by our team of professional business analysts. This is part of our Company Profiles products selection, and you will need a Paid account to download the actual report with accurate data and sources. Downloaded report will be in Powerpoint and will contain the actual editable slides with the actual data and sources for each data. The slide provides four Guiding Principles of Amazon.Com Inc as of June 2019. Download it immediately and use it for your business.
-
 Amazon introduction about operations 2019
The information presented in this slide has been researched by our team of professional business analysts. This is part of our Company Profiles products selection, and you will need a Paid account to download the actual report with accurate data and sources. Downloaded report will be in Powerpoint and will contain the actual editable slides with the actual data and sources for each data. The slide provides brief introduction business overview, founding year, headquarter, business segments, customers etc. of Amazon.Com Inc as of June 2019. Download it immediately and use it for your business.
-
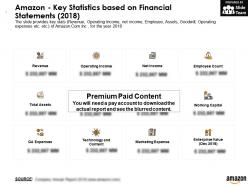 Amazon key statistics based on financial statements 2018
The information presented in this slide has been researched by our team of professional business analysts. This is part of our Company Profiles products selection, and you will need a Paid account to download the actual report with accurate data and sources. Downloaded report will be in Powerpoint and will contain the actual editable slides with the actual data and sources for each data. The slide provides key stats Revenue, Operating Income, net income, Employee, Assets, Goodwill, Operating expenses etc. of Amazon.Com Inc for the year 2018. Download it immediately and use it for your business.
-
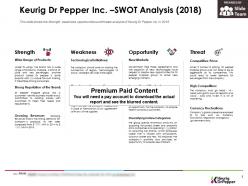 Keurig dr pepper inc swot analysis 2018
The information presented in this slide has been researched by our team of professional business analysts. This is part of our Company Profiles products selection, and you will need a Paid account to download the actual report with accurate data and sources. Downloaded report will be in Powerpoint and will contain the actual editable slides with the actual data and sources for each data. This slide shows the Strength, weakness, opportunities and threats analysis of Keurig Dr Pepper Inc. in 2018. Download it immediately and use it for your business.
-
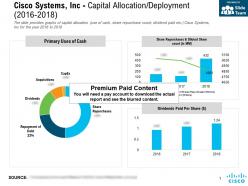 Cisco systems inc capital allocation deployment 2016-2018
This is a professionally designed visual chart for Cisco Systems Inc Capital Allocation Deployment 2016 to 2018. This is part of our Data and Statistics products selection, and you will need a Paid account to download the actual report with accurate data and sources. Downloaded report will contain the editable graph with accurate data, an excel table with the actual data, the exact source of the data and the release date. The slide provides graphs of capital allocation use of cash, share repurchase count, dividend paid etc. Cisco Systems, Inc for the year 2016 to 2018. Download it immediately and use it for your business.
-
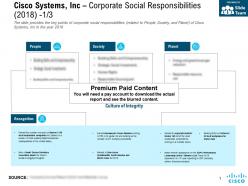 Cisco systems inc corporate social responsibilities 2018
The information presented in this slide has been researched by our team of professional business analysts. This is part of our Company Profiles products selection, and you will need a Paid account to download the actual report with accurate data and sources. Downloaded report will be in Powerpoint and will contain the actual editable slides with the actual data and sources for each data. The slide provides the key points of corporate social responsibilities related to People, Society, and Planet of Cisco Systems, Inc in the year 2018. Download it immediately and use it for your business.
-
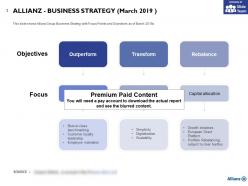 Allianz business strategy march 2019
The information presented in this slide has been researched by our team of professional business analysts. This is part of our Company Profiles products selection, and you will need a Paid account to download the actual report with accurate data and sources. Downloaded report will be in Powerpoint and will contain the actual editable slides with the actual data and sources for each data. This slide shows Allianz Group Business Strategy with Focus Points and Objectives as of March 2019z. Download it immediately and use it for your business.
-
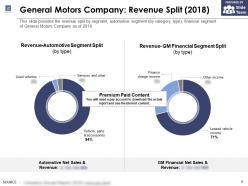 General motors company revenue split 2018
This is a professionally designed visual chart for General Motors Company Revenue Split 2018. This is part of our Data and Statistics products selection, and you will need a Paid account to download the actual report with accurate data and sources. Downloaded report will contain the editable graph with accurate data, an excel table with the actual data, the exact source of the data and the release date. This slide provides the revenue split by segment, automotive segment by category, type, financial segment of General Motors Company as of 2018. Download it immediately and use it for your business.
-
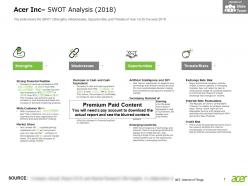 Acer inc swot analysis 2018
The information presented in this slide has been researched by our team of professional business analysts. This is part of our Company Profiles products selection, and you will need a Paid account to download the actual report with accurate data and sources. Downloaded report will be in Powerpoint and will contain the actual editable slides with the actual data and sources for each data. The slide shows the SWOT Strengths, Weaknesses, Opportunities and Threats of Acer Inc for the year 2018. Download it immediately and use it for your business.
-
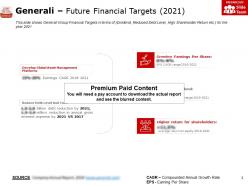 Generali future financial targets 2021
The information presented in this slide has been researched by our team of professional business analysts. This is part of our Company Profiles products selection, and you will need a Paid account to download the actual report with accurate data and sources. Downloaded report will be in Powerpoint and will contain the actual editable slides with the actual data and sources for each data. This slide shows Generali Group Financial Targets in terms of Dividend, Reduced Debt Level, High Shareholder Return etc. for the year 2021. Download it immediately and use it for your business.
-
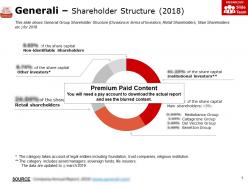 Generali shareholder structure 2018
The information presented in this slide has been researched by our team of professional business analysts. This is part of our Company Profiles products selection, and you will need a Paid account to download the actual report with accurate data and sources. Downloaded report will be in Powerpoint and will contain the actual editable slides with the actual data and sources for each data. This slide shows Generali Group Shareholder Structure Divisions in terms of Investors, Retail Shareholders, Main Shareholders etc. for 2018. Download it immediately and use it for your business.
-
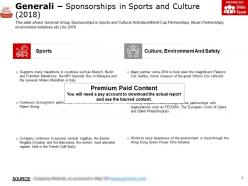 Generali sponsorships in sports and culture 2018
The information presented in this slide has been researched by our team of professional business analysts. This is part of our Company Profiles products selection, and you will need a Paid account to download the actual report with accurate data and sources. Downloaded report will be in Powerpoint and will contain the actual editable slides with the actual data and sources for each data. This slide shows Generali Group Sponsorships in Sports and Cultural Activities World Cup Partnerships, Music Partnerships, environment initiatives etc. for 2018. Download it immediately and use it for your business.
-
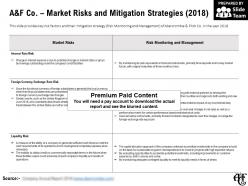 A and f co market risks and mitigation strategies 2018
The information presented in this slide has been researched by our team of professional business analysts. This is part of our Company Profiles products selection, and you will need a Paid account to download the actual report with accurate data and sources. Downloaded report will be in Powerpoint and will contain the actual editable slides with the actual data and sources for each data. This slide provides key risk factors and their mitigation strategy Risk Monitoring and Management of Abercrombie and Fitch Co. in the year 2018. Download it immediately and use it for your business.
-
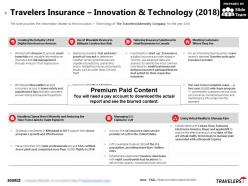 Travelers insurance innovation and technology 2018
The information presented in this slide has been researched by our team of professional business analysts. This is part of our Company Profiles products selection, and you will need a Paid account to download the actual report with accurate data and sources. Downloaded report will be in Powerpoint and will contain the actual editable slides with the actual data and sources for each data. The slide provides the information related to the Innovation Technology of The Travelers Indemnity Company for the year 2018. Download it immediately and use it for your business.
-
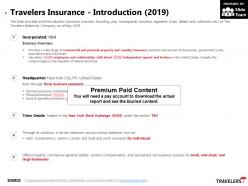 Travelers insurance introduction 2019
The information presented in this slide has been researched by our team of professional business analysts. This is part of our Company Profiles products selection, and you will need a Paid account to download the actual report with accurate data and sources. Downloaded report will be in Powerpoint and will contain the actual editable slides with the actual data and sources for each data. The slide provides brief introduction business overview, founding year, headquarter, business segments, ticker details end customers etc of The Travelers Indemnity Company as of May 2019. Download it immediately and use it for your business.
-
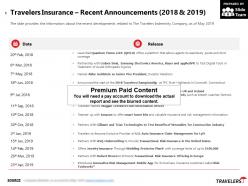 Travelers insurance recent announcements 2018-2019
The information presented in this slide has been researched by our team of professional business analysts. This is part of our Company Profiles products selection, and you will need a Paid account to download the actual report with accurate data and sources. Downloaded report will be in Powerpoint and will contain the actual editable slides with the actual data and sources for each data. The slide provides the information about the recent developments related to The Travelers Indemnity Company as of May 2019. Download it immediately and use it for your business.
-
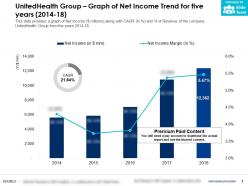 Unitedhealth group graph of net income trend for five years 2014-18
This is a professionally designed visual chart for UnitedHealth Group Graph Of Net Income Trend For Five Years 2014 to 18. This is part of our Data and Statistics products selection, and you will need a Paid account to download the actual report with accurate data and sources. Downloaded report will contain the editable graph with accurate data, an excel table with the actual data, the exact source of the data and the release date. This slide provides a graph of Net Income JPY millions along with CAGR in percent and percent of Revenue of the company UnitedHealth Group from the years 2014 to 18. Download it immediately and use it for your business.
-
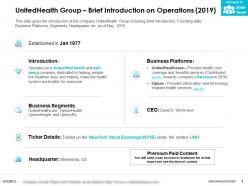 Unitedhealth group brief introduction on operations 2019
The information presented in this slide has been researched by our team of professional business analysts. This is part of our Company Profiles products selection, and you will need a Paid account to download the actual report with accurate data and sources. Downloaded report will be in Powerpoint and will contain the actual editable slides with the actual data and sources for each data. This slide gives the introduction of the company UnitedHealth Group including Brief Introduction, Founding date, Business Platforms, Segments, Headquarter etc. as of May 2019. Download it immediately and use it for your business.
-
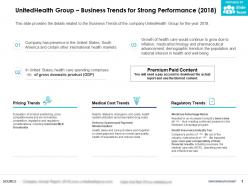 Unitedhealth group business trends for strong performance 2018
The information presented in this slide has been researched by our team of professional business analysts. This is part of our Company Profiles products selection, and you will need a Paid account to download the actual report with accurate data and sources. Downloaded report will be in Powerpoint and will contain the actual editable slides with the actual data and sources for each data. This slide provides the details related to the Business Trends of the company UnitedHealth Group for the year 2018. Download it immediately and use it for your business.
-
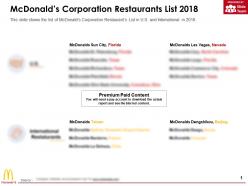 Mcdonalds corporation restaurants list 2018
The information presented in this slide has been researched by our team of professional business analysts. This is part of our Company Profiles products selection, and you will need a Paid account to download the actual report with accurate data and sources. Downloaded report will be in Powerpoint and will contain the actual editable slides with the actual data and sources for each data. This slide shows the list of McDonalds Corporation Restaurants List in U.S and International in 2018. Download it immediately and use it for your business.
-
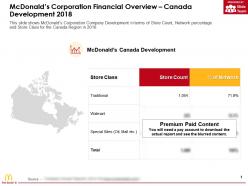 Mcdonalds corporation financial overview canada development 2018
This is a professionally designed visual chart for Mcdonalds Corporation Financial Overview Canada Development 2018. This is part of our Data and Statistics products selection, and you will need a Paid account to download the actual report with accurate data and sources. Downloaded report will contain the editable graph with accurate data, an excel table with the actual data, the exact source of the data and the release date. This slide shows McDonalds Corporation Company Development in terms of Store Count, Network percentage and Store Class for the Canada Region in 2018 . Download it immediately and use it for your business.
-
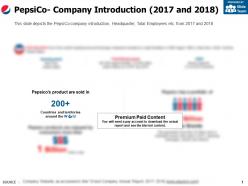 Pepsico company introduction 2017 and 2018
The information presented in this slide has been researched by our team of professional business analysts. This is part of our Company Profiles products selection, and you will need a Paid account to download the actual report with accurate data and sources. Downloaded report will be in Powerpoint and will contain the actual editable slides with the actual data and sources for each data. This slide depicts the PepsiCo company introduction, Headquarter, Total Employees etc. from 2017 to 2018. Download it immediately and use it for your business.
-
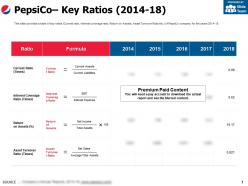 Pepsico key ratios 2014-18
This is a professionally designed visual chart for Pepsico Key Ratios 2014 to 18. This is part of our Data and Statistics products selection, and you will need a Paid account to download the actual report with accurate data and sources. Downloaded report will contain the editable graph with accurate data, an excel table with the actual data, the exact source of the data and the release date. This slide provides a table of key ratios Current ratio, interest coverage ratio, Return on Assets, Asset Turnover Ratio etc. of PepsiCo company for the years 2014 to 18. Download it immediately and use it for your business.
-
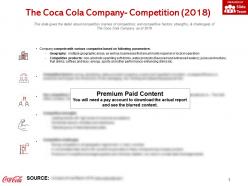 The coca cola company competition 2018
The information presented in this slide has been researched by our team of professional business analysts. This is part of our Company Profiles products selection, and you will need a Paid account to download the actual report with accurate data and sources. Downloaded report will be in Powerpoint and will contain the actual editable slides with the actual data and sources for each data. This slide gives the detail about competition names of competitors and competitive factors, strengths, and challenges of The Coca Cola Company as of 2018. Download it immediately and use it for your business.
-
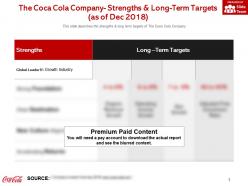 The coca cola company strengths and long term targets as of dec 2018
The information presented in this slide has been researched by our team of professional business analysts. This is part of our Company Profiles products selection, and you will need a Paid account to download the actual report with accurate data and sources. Downloaded report will be in Powerpoint and will contain the actual editable slides with the actual data and sources for each data. This slide describes the strengths and long term targets of The Coca Cola Company. Download it immediately and use it for your business.
-
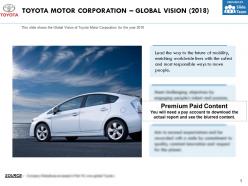 Toyota motor corporation global vision 2018
The information presented in this slide has been researched by our team of professional business analysts. This is part of our Company Profiles products selection, and you will need a Paid account to download the actual report with accurate data and sources. Downloaded report will be in Powerpoint and will contain the actual editable slides with the actual data and sources for each data. This slide shows the Global Vision of Toyota Motor Corporation for the year 2018. Download it immediately and use it for your business.
-
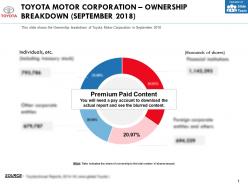 Toyota motor corporation ownership breakdown september 2018
This is a professionally designed visual chart for Toyota Motor Corporation Ownership Breakdown September 2018. This is part of our Data and Statistics products selection, and you will need a Paid account to download the actual report with accurate data and sources. Downloaded report will contain the editable graph with accurate data, an excel table with the actual data, the exact source of the data and the release date. This slide shows the Ownership breakdown of Toyota Motor Corporation in September 2018. Download it immediately and use it for your business.
-
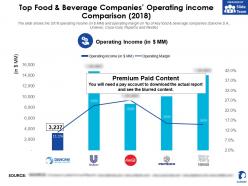 Danone top food and beverage companies operating income comparison 2018
This is a professionally designed visual chart for Danone Top Food And Beverage Companies Operating Income Comparison 2018. This is part of our Data and Statistics products selection, and you will need a Paid account to download the actual report with accurate data and sources. Downloaded report will contain the editable graph with accurate data, an excel table with the actual data, the exact source of the data and the release date. The slide shows the 2018 operating income in JPY MM and operating margin in percent of key food and beverage companies Danone S.A, Unilever, Coca-Cola, PepsiCo and Nestle. Download it immediately and use it for your business.
-
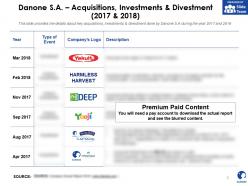 Danone sa acquisitions investments and divestment 2017-2018
The information presented in this slide has been researched by our team of professional business analysts. This is part of our Company Profiles products selection, and you will need a Paid account to download the actual report with accurate data and sources. Downloaded report will be in Powerpoint and will contain the actual editable slides with the actual data and sources for each data. This slide provides the details about key acquisitions, investments and divestment done by Danone S.A during the year 2017 to 2018. Download it immediately and use it for your business.
-
 Danone sa business sector risks 2018
The information presented in this slide has been researched by our team of professional business analysts. This is part of our Company Profiles products selection, and you will need a Paid account to download the actual report with accurate data and sources. Downloaded report will be in Powerpoint and will contain the actual editable slides with the actual data and sources for each data. This slide provides key business sector risks and their mitigation strategy Risk Monitoring and Management of Danone S.A in the year 2018. Download it immediately and use it for your business.
-
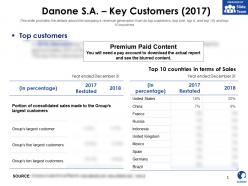 Danone sa key customers 2017
The information presented in this slide has been researched by our team of professional business analysts. This is part of our Company Profiles products selection, and you will need a Paid account to download the actual report with accurate data and sources. Downloaded report will be in Powerpoint and will contain the actual editable slides with the actual data and sources for each data. This slide provides the details about the companys revenue generation from its top customers top one, top 5, and top 10 and top 10 countries. Download it immediately and use it for your business.
-
 Danone sa key milestone towards 2020
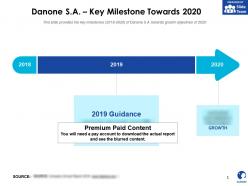
The information presented in this slide has been researched by our team of professional business analysts. This is part of our Company Profiles products selection, and you will need a Paid account to download the actual report with accurate data and sources. Downloaded report will be in Powerpoint and will contain the actual editable slides with the actual data and sources for each data. This slide provides the key milestones 2018 to 2020 of Danone S.A towards growth objectives of 2020. Download it immediately and use it for your business.
-
 Danone sa market share 2018
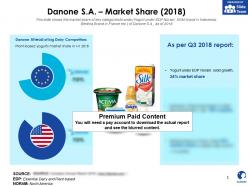
The information presented in this slide has been researched by our team of professional business analysts. This is part of our Company Profiles products selection, and you will need a Paid account to download the actual report with accurate data and sources. Downloaded report will be in Powerpoint and will contain the actual editable slides with the actual data and sources for each data. This slide shows the market share of key categories brands Yogurt under EDP Noram SGM brand in Indonesia Bledina Brand in France etc. of Danone S.A as of 2018. Download it immediately and use it for your business.
-
 Danone sa production in main production sites 2018
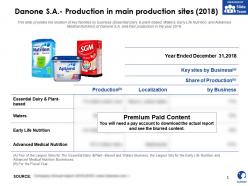
The information presented in this slide has been researched by our team of professional business analysts. This is part of our Company Profiles products selection, and you will need a Paid account to download the actual report with accurate data and sources. Downloaded report will be in Powerpoint and will contain the actual editable slides with the actual data and sources for each data. This slide provides the location of key facilities by business Essential Dairy and plant based, Waters, Early Life Nutrition and Advances Medical Nutrition of Danone S.A and their production in the year 2018. Download it immediately and use it for your business.
-
 Bmw group key automobile markets 2018
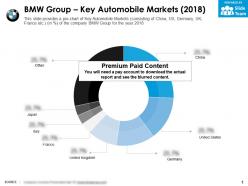
This is a professionally designed visual chart for BMW Group Key Automobile Markets 2018. This is part of our Data and Statistics products selection, and you will need a Paid account to download the actual report with accurate data and sources. Downloaded report will contain the editable graph with accurate data, an excel table with the actual data, the exact source of the data and the release date. This slide provides a pie chart of Key Automobile Markets consisting of China, US, Germany, UK, France etc. in Percentage of the company BMW Group for the year 2018. Download it immediately and use it for your business.
-
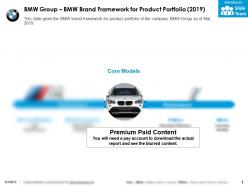 Bmw group bmw brand framework for product portfolio 2019
The information presented in this slide has been researched by our team of professional business analysts. This is part of our Company Profiles products selection, and you will need a Paid account to download the actual report with accurate data and sources. Downloaded report will be in Powerpoint and will contain the actual editable slides with the actual data and sources for each data. This slide gives the BMW brand framework for product portfolio of the company BMW Group as of Mar 2019. Download it immediately and use it for your business.
-
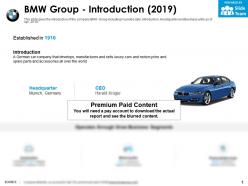 Bmw group introduction 2019
The information presented in this slide has been researched by our team of professional business analysts. This is part of our Company Profiles products selection, and you will need a Paid account to download the actual report with accurate data and sources. Downloaded report will be in Powerpoint and will contain the actual editable slides with the actual data and sources for each data. This slide gives the introduction of the company BMW Group including Founded date, Introduction, Headquarter and Business units as of Apr, 2019. Download it immediately and use it for your business.
-
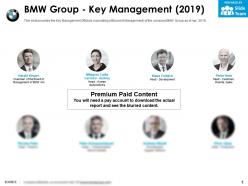 Bmw group key management 2019
The information presented in this slide has been researched by our team of professional business analysts. This is part of our Company Profiles products selection, and you will need a Paid account to download the actual report with accurate data and sources. Downloaded report will be in Powerpoint and will contain the actual editable slides with the actual data and sources for each data. This slide provides the Key Management Officials consisting of Board of Management of the company BMW Group as of Apr, 2019. Download it immediately and use it for your business.
-
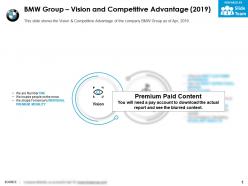 Bmw group vision and competitive advantage 2019
The information presented in this slide has been researched by our team of professional business analysts. This is part of our Company Profiles products selection, and you will need a Paid account to download the actual report with accurate data and sources. Downloaded report will be in Powerpoint and will contain the actual editable slides with the actual data and sources for each data. This slide shows the Vision and Competitive Advantage of the company BMW Group as of Apr, 2019. Download it immediately and use it for your business.
-
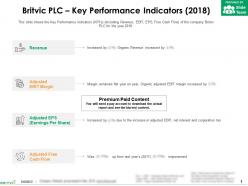 Britvic plc key performance indicators 2018
The information presented in this slide has been researched by our team of professional business analysts. This is part of our Company Profiles products selection, and you will need a Paid account to download the actual report with accurate data and sources. Downloaded report will be in Powerpoint and will contain the actual editable slides with the actual data and sources for each data. This slide shows the Key Performance Indicators KPIs including Revenue, EBIT, EPS, Free Cash Flow of the company Britvic PLC for the year 2018. Download it immediately and use it for your business.
-
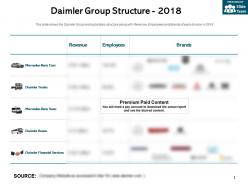 Daimler group structure 2018
The information presented in this slide has been researched by our team of professional business analysts. This is part of our Company Profiles products selection, and you will need a Paid account to download the actual report with accurate data and sources. Downloaded report will be in Powerpoint and will contain the actual editable slides with the actual data and sources for each data. This slide shows the Daimler Group and subsidiary structure along with Revenue, Employees and Brands of each division in 2018. Download it immediately and use it for your business.


