Data Statistics PowerPoint Templates, PowerPoint Statistics Slides
- Sub Categories
-
- Agriculture
- Chemicals and Resources
- Construction
- Consumer Goods and FMCG
- E-Commerce
- Energy and Environmental Services
- Finance Insurance and Real Estate
- Health and Pharmaceuticals
- Internet
- Life
- Media and Advertising
- Metals and Electronics
- Retail and Trade
- Services
- Society
- Sports and Recreation
- Survey
- Technology and Telecommunications
- Transportation and Logistics
- Travel Tourism and Hospitality
- USA
-
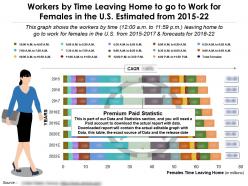 Workers by time leaving home to go to work for females in us estimated 2015-22
Presenting this set of slides with name - Workers By Time Leaving Home To Go To Work For Females In US Estimated 2015-22. Workers By Time Leaving Home To Go To Work For Females In The U.S Estimated From 2015 TO 22. This is part of our Data and Statistics products selection, and you will need a Paid account to download the actual report with accurate data. Downloaded report will contain the actual editable graph with the actual data, an excel table with the actual data, the exact source of the data and the release date. This graph shows the workers by time 12.00 a.m. to 11.59 p.m. leaving home to go to work for females in the U.S from 2015 TO 2017 and Forecasts for 2018 TO 22. It covers topic Workers by time leaving home to go to work for females for region USA and is for date range 2015 TO 22. Download it immediately and use it for your business.
-
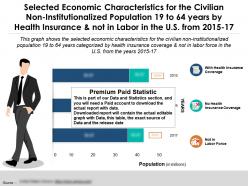 Economic characteristics population 19 to 64 years by health insurance not labor in us 2015-17
Presenting this set of slides with name - Economic Characteristics Population 19 To 64 Years By Health Insurance Not Labor In US 2015-17. Selected Economic Characteristics For The Civilian Noninstitutionalized Population 19 To 64 Years By Health Insurance And Not In Labor In The U.S From 2015 TO 17. This is part of our Data and Statistics products selection, and you will need a Paid account to download the actual report with accurate data. Downloaded report will contain the actual editable graph with the actual data, an excel table with the actual data, the exact source of the data and the release date. This graph shows the selected economic characteristics for the civilian noninstitutionalized population 19 to 64 years categorized by health insurance coverage and not in labor force in the U.S from the years 2015 TO 17. It covers topic Selected economic characteristics for population by health insurance and not in labor force for region USA and is for date range 2015 TO 17. Download it immediately and use it for your business.
-
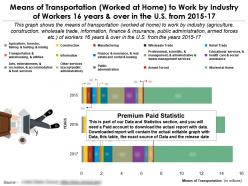 Means of transportation worked at home to work by industry of workers 16 years in us 2015-17
Presenting this set of slides with name - Means Of Transportation Worked At Home To Work By Industry Of Workers 16 Years In US 2015-17. Means Of Transportation Worked At Home To Work By Industry Of Workers 16 Years And Over In The U.S From 2015 to 17. This is part of our Data and Statistics products selection, and you will need a Paid account to download the actual report with accurate data. Downloaded report will contain the actual editable graph with the actual data, an excel table with the actual data, the exact source of the data and the release date. This graph shows the means of transportation worked at home to work by industry agriculture, construction, wholesale trade, information, finance and insurance, public administration, armed forces etc. of workers 16 years and over in the U.S from the years 2015 to 17. It covers topic Means of transportation by working from home for region USA and is for date range 2015 to 17. Download it immediately and use it for your business.
-
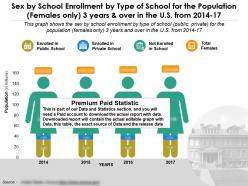 Sex by school enrollment by type of school population females only 3 years in us 2014-17
Presenting this set of slides with name - Sex By School Enrollment By Type Of School Population Females Only 3 Years In US 2014-17. Sex By School Enrollment By Type Of School For The Population Females Only 3 Years And Over In The U.S From 2014 TO 17. This is part of our Data and Statistics products selection, and you will need a Paid account to download the actual report with accurate data. Downloaded report will contain the actual editable graph with the actual data, an excel table with the actual data, the exact source of the data and the release date. This graph shows the sex by school enrollment by type of school public, private for the population females only 3 years and over in the U.S from 2014 TO 17. It covers topic School Enrollment for the population 3 years and over for females for region USA and is for date range 2014 TO 17. Download it immediately and use it for your business.
-
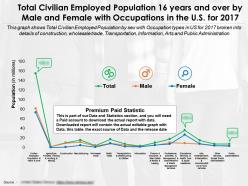 Total civilian employed population 16 years and over by male and female with occupations in us for 2017
Presenting this set of slides with name - Total Civilian Employed Population 16 Years And Over By Male And Female With Occupations In Us For 2017. Total Civilian Employed Population 16 years and over by Male and Female with Occupations in the U.S. for 2017. This is part of our Data and Statistics products selection, and you will need a Paid account to download the actual report with accurate data. Downloaded report will contain the actual editable graph with the actual data, an excel table with the actual data, the exact source of the data and the release date. This graph shows Total Civilian Employed Population by sex with Occupation types in US for 2017 broken into details of construction, wholesale trade, Transportation, Information, Arts and Public Administration. It covers topic Occupation Types for Civilian Employed Population for region USA and is for date range 2017. Download it immediately and use it for your business.
-
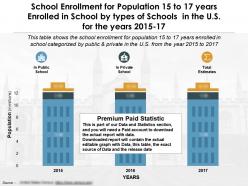 School enrollment for population 15 to 17 years enrolled in school by types of schools in us for years 2015-17
Presenting this set of slides with name - School Enrollment For Population 15 To 17 Years Enrolled In School By Types Of Schools In US For Years 2015-17. School Enrollment For Population 15 To 17 Years Enrolled In School By Types Of Schools In The U.S For The Years 2015 TO 17. This is part of our Data and Statistics products selection, and you will need a Paid account to download the actual report with accurate data. Downloaded report will contain the actual editable graph with the actual data, an excel table with the actual data, the exact source of the data and the release date. This Table Shows The School Enrollment For Population 15 To 17 Years Enrolled In School Categorized By Public And Private In The U.S From The Year 2015 To 2017. It covers topic School Enrollment for 15 to 17 years by school type for region USA and is for date range 2015 TO 17. Download it immediately and use it for your business.
-
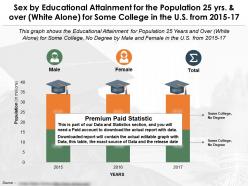 Educational attainment for 25 years and over by sex for some college us 2015-2017
Presenting this set of slides with name - Educational Attainment For 25 Years And Over By Sex For Some College US 2015-2017. Sex By Educational Attainment For The Population 25 Years And Over White Alone For Some College In The U.S From 2015 to 17. This is part of our Data and Statistics products selection, and you will need a Paid account to download the actual report with accurate data. Downloaded report will contain the actual editable graph with the actual data, an excel table with the actual data, the exact source of the data and the release date. This graph shows the Educational Attainment for Population 25 Years and Over White Alone for Some College, No Degree by Male and Female in the U.S from 2015 to 17. It covers topic Educational Attainment levels of Some College No degree for region USA and is for date range 2015 to 17. Download it immediately and use it for your business.
-
 Economic characteristics for population 19 to 64 years by labor type in the us from 2015-17
Presenting this set of slides with name - Economic Characteristics For Population 19 To 64 Years By Labor Type In The US From 2015-17. Selected Economic Characteristics For Civilian Noninstitutionalized Population 19 To 64 Years By Labor Type In The U.S From 2015 To 2017. This is part of our Data and Statistics products selection, and you will need a Paid account to download the actual report with accurate data. Downloaded report will contain the actual editable graph with the actual data, an excel table with the actual data, the exact source of the data and the release date. This Graph Shows The Selected Economic Characteristics For Civilian Noninstitutionalized Population Of 19 To 64 Years By In Labor And Not In Labor In The U.S From The Year 2015 To 2017. It covers topic Selected Economic Characteristics For 19 To 64 Years for region USA and is for date range 2015 To 17. Download it immediately and use it for your business.
-
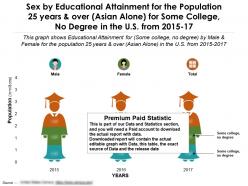 Education fulfilment by sex for 25 years over asian alone for some college no degree us 2015-17
Presenting this set of slides with name - Education Fulfilment By Sex For 25 Years Over Asian Alone For Some College No Degree US 2015-17. Sex By Educational Attainment For The Population 25 Years And Over Asian Alone For Some College No Degree In The U.S From 2015 to 17. This is part of our Data and Statistics products selection, and you will need a Paid account to download the actual report with accurate data. Downloaded report will contain the actual editable graph with the actual data, an excel table with the actual data, the exact source of the data and the release date. This graph shows Educational Attainment for Some college no degree by Male and Female for the population 25 years and over Asian Alone in the U.S from 2015 to 2017. It covers topic Educational Attainment for Some college no degree by sex for region USA and is for date range 2015 to 17. Download it immediately and use it for your business.
-
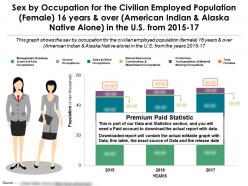 Profession for employed female by sex 16 years over american indian alaska native alone in us 2015-17
Presenting this set of slides with name - Profession For Employed Female By Sex 16 Years Over American Indian Alaska Native Alone In US 2015-17. Sex By Occupation For The Civilian Employed Population Female 16 Years And Over American Indian And Alaska Native Alone In The U.S From 2015 to 17. This is part of our Data and Statistics products selection, and you will need a Paid account to download the actual report with accurate data. Downloaded report will contain the actual editable graph with the actual data, an excel table with the actual data, the exact source of the data and the release date. This graph shows the sex by occupation for the civilian employed population female 16 years and over American Indian and Alaska Native alone in the U.S from the years 2015 to 17. It covers topic Sex by occupation for American Indian and Alaska Native Alone civilian employed females for region USA and is for date range 2015 to 17. Download it immediately and use it for your business.
-
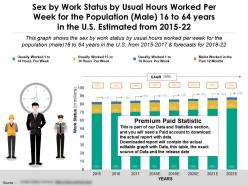 Work status by sex usual hours worked per week male 16 to 64 years in us estimated 2015-22
Presenting this set of slides with name - Work Status By Sex Usual Hours Worked Per Week Male 16 To 64 Years In US Estimated 2015-22. Sex By Work Status By Usual Hours Worked Per Week For The Population Male 16 To 64 Years In The U.S Estimated From 2015 to 22. This is part of our Data and Statistics products selection, and you will need a Paid account to download the actual report with accurate data. Downloaded report will contain the actual editable graph with the actual data, an excel table with the actual data, the exact source of the data and the release date. This Graph Shows The Sex By Work Status By Usual Hours Worked Per Week For The Population Male 16 To 64 Years In The U.S From 2015 to 2017 And Forecasts For 2018 to 22. It covers topic Sex by work status by hours worked per week of males 16 to 64 years for region USA and is for date range 2015 to 22. Download it immediately and use it for your business.
-
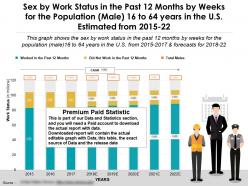 Work status in past 12 months by sex weeks male 16 to 64 years in us estimated 2015-22
Presenting this set of slides with name - Work Status In Past 12 Months By Sex Weeks Male 16 To 64 Years In US Estimated 2015-22. Sex By Work Status In The Past 12 Months By Weeks For The Population Male 16 To 64 Years In The U.S Estimated From 2015 TO 22. This is part of our Data and Statistics products selection, and you will need a Paid account to download the actual report with accurate data. Downloaded report will contain the actual editable graph with the actual data, an excel table with the actual data, the exact source of the data and the release date.This Graph Shows The Sex By Work Status In The Past 12 Months By Weeks For The Population Male 16 To 64 Years In The U.S From 2015 TO 2017 And Forecasts For 2018 TO 22. It covers topic Sex by work status by weeks of males 16 to 64 years for region USA and is for date range 2015 TO 22. Download it immediately and use it for your business.
-
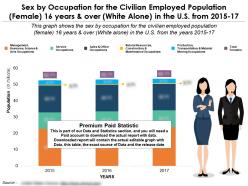 Occupation for civilian female 16 years over white alone in us 2015-17
Presenting this set of slides with name - Occupation For Civilian Female 16 Years Over White Alone In US 2015-17. Sex By Occupation For The Civilian Employed Population Female 16 Years And Over White Alone In The U.S From 2015 TO 17. This is part of our Data and Statistics products selection, and you will need a Paid account to download the actual report with accurate data. Downloaded report will contain the actual editable graph with the actual data, an excel table with the actual data, the exact source of the data and the release date. This Graph Shows The Sex By Occupation For The Civilian Employed Population Female 16 Years And Over White Alone In The U.S From The Years 2015 TO 17. It covers topic Sex by occupation for White Alone civilian employed females for region USA and is for date range 2015 TO 17. Download it immediately and use it for your business.
-
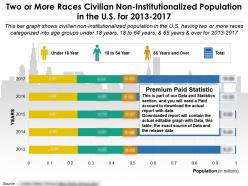 Two or more races civilian non institutionalized population in the us for 2013-2017
Presenting this set of slides with name - Two Or More Races Civilian Non Institutionalized Population In The Us For 2013-2017. Two or more races civilian non institutionalized population in the U.S. for 2013 to 2017. This is part of our Data and Statistics products selection, and you will need a Paid account to download the actual report with accurate data. Downloaded report will contain the actual editable graph with the actual data, an excel table with the actual data, the exact source of the data and the release date. This bar graph shows civilian non institutionalized population in the U.S. having two or more races categorized into age groups under 18 years, 18 to 64 years, and 65 years and over for 2013 to 2017. It covers topic Two or more races population for region USA and is for date range 2013 to 2017. Download it immediately and use it for your business.
-
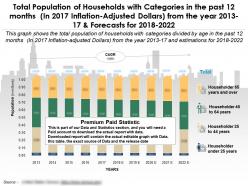 Total population of households categories in past 12 months in 2017 inflation adjusted dollars from year 2013-22
Presenting this set of slides with name - Total Population Of Households Categories In Past 12 Months In 2017 Inflation Adjusted Dollars From Year 2013-22. Total Population Of Households With Categories In The Past 12 Months In 2017 Inflation Adjusted Dollars From The Year 2013 to 17 And Forecasts For 2018 to 2022. This is part of our Data and Statistics products selection, and you will need a Paid account to download the actual report with accurate data. Downloaded report will contain the actual editable graph with the actual data, an excel table with the actual data, the exact source of the data and the release date. This Graph Shows The Total Population Of Households With Categories Divided By Age In The Past 12 Months In 2017 Inflation Adjusted Dollars From The Year 2013 to 17 And Estimations For 2018 to 2022. It covers topic Households Population with Categories by Age for region USA and is for date range 2013 to 2022. Download it immediately and use it for your business.
-
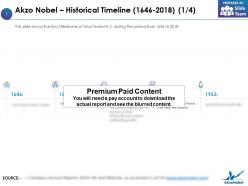 Akzo nobel historical timeline 1646-2018
The information presented in this slide has been researched by our team of professional business analysts. This is part of our Company Profiles products selection, and you will need a Paid account to download the actual report with accurate data and sources. Downloaded report will be in Powerpoint and will contain the actual editable slides with the actual data and sources for each data. This slide shows the Key Milestones of Akzo Nobel N.V. during the period from 1646 to 2018. Download it immediately and use it for your business.
-
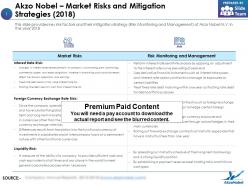 Akzo nobel market risks and mitigation strategies 2018
The information presented in this slide has been researched by our team of professional business analysts. This is part of our Company Profiles products selection, and you will need a Paid account to download the actual report with accurate data and sources. Downloaded report will be in Powerpoint and will contain the actual editable slides with the actual data and sources for each data. This slide provides key risk factors and their mitigation strategy Risk Monitoring and Management of Akzo Nobel N.V. in the year 2018. Download it immediately and use it for your business.
-
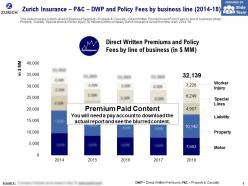 Zurich insurance p and c dwp and policy fees by business line 2014-18
This is a professionally designed visual chart for Zurich Insurance P And C DWP And Policy Fees By Business Line 2014 to 18. This is part of our Data and Statistics products selection, and you will need a Paid account to download the actual report with accurate data and sources. Downloaded report will contain the editable graph with accurate data, an excel table with the actual data, the exact source of the data and the release date. This slide provides a stack chart of Business Segment Property and Casualty Direct Written Premiums and Policy Fees by line of business Motor, Property, Liability, Special lines and Worker injury JPY millions of the company Zurich Insurance Group from the years 2014 to 18. Download it immediately and use it for your business.
-
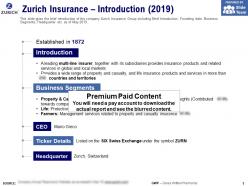 Zurich insurance introduction 2019
The information presented in this slide has been researched by our team of professional business analysts. This is part of our Company Profiles products selection, and you will need a Paid account to download the actual report with accurate data and sources. Downloaded report will be in Powerpoint and will contain the actual editable slides with the actual data and sources for each data. This slide gives the brief introduction of the company Zurich Insurance Group including Brief Introduction, Founding date, Business Segments, Headquarter etc. as of May 2019. Download it immediately and use it for your business.
-
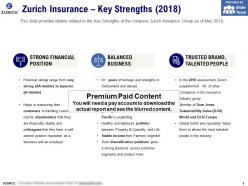 Zurich insurance key strengths 2018
The information presented in this slide has been researched by our team of professional business analysts. This is part of our Company Profiles products selection, and you will need a Paid account to download the actual report with accurate data and sources. Downloaded report will be in Powerpoint and will contain the actual editable slides with the actual data and sources for each data. This slide provides details related to the Key Strengths of the company Zurich Insurance Group as of May 2019. Download it immediately and use it for your business.
-
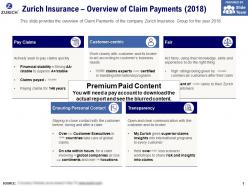 Zurich insurance overview of claim payments 2018
The information presented in this slide has been researched by our team of professional business analysts. This is part of our Company Profiles products selection, and you will need a Paid account to download the actual report with accurate data and sources. Downloaded report will be in Powerpoint and will contain the actual editable slides with the actual data and sources for each data. This slide provides the overview of Claim Payments of the company Zurich Insurance Group for the year 2018. Download it immediately and use it for your business.
-
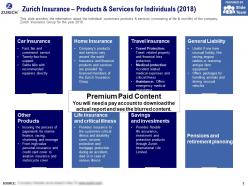 Zurich insurance products and services for individuals 2018
The information presented in this slide has been researched by our team of professional business analysts. This is part of our Company Profiles products selection, and you will need a Paid account to download the actual report with accurate data and sources. Downloaded report will be in Powerpoint and will contain the actual editable slides with the actual data and sources for each data. This slide provides the information about the Individual customers products and services consisting of life and non life of the company Zurich Insurance Group for the year 2018. Download it immediately and use it for your business.
-
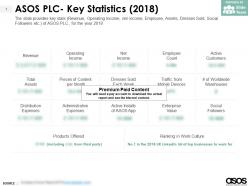 Asos plc key statistics 2018
The information presented in this slide has been researched by our team of professional business analysts. This is part of our Company Profiles products selection, and you will need a Paid account to download the actual report with accurate data and sources. Downloaded report will be in Powerpoint and will contain the actual editable slides with the actual data and sources for each data. The slide provides key stats Revenue, Operating Income, net income, Employee, Assets, Dresses Sold, Social Followers etc. of ASOS PLC for the year 2018. Download it immediately and use it for your business.
-
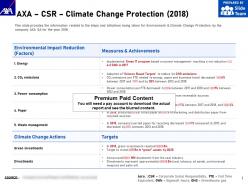 Axa csr climate change protection 2018
The information presented in this slide has been researched by our team of professional business analysts. This is part of our Company Profiles products selection, and you will need a Paid account to download the actual report with accurate data and sources. Downloaded report will be in Powerpoint and will contain the actual editable slides with the actual data and sources for each data. This slide provides the information related to the steps and initiatives being taken for Environment and Climate Change Protection by the company AXA SA for the year 2018. Download it immediately and use it for your business.
-
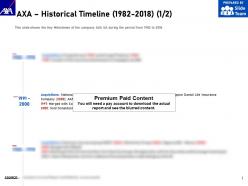 Axa historical timeline 1982-2018
The information presented in this slide has been researched by our team of professional business analysts. This is part of our Company Profiles products selection, and you will need a Paid account to download the actual report with accurate data and sources. Downloaded report will be in Powerpoint and will contain the actual editable slides with the actual data and sources for each data. This slide shows the Key Milestones of the company AXA SA during the period from 1982 to 2018. Download it immediately and use it for your business.
-
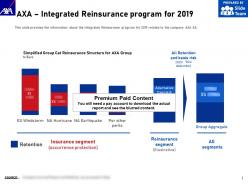 Axa integrated reinsurance program for 2019
The information presented in this slide has been researched by our team of professional business analysts. This is part of our Company Profiles products selection, and you will need a Paid account to download the actual report with accurate data and sources. Downloaded report will be in Powerpoint and will contain the actual editable slides with the actual data and sources for each data. This slide provides the information about the Integrated Reinsurance program for 2019 related to the company AXA SA. Download it immediately and use it for your business.
-
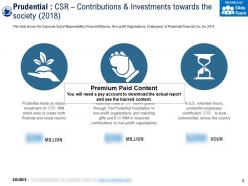 Prudential csr contributions and investments towards the society 2018
The information presented in this slide has been researched by our team of professional business analysts. This is part of our Company Profiles products selection, and you will need a Paid account to download the actual report with accurate data and sources. Downloaded report will be in Powerpoint and will contain the actual editable slides with the actual data and sources for each data. This slide shows the Corporate Social Responsibility Financial Returns, Non profit Organizations, Employees of Prudential Financial Inc. for 2018. Download it immediately and use it for your business.
-
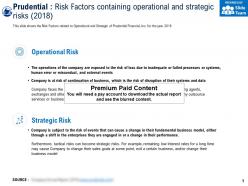 Prudential risk factors containing operational and strategic risks 2018
The information presented in this slide has been researched by our team of professional business analysts. This is part of our Company Profiles products selection, and you will need a Paid account to download the actual report with accurate data and sources. Downloaded report will be in Powerpoint and will contain the actual editable slides with the actual data and sources for each data. This slide shows the Risk Factors related to Operational and Strategic of Prudential Financial Inc. for the year 2018. Download it immediately and use it for your business.
-
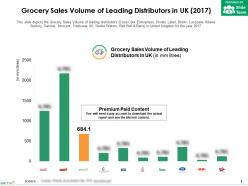 Grocery sales volume of leading distributors in uk 2017
This is a professionally designed visual chart for Grocery Sales Volume Of Leading Distributors In UK 2017. This is part of our Data and Statistics products selection, and you will need a Paid account to download the actual report with accurate data and sources. Downloaded report will contain the editable graph with accurate data, an excel table with the actual data, the exact source of the data and the release date. This slide depicts the Grocery Sales Volume of leading distributors Coca Cola Enterprises, Private Label, Britvic, Lucozade Ribena Suntory, Danone, Innocent, Tropicana UK, Nestle Waters, Red Bull and Barrs in United Kingdom for the year 2017. Download it immediately and use it for your business.
-
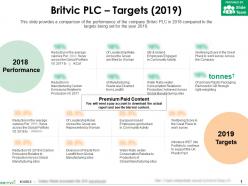 Britvic plc targets 2019
The information presented in this slide has been researched by our team of professional business analysts. This is part of our Company Profiles products selection, and you will need a Paid account to download the actual report with accurate data and sources. Downloaded report will be in Powerpoint and will contain the actual editable slides with the actual data and sources for each data. This slide provides a comparison of the performance of the company Britvic PLC in 2018 compared to the targets being set for the year 2019. Download it immediately and use it for your business.
-
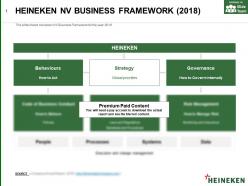 Heineken nv business framework 2018
The information presented in this slide has been researched by our team of professional business analysts. This is part of our Company Profiles products selection, and you will need a Paid account to download the actual report with accurate data and sources. Downloaded report will be in Powerpoint and will contain the actual editable slides with the actual data and sources for each data. This slide shows Heineken NV Business Framework for the year 2018. Download it immediately and use it for your business.
-
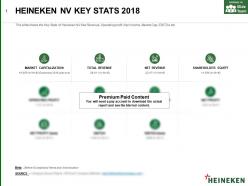 Heineken nv key stats 2018
The information presented in this slide has been researched by our team of professional business analysts. This is part of our Company Profiles products selection, and you will need a Paid account to download the actual report with accurate data and sources. Downloaded report will be in Powerpoint and will contain the actual editable slides with the actual data and sources for each data. This slide shows the Key Stats of Heineken NV like Revenue, Operating profit, Net Income, Market Cap, EBITDA etc. Download it immediately and use it for your business.
-
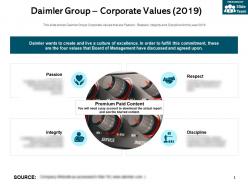 Daimler group corporate values 2019
The information presented in this slide has been researched by our team of professional business analysts. This is part of our Company Profiles products selection, and you will need a Paid account to download the actual report with accurate data and sources. Downloaded report will be in Powerpoint and will contain the actual editable slides with the actual data and sources for each data. This slide shows Daimler Group Corporate Values that are Passion, Respect, Integrity and Discipline for the year 2019. Download it immediately and use it for your business.
-
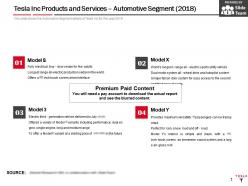 Tesla inc products and services automotive segment 2018
The information presented in this slide has been researched by our team of professional business analysts. This is part of our Company Profiles products selection, and you will need a Paid account to download the actual report with accurate data and sources. Downloaded report will be in Powerpoint and will contain the actual editable slides with the actual data and sources for each data. This slide shows the Automotive Segment details of Tesla Inc for the year 2018. Download it immediately and use it for your business.
-
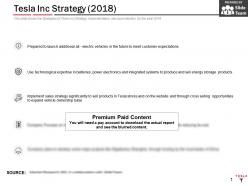 Tesla inc strategy 2018
The information presented in this slide has been researched by our team of professional business analysts. This is part of our Company Profiles products selection, and you will need a Paid account to download the actual report with accurate data and sources. Downloaded report will be in Powerpoint and will contain the actual editable slides with the actual data and sources for each data. This slide shows the Strategies of Tesla Inc Strategy Implementation, new launches etc. for the year 2018. Download it immediately and use it for your business.
-
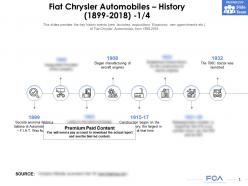 Fiat chrysler automobiles history 1899-2018
The information presented in this slide has been researched by our team of professional business analysts. This is part of our Company Profiles products selection, and you will need a Paid account to download the actual report with accurate data and sources. Downloaded report will be in Powerpoint and will contain the actual editable slides with the actual data and sources for each data. This slides provides the key history events new launches acquisitions. Expansion new appointments etc.of Fiat Chrysler Automobiles from 1899 to 2018. Download it immediately and use it for your business.
-
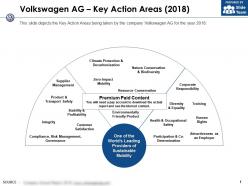 Volkswagen ag key action areas 2018
The information presented in this slide has been researched by our team of professional business analysts. This is part of our Company Profiles products selection, and you will need a Paid account to download the actual report with accurate data and sources. Downloaded report will be in Powerpoint and will contain the actual editable slides with the actual data and sources for each data. This slide depicts the Key Action Areas being taken by the company Volkswagen AG for the year 2018. Download it immediately and use it for your business.
-
 Volkswagen ag key brands 2019
The information presented in this slide has been researched by our team of professional business analysts. This is part of our Company Profiles products selection, and you will need a Paid account to download the actual report with accurate data and sources. Downloaded report will be in Powerpoint and will contain the actual editable slides with the actual data and sources for each data. This slide provides all the 12 Key Brands Volkswagen Passenger and Commercial Vehicles, AUDI, SEAT, Bentley, Bugatti, Lamborghini, Ducati, Scania, Skoda, Porsche and MAN of the company Volkswagen AG as of Mar 2019. Download it immediately and use it for your business.
-
 Volkswagen ag r and d activities 2014-18
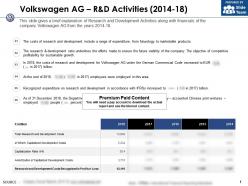
The information presented in this slide has been researched by our team of professional business analysts. This is part of our Company Profiles products selection, and you will need a Paid account to download the actual report with accurate data and sources. Downloaded report will be in Powerpoint and will contain the actual editable slides with the actual data and sources for each data. This slide gives a brief explanation of Research and Development Activities along with financials of the company Volkswagen AG from the years 2014 to 18. Download it immediately and use it for your business.
-
 Yum brands major competitors comparison by various categories 2018
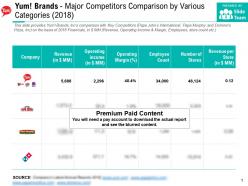
This is a professionally designed visual chart for Yum Brands Major Competitors Comparison By Various Categories 2018. This is part of our Data and Statistics products selection, and you will need a Paid account to download the actual report with accurate data and sources. Downloaded report will contain the editable graph with accurate data, an excel table with the actual data, the exact source of the data and the release date. This slide provides Yum Brands, Incs comparison with Key Competitors Papa Johns International, Papa Murphy and Dominos Pizza, Inc on the basis of 2018 Financials in JPY MM Revenue, Operating Income and Margin, Employees, store count etc. Download it immediately and use it for your business.
-
 Yum brands key statistics from income statement and balance sheet 2018
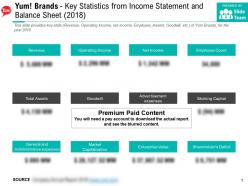
The information presented in this slide has been researched by our team of professional business analysts. This is part of our Company Profiles products selection, and you will need a Paid account to download the actual report with accurate data and sources. Downloaded report will be in Powerpoint and will contain the actual editable slides with the actual data and sources for each data. This slide provides key stats Revenue, Operating Income, net income, Employee, Assets, Goodwill, etc. of Yum Brands for the year 2018. Download it immediately and use it for your business.
-
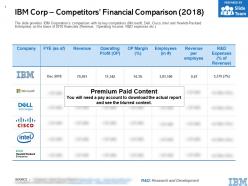 Ibm corp competitors financial comparison 2018
This is a professionally designed visual chart for IBM Corp Competitors Financial Comparison 2018. This is part of our Data and Statistics products selection, and you will need a Paid account to download the actual report with accurate data and sources. Downloaded report will contain the editable graph with accurate data, an excel table with the actual data, the exact source of the data and the release date. The slide provides IBM Corporations comparison with its key competitors Microsoft, Dell, Cisco, Intel and Hewlett Packard Enterprise on the basis of 2018 financials Revenue, Operating Income, R and D expenses etc. Download it immediately and use it for your business.
-
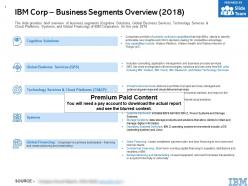 Ibm corp business segments overview 2018
The information presented in this slide has been researched by our team of professional business analysts. This is part of our Company Profiles products selection, and you will need a Paid account to download the actual report with accurate data and sources. Downloaded report will be in Powerpoint and will contain the actual editable slides with the actual data and sources for each data. The slide provides brief overview of business segments Cognitive Solutions, Global Business Services, Technology Services and Cloud Platforms, Systems, and Global Financing of IBM Corporation for the year 2018. Download it immediately and use it for your business.
-
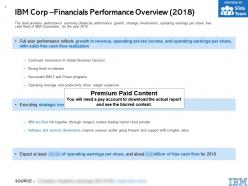 Ibm corp financials performance overview 2018
The information presented in this slide has been researched by our team of professional business analysts. This is part of our Company Profiles products selection, and you will need a Paid account to download the actual report with accurate data and sources. Downloaded report will be in Powerpoint and will contain the actual editable slides with the actual data and sources for each data. The slide provides performance summary financial performance growth, strategic investments, operating earnings per share, free cash flow of IBM Corporation for the year 2018. Download it immediately and use it for your business.
-
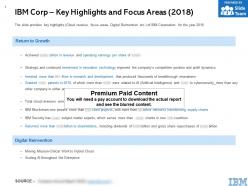 Ibm corp key highlights and focus areas 2018
The information presented in this slide has been researched by our team of professional business analysts. This is part of our Company Profiles products selection, and you will need a Paid account to download the actual report with accurate data and sources. Downloaded report will be in Powerpoint and will contain the actual editable slides with the actual data and sources for each data. The slide provides key highlights Cloud revenue, focus areas, Digital Reinvention etc. of IBM Corporation for the year 2018. Download it immediately and use it for your business.
-
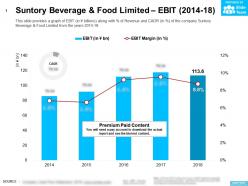 Suntory beverage and food limited ebit 2014-18
This is a professionally designed visual chart for Suntory Beverage And Food Limited EBIT 2014 to 18. This is part of our Data and Statistics products selection, and you will need a Paid account to download the actual report with accurate data and sources. Downloaded report will contain the editable graph with accurate data, an excel table with the actual data, the exact source of the data and the release date. This slide provides a graph of EBIT in JPY billions along with Percentage of Revenue and CAGR in Percentage of the company Suntory Beverage and Food Limited from the years 2014 to 18. Download it immediately and use it for your business.
-
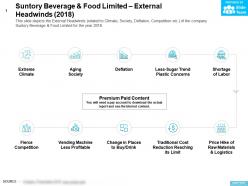 Suntory beverage and food limited external headwinds 2018
The information presented in this slide has been researched by our team of professional business analysts. This is part of our Company Profiles products selection, and you will need a Paid account to download the actual report with accurate data and sources. Downloaded report will be in Powerpoint and will contain the actual editable slides with the actual data and sources for each data. This slide depicts the External Headwinds related to Climate Society Deflation Competition etc of the company Suntory Beverage and Food Limited for the year 2018. Download it immediately and use it for your business.
-
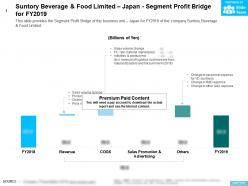 Suntory beverage and food limited japan segment profit bridge for fy2019
The information presented in this slide has been researched by our team of professional business analysts. This is part of our Company Profiles products selection, and you will need a Paid account to download the actual report with accurate data and sources. Downloaded report will be in Powerpoint and will contain the actual editable slides with the actual data and sources for each data. This slide provides the Segment Profit Bridge of the business unit Japan for FY2019 of the company Suntory Beverage and Food Limited. Download it immediately and use it for your business.
-
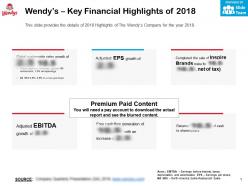 Wendys key financial highlights of 2018
The information presented in this slide has been researched by our team of professional business analysts. This is part of our Company Profiles products selection, and you will need a Paid account to download the actual report with accurate data and sources. Downloaded report will be in Powerpoint and will contain the actual editable slides with the actual data and sources for each data. This slide provides the details of 2018 Highlights of The Wendys Company for the year 2018. Download it immediately and use it for your business.
-
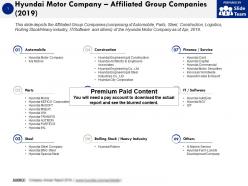 Hyundai motor company affiliated group companies 2019
The information presented in this slide has been researched by our team of professional business analysts. This is part of our Company Profiles products selection, and you will need a Paid account to download the actual report with accurate data and sources. Downloaded report will be in Powerpoint and will contain the actual editable slides with the actual data and sources for each data. This slide depicts the Affiliated Group Companies comprising of Automobile, Parts, Steel, Construction, Logistics, Rolling Stock Heavy industry, IT Software and others of the Hyundai Motor Company as of Apr 2019. Download it immediately and use it for your business.
-
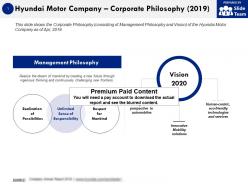 Hyundai motor company corporate philosophy 2019
The information presented in this slide has been researched by our team of professional business analysts. This is part of our Company Profiles products selection, and you will need a Paid account to download the actual report with accurate data and sources. Downloaded report will be in Powerpoint and will contain the actual editable slides with the actual data and sources for each data. This slide shows the Corporate Philosophy consisting of Management Philosophy and Vision of the Hyundai Motor Company as of Apr 2019. Download it immediately and use it for your business.
-
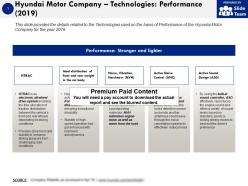 Hyundai motor company technologies performance 2019
The information presented in this slide has been researched by our team of professional business analysts. This is part of our Company Profiles products selection, and you will need a Paid account to download the actual report with accurate data and sources. Downloaded report will be in Powerpoint and will contain the actual editable slides with the actual data and sources for each data. This slide provides the details related to the Technologies used on the basis of Performance of the Hyundai Motor Company for the year 2019. Download it immediately and use it for your business.
-
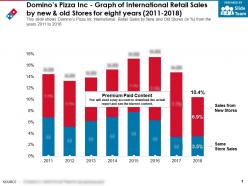 Dominos pizza inc graph of international retail sales by new and old stores for eight years 2011-2018
This is a professionally designed visual chart for Dominos Pizza Inc Graph Of International Retail Sales By New And Old Stores For Eight Years 2011 to 2018. This is part of our Data and Statistics products selection, and you will need a Paid account to download the actual report with accurate data and sources. Downloaded report will contain the editable graph with accurate data, an excel table with the actual data, the exact source of the data and the release date. This slide shows Dominos Pizza Inc International Retail Sales by New and Old Stores in percent from the years 2011 to 2018. Download it immediately and use it for your business.
-
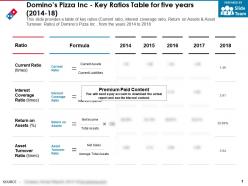 Dominos pizza inc key ratios table for five years 2014-18
This is a professionally designed visual chart for Dominos Pizza Inc Key Ratios Table For Five Years 2014 to 18. This is part of our Data and Statistics products selection, and you will need a Paid account to download the actual report with accurate data and sources. Downloaded report will contain the editable graph with accurate data, an excel table with the actual data, the exact source of the data and the release date. This slide provides a table of key ratios Current ratio, interest coverage ratio, Return on Assets and Asset Turnover Ratio of Dominos Pizza Inc from the years 2014 to 2018. Download it immediately and use it for your business.
-
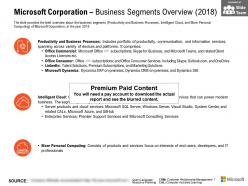 Microsoft corporation business segments overview 2018
The information presented in this slide has been researched by our team of professional business analysts. This is part of our Company Profiles products selection, and you will need a Paid account to download the actual report with accurate data and sources. Downloaded report will be in Powerpoint and will contain the actual editable slides with the actual data and sources for each data. The slide provides the brief overview about the business segments Productivity and Business Processes Intelligent Cloud and More Personal Computing of Microsoft Corporation in the year 2018. Download it immediately and use it for your business.
-
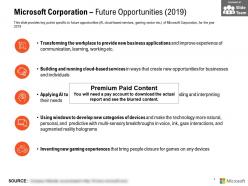 Microsoft corporation future opportunities 2019
The information presented in this slide has been researched by our team of professional business analysts. This is part of our Company Profiles products selection, and you will need a Paid account to download the actual report with accurate data and sources. Downloaded report will be in Powerpoint and will contain the actual editable slides with the actual data and sources for each data. This slide provides key points specific to future opportunities AI cloud based services gaming sector etc of Microsoft Corporation for the year 2019. Download it immediately and use it for your business.
-
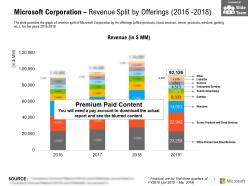 Microsoft corporation revenue split by offerings 2016-2018
This is a professionally designed visual chart for Microsoft Corporation Revenue Split By Offerings 2016 to 2018. This is part of our Data and Statistics products selection, and you will need a Paid account to download the actual report with accurate data and sources. Downloaded report will contain the editable graph with accurate data, an excel table with the actual data, the exact source of the data and the release date. The slide provides the graph of revenue split of Microsoft Corporation by its offerings office products cloud services server products window gaming etc for the years 2016 to 2018. Download it immediately and use it for your business.
-
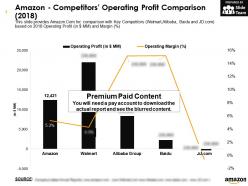 Amazon competitors operating profit comparison 2018
This is a professionally designed visual chart for Amazon Competitors Operating Profit Comparison 2018. This is part of our Data and Statistics products selection, and you will need a Paid account to download the actual report with accurate data and sources. Downloaded report will contain the editable graph with accurate data, an excel table with the actual data, the exact source of the data and the release date. This slide provides Amazon.Com Inc comparison with Key Competitors Walmart, Alibaba, Baidu and JD.com based on 2018 Operating Profit in JPY MM and Margin percent. Download it immediately and use it for your business.
-
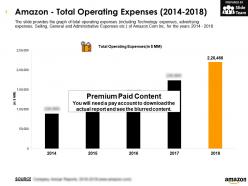 Amazon total operating expenses 2014-2018
This is a professionally designed visual chart for Amazon Total Operating Expenses 2014 to 2018. This is part of our Data and Statistics products selection, and you will need a Paid account to download the actual report with accurate data and sources. Downloaded report will contain the editable graph with accurate data, an excel table with the actual data, the exact source of the data and the release date. The slide provides the graph of total operating expenses including Technology expenses, advertising expenses, Selling, General and Administrative Expenses etc. of Amazon.Com Inc for the years 2014 to 2018. Download it immediately and use it for your business.
-
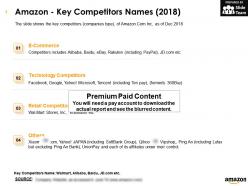 Amazon key competitors names 2018
The information presented in this slide has been researched by our team of professional business analysts. This is part of our Company Profiles products selection, and you will need a Paid account to download the actual report with accurate data and sources. Downloaded report will be in Powerpoint and will contain the actual editable slides with the actual data and sources for each data. The slide shows the key competitors companies type of Amazon.Com Inc as of Dec 2018. Download it immediately and use it for your business.


