Consumer Goods and FMCG Data Statistics PowerPoint Templates, PowerPoint Statistics Slides
- Sub Categories
-
- Agriculture
- Chemicals and Resources
- Construction
- Consumer Goods and FMCG
- E-Commerce
- Energy and Environmental Services
- Finance Insurance and Real Estate
- Health and Pharmaceuticals
- Internet
- Life
- Media and Advertising
- Metals and Electronics
- Retail and Trade
- Services
- Society
- Sports and Recreation
- Survey
- Technology and Telecommunications
- Transportation and Logistics
- Travel Tourism and Hospitality
- USA
-
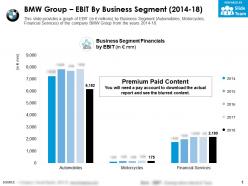 Bmw group ebit by business segment 2014-18
This is a professionally designed visual chart for BMW Group EBIT By Business Segment 2014 to 18. This is part of our Data and Statistics products selection, and you will need a Paid account to download the actual report with accurate data and sources. Downloaded report will contain the editable graph with accurate data, an excel table with the actual data, the exact source of the data and the release date. This slide provides a graph of EBIT in JPY millions by Business Segment Automobiles, Motorcycles, Financial Services of the company BMW Group from the years 2014 to 18. Download it immediately and use it for your business.
-
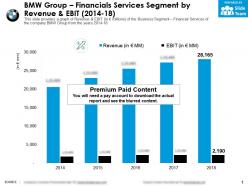 Bmw group financials services segment by revenue and ebit 2014-18
This is a professionally designed visual chart for BMW Group Financials Services Segment By Revenue And EBIT 2014 to 18. This is part of our Data and Statistics products selection, and you will need a Paid account to download the actual report with accurate data and sources. Downloaded report will contain the editable graph with accurate data, an excel table with the actual data, the exact source of the data and the release date. This slide provides a graph of Revenue and EBIT in JPY millions of the Business Segment Financial Services of the company BMW Group from the years 2014 to 18. Download it immediately and use it for your business.
-
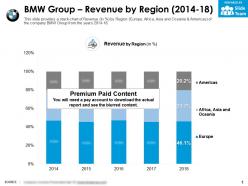 Bmw group revenue by region 2014-18
This is a professionally designed visual chart for BMW Group Revenue By Region 2014 to 18. This is part of our Data and Statistics products selection, and you will need a Paid account to download the actual report with accurate data and sources. Downloaded report will contain the editable graph with accurate data, an excel table with the actual data, the exact source of the data and the release date. This slide provides a stack chart of Revenue in Percentage by Region Europe, Africa, Asia and Oceania and Americas of the company BMW Group from the years 2014 to 18. Download it immediately and use it for your business.
-
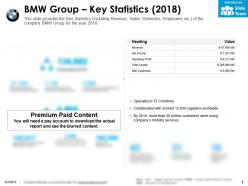 Bmw group key statistics 2018
The information presented in this slide has been researched by our team of professional business analysts. This is part of our Company Profiles products selection, and you will need a Paid account to download the actual report with accurate data and sources. Downloaded report will be in Powerpoint and will contain the actual editable slides with the actual data and sources for each data. This slide provides the Key Statistics including Revenue, Sales, Deliveries, Employees etc. of the company BMW Group for the year 2018. Download it immediately and use it for your business.
-
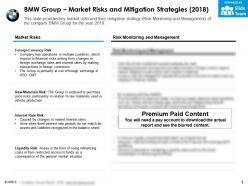 Bmw group market risks and mitigation strategies 2018
The information presented in this slide has been researched by our team of professional business analysts. This is part of our Company Profiles products selection, and you will need a Paid account to download the actual report with accurate data and sources. Downloaded report will be in Powerpoint and will contain the actual editable slides with the actual data and sources for each data. This slide provides key market risks and their mitigation strategy Risk Monitoring and Management of the company BMW Group for the year 2018. Download it immediately and use it for your business.
-
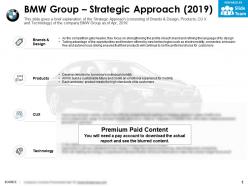 Bmw group strategic approach 2019
The information presented in this slide has been researched by our team of professional business analysts. This is part of our Company Profiles products selection, and you will need a Paid account to download the actual report with accurate data and sources. Downloaded report will be in Powerpoint and will contain the actual editable slides with the actual data and sources for each data. This slide gives a brief explanation of the Strategic Approach consisting of Brands and Design, Products, CU X and Technology of the company BMW Group as of Apr, 2019. Download it immediately and use it for your business.
-
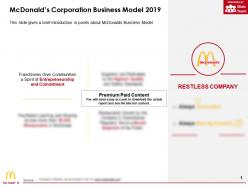 Mcdonalds corporation business model 2019
The information presented in this slide has been researched by our team of professional business analysts. This is part of our Company Profiles products selection, and you will need a Paid account to download the actual report with accurate data and sources. Downloaded report will be in Powerpoint and will contain the actual editable slides with the actual data and sources for each data. This slide gives a brief introduction in points about McDonalds Business Model. Download it immediately and use it for your business.
-
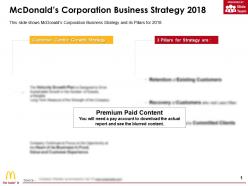 Mcdonalds corporation business strategy 2018
The information presented in this slide has been researched by our team of professional business analysts. This is part of our Company Profiles products selection, and you will need a Paid account to download the actual report with accurate data and sources. Downloaded report will be in Powerpoint and will contain the actual editable slides with the actual data and sources for each data. This slide shows McDonalds Corporation Business Strategy and its Pillars for 2018. Download it immediately and use it for your business.
-
 Mcdonalds corporation introduction 2018
The information presented in this slide has been researched by our team of professional business analysts. This is part of our Company Profiles products selection, and you will need a Paid account to download the actual report with accurate data and sources. Downloaded report will be in Powerpoint and will contain the actual editable slides with the actual data and sources for each data. This slide gives a brief introduction about McDonalds founder, head office, CEO, revenue, outlets etc. in 2018 . Download it immediately and use it for your business.
-
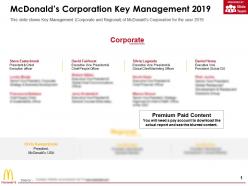 Mcdonalds corporation key management 2019
The information presented in this slide has been researched by our team of professional business analysts. This is part of our Company Profiles products selection, and you will need a Paid account to download the actual report with accurate data and sources. Downloaded report will be in Powerpoint and will contain the actual editable slides with the actual data and sources for each data.This slide shows Key Management Corporate and Regional of McDonalds Corporation for the year 2019. Download it immediately and use it for your business.
-
 Mcdonalds corporation outlook 2019
The information presented in this slide has been researched by our team of professional business analysts. This is part of our Company Profiles products selection, and you will need a Paid account to download the actual report with accurate data and sources. Downloaded report will be in Powerpoint and will contain the actual editable slides with the actual data and sources for each data. This slide shows McDonalds Future Outlook in 2019 like expected costs, capital expansion, income tax rate expectations etc. Download it immediately and use it for your business.
-
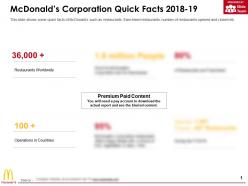 Mcdonalds corporation quick facts 2018-19
The information presented in this slide has been researched by our team of professional business analysts. This is part of our Company Profiles products selection, and you will need a Paid account to download the actual report with accurate data and sources. Downloaded report will be in Powerpoint and will contain the actual editable slides with the actual data and sources for each data. This slide shows some quick facts of McDonalds such as restaurants, franchised restaurants, number of restaurants opened and closed etc. Download it immediately and use it for your business.
-
 Mcdonalds corporation risk factors and mitigation strategies 2018
The information presented in this slide has been researched by our team of professional business analysts. This is part of our Company Profiles products selection, and you will need a Paid account to download the actual report with accurate data and sources. Downloaded report will be in Powerpoint and will contain the actual editable slides with the actual data and sources for each data. This slide shows McDonalds Corporation Risk Factors and Mitigation Strategies for the year 2018. Download it immediately and use it for your business.
-
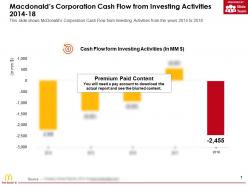 Macdonalds corporation cash flow from investing activities 2014-18
This is a professionally designed visual chart for Macdonalds Corporation Cash Flow From Investing Activities 2014-18. This is part of our Data and Statistics products selection, and you will need a Paid account to download the actual report with accurate data and sources. Downloaded report will contain the editable graph with accurate data, an excel table with the actual data, the exact source of the data and the release date. This slide shows McDonalds Corporation Cash Flow from Investing Activities from the years 2014 to 2018. Download it immediately and use it for your business.
-
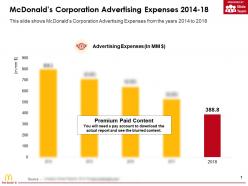 Mcdonalds corporation advertising expenses 2014-18
This is a professionally designed visual chart for Mcdonalds Corporation Advertising Expenses 2014-18. This is part of our Data and Statistics products selection, and you will need a Paid account to download the actual report with accurate data and sources. Downloaded report will contain the editable graph with accurate data, an excel table with the actual data, the exact source of the data and the release date. This slide shows McDonalds Corporation Advertising Expenses from the years 2014 to 2018. Download it immediately and use it for your business.
-
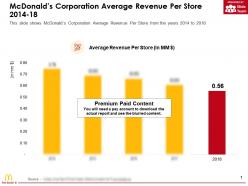 Mcdonalds corporation average revenue per store 2014-18
This is a professionally designed visual chart for Mcdonalds Corporation Average Revenue Per Store 2014-18. This is part of our Data and Statistics products selection, and you will need a Paid account to download the actual report with accurate data and sources. Downloaded report will contain the editable graph with accurate data, an excel table with the actual data, the exact source of the data and the release date. This slide shows McDonalds Corporation Average Revenue Per Store from the years 2014 to 2018. Download it immediately and use it for your business.
-
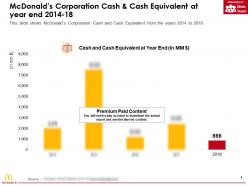 Mcdonalds corporation cash and cash equivalent at year end 2014-18
This is a professionally designed visual chart for Mcdonalds Corporation Cash And Cash Equivalent At Year End 2014-18. This is part of our Data and Statistics products selection, and you will need a Paid account to download the actual report with accurate data and sources. Downloaded report will contain the editable graph with accurate data, an excel table with the actual data, the exact source of the data and the release date. This slide shows McDonalds Corporation Cash and Cash Equivalent from the years 2014 to 2018. Download it immediately and use it for your business.
-
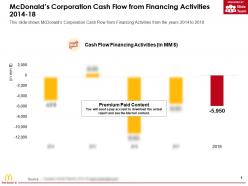 Mcdonalds corporation cash flow from financing activities 2014-18
This is a professionally designed visual chart for Mcdonalds Corporation Cash Flow From Financing Activities 2014-18. This is part of our Data and Statistics products selection, and you will need a Paid account to download the actual report with accurate data and sources. Downloaded report will contain the editable graph with accurate data, an excel table with the actual data, the exact source of the data and the release date. This slide shows McDonalds Corporation Cash Flow from Financing Activities from the years 2014 to 2018. Download it immediately and use it for your business.
-
 Mcdonalds corporation cash flow from operating activities 2014-18
This is a professionally designed visual chart for Mcdonalds Corporation Cash Flow From Operating Activities 2014-18. This is part of our Data and Statistics products selection, and you will need a Paid account to download the actual report with accurate data and sources. Downloaded report will contain the editable graph with accurate data, an excel table with the actual data, the exact source of the data and the release date. This slide shows McDonalds Corporation Cash Flow from Operating Activities from the years 2014 to 2018. Download it immediately and use it for your business.
-
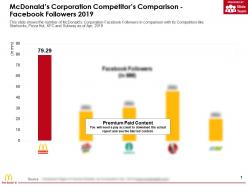 Mcdonalds corporation competitors comparison facebook followers 2019
This is a professionally designed visual chart for Mcdonalds Corporation Competitors Comparison Facebook Followers 2019. This is part of our Data and Statistics products selection, and you will need a Paid account to download the actual report with accurate data and sources. Downloaded report will contain the editable graph with accurate data, an excel table with the actual data, the exact source of the data and the release date. This slide shows the number of McDonalds Corporation Facebook Followers in comparison with its Competitors like Starbucks, Pizza Hut, KFC and Subway as of Apr, 2019 . Download it immediately and use it for your business.
-
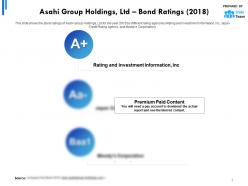 Asahi group holdings ltd bond ratings 2018
The information presented in this slide has been researched by our team of professional business analysts. This is part of our Company Profiles products selection, and you will need a Paid account to download the actual report with accurate data and sources. Downloaded report will be in Powerpoint and will contain the actual editable slides with the actual data and sources for each data. This slide shows the Bond ratings of Asahi Group Holdings, Ltd for the year 2018 by different rating agencies Rating and Investment Information, Inc, Japan Credit Rating Agency, and Moodys Corporation. Download it immediately and use it for your business.
-
 Asahi group holdings ltd corporate social responsibilities business practices 2018
The information presented in this slide has been researched by our team of professional business analysts. This is part of our Company Profiles products selection, and you will need a Paid account to download the actual report with accurate data and sources. Downloaded report will be in Powerpoint and will contain the actual editable slides with the actual data and sources for each data. This slide shows the corporate social responsibilities specific to business practices of Asahi Group Holdings, Ltd for the year 2018. Download it immediately and use it for your business.
-
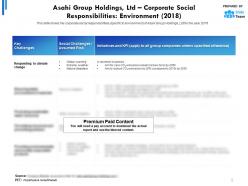 Asahi group holdings ltd corporate social responsibilities environment 2018
The information presented in this slide has been researched by our team of professional business analysts. This is part of our Company Profiles products selection, and you will need a Paid account to download the actual report with accurate data and sources. Downloaded report will be in Powerpoint and will contain the actual editable slides with the actual data and sources for each data. This slide shows the corporate social responsibilities specific to environment of Asahi Group Holdings, Ltd for the year 2018. Download it immediately and use it for your business.
-
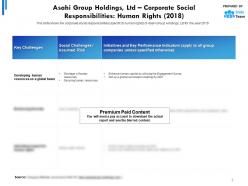 Asahi group holdings ltd corporate social responsibilities human rights 2018
The information presented in this slide has been researched by our team of professional business analysts. This is part of our Company Profiles products selection, and you will need a Paid account to download the actual report with accurate data and sources. Downloaded report will be in Powerpoint and will contain the actual editable slides with the actual data and sources for each data. This slide shows the corporate social responsibilities specific to human rights of Asahi Group Holdings, Ltd for the year 2018. Download it immediately and use it for your business.
-
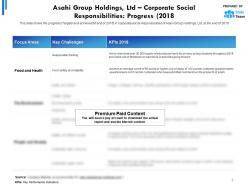 Asahi group holdings ltd corporate social responsibilities progress 2018
The information presented in this slide has been researched by our team of professional business analysts. This is part of our Company Profiles products selection, and you will need a Paid account to download the actual report with accurate data and sources. Downloaded report will be in Powerpoint and will contain the actual editable slides with the actual data and sources for each data. This slide shows the progress Targets and achieved till end of 2018 in corporate social responsibilities of Asahi Group Holdings, Ltd at the end of 2018. Download it immediately and use it for your business.
-
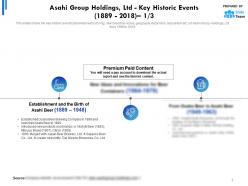 Asahi group holdings ltd key historic events 1889-2018
The information presented in this slide has been researched by our team of professional business analysts. This is part of our Company Profiles products selection, and you will need a Paid account to download the actual report with accurate data and sources. Downloaded report will be in Powerpoint and will contain the actual editable slides with the actual data and sources for each data. This slides shows the key historic events Business restructuring, new brand launches, geography expansion, acquisition etc. of Asahi Group Holdings, Ltd from 1889 to 2018. Download it immediately and use it for your business.
-
 Asahi group holdings ltd alcohol beverages business segment
This is a professionally designed visual chart for Asahi Group Holdings Ltd Alcohol Beverages Business Segment. This is part of our Data and Statistics products selection, and you will need a Paid account to download the actual report with accurate data and sources. Downloaded report will contain the editable graph with accurate data, an excel table with the actual data, the exact source of the data and the release date. This slide provides a revenue split of Alcohol Beverages Business Segment by marketing channel super market, convenience store, drugstore etc. of Asahi Group Holdings, Ltd for the years 2018. Download it immediately and use it for your business.
-
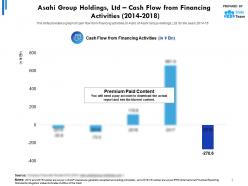 Asahi group holdings ltd cash flow from financing activities 2014-2018
This is a professionally designed visual chart for Asahi Group Holdings Ltd Cash Flow From Financing Activities 2014 to 2018. This is part of our Data and Statistics products selection, and you will need a Paid account to download the actual report with accurate data and sources. Downloaded report will contain the editable graph with accurate data, an excel table with the actual data, the exact source of the data and the release date. This slide provides a graph of cash flow from financing activities in JPY Bn of Asahi Group Holdings, Ltd, for the years 2014 to 18. Download it immediately and use it for your business.
-
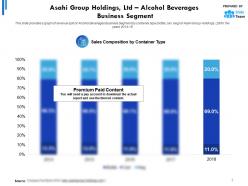 Asahi group holdings ltd statistic 1 alcohol beverages business segment
This is a professionally designed visual chart for Asahi Group Holdings Ltd Statistic 1 Alcohol Beverages Business Segment. This is part of our Data and Statistics products selection, and you will need a Paid account to download the actual report with accurate data and sources. Downloaded report will contain the editable graph with accurate data, an excel table with the actual data, the exact source of the data and the release date. This slide provides a graph of revenue split of Alcohol Beverages Business Segment by container type bottle, can, keg of Asahi Group Holdings, Ltd for the years 2014 to 18. Download it immediately and use it for your business.
-
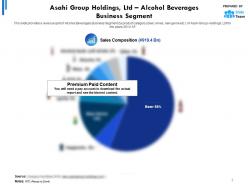 Asahi group holdings ltd statistic 2 alcohol beverages business segment
This is a professionally designed visual chart for Asahi Group Holdings Ltd Statistic 2 Alcohol Beverages Business Segment. This is part of our Data and Statistics products selection, and you will need a Paid account to download the actual report with accurate data and sources. Downloaded report will contain the editable graph with accurate data, an excel table with the actual data, the exact source of the data and the release date. This slide provides a revenue split of Alcohol Beverages Business Segment by product category beer, wines, new genre etc. of Asahi Group Holdings, Ltd for the years 2014 to 18. Download it immediately and use it for your business.
-
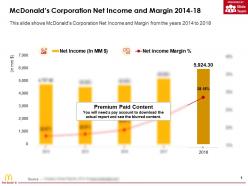 Mcdonalds corporation net income and margin 2014-18
This is a professionally designed visual chart for Mcdonalds Corporation Net Income And Margin 2014-18. This is part of our Data and Statistics products selection, and you will need a Paid account to download the actual report with accurate data and sources. Downloaded report will contain the editable graph with accurate data, an excel table with the actual data, the exact source of the data and the release date. This slide shows McDonalds Corporation Net Income and Margin from the years 2014 to 2018. Download it immediately and use it for your business.
-
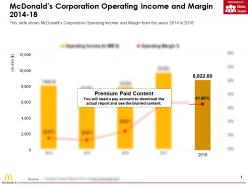 Mcdonalds corporation operating income and margin 2014-18
This is a professionally designed visual chart for Mcdonalds Corporation Operating Income And Margin 2014-18. This is part of our Data and Statistics products selection, and you will need a Paid account to download the actual report with accurate data and sources. Downloaded report will contain the editable graph with accurate data, an excel table with the actual data, the exact source of the data and the release date. This slide shows McDonalds Corporation Operating Income and Margin from the years 2014 to 2018. Download it immediately and use it for your business.
-
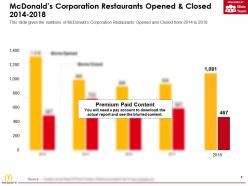 Mcdonalds corporation restaurants opened and closed 2014-2018
This is a professionally designed visual chart for Mcdonalds Corporation Restaurants Opened And Closed 2014-2018. This is part of our Data and Statistics products selection, and you will need a Paid account to download the actual report with accurate data and sources. Downloaded report will contain the editable graph with accurate data, an excel table with the actual data, the exact source of the data and the release date. This slide gives the numbers of McDonalds Corporation Restaurants Opened and Closed from 2014 to 2018. Download it immediately and use it for your business.
-
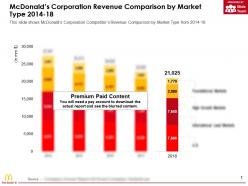 Mcdonalds corporation revenue comparison by market type 2014-18
This is a professionally designed visual chart for Mcdonalds Corporation Revenue Comparison By Market Type 2014-18. This is part of our Data and Statistics products selection, and you will need a Paid account to download the actual report with accurate data and sources. Downloaded report will contain the editable graph with accurate data, an excel table with the actual data, the exact source of the data and the release date. This slide shows McDonalds Corporation Competitors Revenue Comparison by Market Type from 2014 to 18. Download it immediately and use it for your business.
-
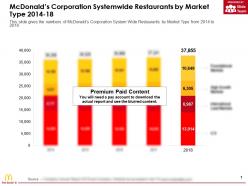 Mcdonalds corporation systemwide restaurants by market type 2014-18
This is a professionally designed visual chart for Mcdonalds Corporation Systemwide Restaurants By Market Type 2014-18. This is part of our Data and Statistics products selection, and you will need a Paid account to download the actual report with accurate data and sources. Downloaded report will contain the editable graph with accurate data, an excel table with the actual data, the exact source of the data and the release date. This slide gives the numbers of McDonalds Corporation System Wide Restaurants by Market Type from 2014 to 2018. Download it immediately and use it for your business.
-
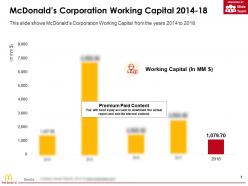 Mcdonalds corporation working capital 2014-18
This is a professionally designed visual chart for Mcdonalds Corporation Working Capital 2014-18. This is part of our Data and Statistics products selection, and you will need a Paid account to download the actual report with accurate data and sources. Downloaded report will contain the editable graph with accurate data, an excel table with the actual data, the exact source of the data and the release date. This slide shows McDonalds Corporation Working Capital from the years 2014 to 2018. Download it immediately and use it for your business.
-
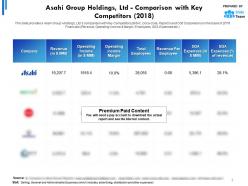 Asahi group holdings ltd comparison with key competitors 2018
This is a professionally designed visual chart for Asahi Group Holdings Ltd Comparison With Key Competitors 2018. This is part of our Data and Statistics products selection, and you will need a Paid account to download the actual report with accurate data and sources. Downloaded report will contain the editable graph with accurate data, an excel table with the actual data, the exact source of the data and the release date. This slide provides a Asahi Group Holdings, Ltds comparison with Key Competitors Britvic, Coca-Cola, PepsiCo and Cott Corporation on the basis of 2018 Financials Revenue, Operating Income and Margin, Employees, SGA Expenses etc. Download it immediately and use it for your business.
-
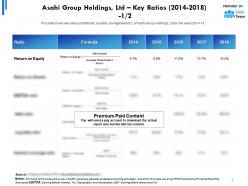 Asahi group holdings ltd key ratios 2014-2018
This is a professionally designed visual chart for Asahi Group Holdings Ltd Key Ratios 2014 to 2018. This is part of our Data and Statistics products selection, and you will need a Paid account to download the actual report with accurate data and sources. Downloaded report will contain the editable graph with accurate data, an excel table with the actual data, the exact source of the data and the release date. This slide shows key ratios profitability, liquidity, management etc. of Asahi Group Holdings, Ltd for the years 2014 to 18. Download it immediately and use it for your business.
-
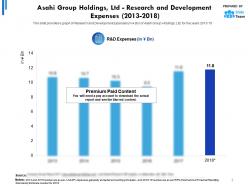 Asahi group holdings ltd research and development expenses 2013-2018
This is a professionally designed visual chart for Asahi Group Holdings Ltd Research And Development Expenses 2013 to 2018. This is part of our Data and Statistics products selection, and you will need a Paid account to download the actual report with accurate data and sources. Downloaded report will contain the editable graph with accurate data, an excel table with the actual data, the exact source of the data and the release date. This slide provides a graph of Research and Development Expenses in JPY Bn of Asahi Group Holdings, Ltd for the years 2013 to 18. Download it immediately and use it for your business.
-
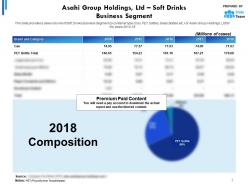 Asahi group holdings ltd soft drinks business segment
This is a professionally designed visual chart for Asahi Group Holdings Ltd Soft Drinks Business Segment. This is part of our Data and Statistics products selection, and you will need a Paid account to download the actual report with accurate data and sources. Downloaded report will contain the editable graph with accurate data, an excel table with the actual data, the exact source of the data and the release date. This slide provides a sales volume of Soft Drinks Business Segment by container type Can, PET bottles, Glass Bottles etc. of Asahi Group Holdings, Ltd for the years 2014 to 18. Download it immediately and use it for your business.
-
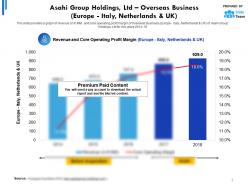 Asahi group holdings ltd statistic 1 overseas business europe italy netherlands and uk
This is a professionally designed visual chart for Asahi Group Holdings Ltd Statistic 1 Overseas Business Europe Italy Netherlands And UK. This is part of our Data and Statistics products selection, and you will need a Paid account to download the actual report with accurate data and sources. Downloaded report will contain the editable graph with accurate data, an excel table with the actual data, the exact source of the data and the release date. This slide provides a graph of revenue in JPY MM and core operating profit margin of Overseas Business Europe-Italy, Netherlands and UK of Asahi Group Holdings, Ltd for the years 2014 to 18. Download it immediately and use it for your business.
-
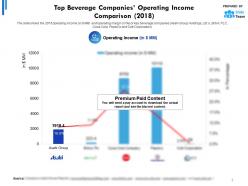 Top beverage companies operating income comparison 2018
This is a professionally designed visual chart for Top Beverage Companies Operating Income Comparison 2018. This is part of our Data and Statistics products selection, and you will need a Paid account to download the actual report with accurate data and sources. Downloaded report will contain the editable graph with accurate data, an excel table with the actual data, the exact source of the data and the release date. The slide shows the 2018 operating income in JPY MM and operating margin in percent of key beverage companies Asahi Group Holdings, Ltds Britvic PLC, Coca-Cola, PepsiCo and Cott Corporation. Download it immediately and use it for your business.
-
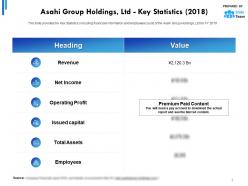 Asahi group holdings ltd key statistics 2018
The information presented in this slide has been researched by our team of professional business analysts. This is part of our Company Profiles products selection, and you will need a Paid account to download the actual report with accurate data and sources. Downloaded report will be in Powerpoint and will contain the actual editable slides with the actual data and sources for each data. This slide provides the Key Statistics including financials information and employees count of the Asahi Group Holdings, Ltd for FY 2018. Download it immediately and use it for your business.
-
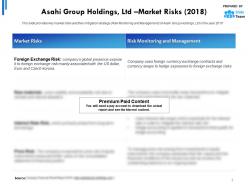 Asahi group holdings ltd market risks 2018
The information presented in this slide has been researched by our team of professional business analysts. This is part of our Company Profiles products selection, and you will need a Paid account to download the actual report with accurate data and sources. Downloaded report will be in Powerpoint and will contain the actual editable slides with the actual data and sources for each data. This slide provides key market risks and their mitigation strategy Risk Monitoring and Management of Asahi Group Holdings, Ltd in the year 2018. Download it immediately and use it for your business.
-
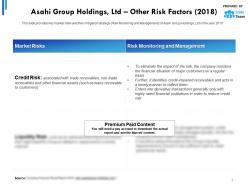 Asahi group holdings ltd other risk factors 2018
The information presented in this slide has been researched by our team of professional business analysts. This is part of our Company Profiles products selection, and you will need a Paid account to download the actual report with accurate data and sources. Downloaded report will be in Powerpoint and will contain the actual editable slides with the actual data and sources for each data. This slide provides key market risks and their mitigation strategy Risk Monitoring and Management of Asahi Group Holdings, Ltd in the year 2018. Download it immediately and use it for your business.
-
 Pepsico brands 2018
The information presented in this slide has been researched by our team of professional business analysts. This is part of our Company Profiles products selection, and you will need a Paid account to download the actual report with accurate data and sources. Downloaded report will be in Powerpoint and will contain the actual editable slides with the actual data and sources for each data. This slide depicts the brands of PepsiCo and its subsidiaries in 2018. Download it immediately and use it for your business.
-
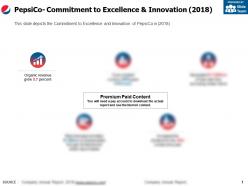 Pepsico commitment to excellence and innovation 2018
The information presented in this slide has been researched by our team of professional business analysts. This is part of our Company Profiles products selection, and you will need a Paid account to download the actual report with accurate data and sources. Downloaded report will be in Powerpoint and will contain the actual editable slides with the actual data and sources for each data. This slide depicts the Commitment to Excellence and Innovation of PepsiCo in 2018. Download it immediately and use it for your business.
-
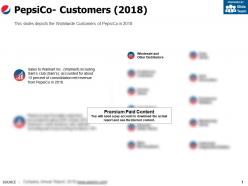 Pepsico customers 2018
The information presented in this slide has been researched by our team of professional business analysts. This is part of our Company Profiles products selection, and you will need a Paid account to download the actual report with accurate data and sources. Downloaded report will be in Powerpoint and will contain the actual editable slides with the actual data and sources for each data. This slides depicts the Worldwide Customers of PepsiCo in 2018. Download it immediately and use it for your business.
-
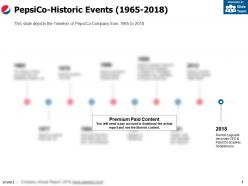 Pepsico historic events 1965-2018
The information presented in this slide has been researched by our team of professional business analysts. This is part of our Company Profiles products selection, and you will need a Paid account to download the actual report with accurate data and sources. Downloaded report will be in Powerpoint and will contain the actual editable slides with the actual data and sources for each data. This slide depicts the Timeline of PepsiCo Company from 1965 to 2018. Download it immediately and use it for your business.
-
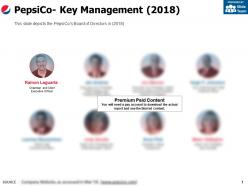 Pepsico key management 2018
The information presented in this slide has been researched by our team of professional business analysts. This is part of our Company Profiles products selection, and you will need a Paid account to download the actual report with accurate data and sources. Downloaded report will be in Powerpoint and will contain the actual editable slides with the actual data and sources for each data. This slide depicts the PepsiCos Board of Directors in 2018. Download it immediately and use it for your business.
-
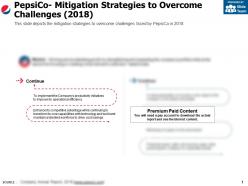 Pepsico mitigation strategies to overcome challenges 2018
The information presented in this slide has been researched by our team of professional business analysts. This is part of our Company Profiles products selection, and you will need a Paid account to download the actual report with accurate data and sources. Downloaded report will be in Powerpoint and will contain the actual editable slides with the actual data and sources for each data. This slide depicts the mitigation strategies to overcome challenges faced by PepsiCo in 2018. Download it immediately and use it for your business.
-
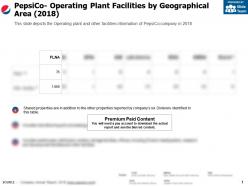 Pepsico operating plant facilities by geographical area 2018
The information presented in this slide has been researched by our team of professional business analysts. This is part of our Company Profiles products selection, and you will need a Paid account to download the actual report with accurate data and sources. Downloaded report will be in Powerpoint and will contain the actual editable slides with the actual data and sources for each data. This slide depicts the Operating plant and other facilities information of PepsiCo company in 2018. Download it immediately and use it for your business.
-
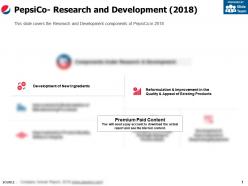 Pepsico research and development 2018
The information presented in this slide has been researched by our team of professional business analysts. This is part of our Company Profiles products selection, and you will need a Paid account to download the actual report with accurate data and sources. Downloaded report will be in Powerpoint and will contain the actual editable slides with the actual data and sources for each data. This slide covers the Research and Development components of PepsiCo in 2018. Download it immediately and use it for your business.
-
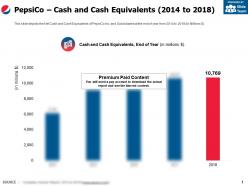 Pepsico cash and cash equivalents 2014-2018
This is a professionally designed visual chart for Pepsico Cash And Cash Equivalents 2014 to 2018. This is part of our Data and Statistics products selection, and you will need a Paid account to download the actual report with accurate data and sources. Downloaded report will contain the editable graph with accurate data, an excel table with the actual data, the exact source of the data and the release date. This slide depicts the Net Cash and Cash Equivalents of PepsiCo Inc. and Subsidiaries at the end of year from 2014 to 2018 In Millions JPY. Download it immediately and use it for your business.
-
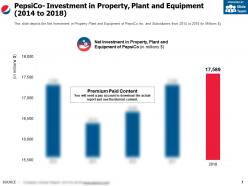 Pepsico investment in property plant and equipment 2014-2018
This is a professionally designed visual chart for Pepsico Investment In Property Plant And Equipment 2014 to 2018. This is part of our Data and Statistics products selection, and you will need a Paid account to download the actual report with accurate data and sources. Downloaded report will contain the editable graph with accurate data, an excel table with the actual data, the exact source of the data and the release date. This slide depicts the Net Investment in Property Plant and Equipment of PepsiCo Inc. and Subsidiaries from 2014 to 2018 In Millions JPY. Download it immediately and use it for your business.
-
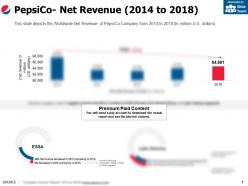 Pepsico net revenue 2014-2018
This is a professionally designed visual chart for Pepsico Net Revenue 2014 to 2018. This is part of our Data and Statistics products selection, and you will need a Paid account to download the actual report with accurate data and sources. Downloaded report will contain the editable graph with accurate data, an excel table with the actual data, the exact source of the data and the release date. This slide depicts the Worldwide Net Revenue of PepsiCo Company from 2014 to 2018 In million U.S dollars. Download it immediately and use it for your business.
-
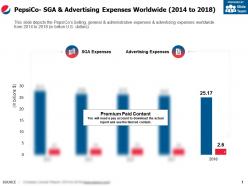 Pepsico sga and advertising expenses worldwide 2014-2018
This is a professionally designed visual chart for Pepsico Sga And Advertising Expenses Worldwide 2014 to 2018. This is part of our Data and Statistics products selection, and you will need a Paid account to download the actual report with accurate data and sources. Downloaded report will contain the editable graph with accurate data, an excel table with the actual data, the exact source of the data and the release date. This slide depicts the PepsiCos Selling, general and administrative expenses and advertising expenses worldwide from 2014 to 2018 in billion U.S dollars. Download it immediately and use it for your business.
-
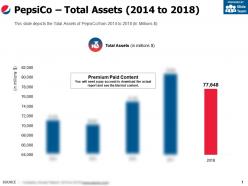 Pepsico total assets 2014-2018
This is a professionally designed visual chart for Pepsico Total Assets 2014 to 2018. This is part of our Data and Statistics products selection, and you will need a Paid account to download the actual report with accurate data and sources. Downloaded report will contain the editable graph with accurate data, an excel table with the actual data, the exact source of the data and the release date. This slide depicts the Total Assets of PepsiCo from 2014 to 2018 In Millions JPY. Download it immediately and use it for your business.
-
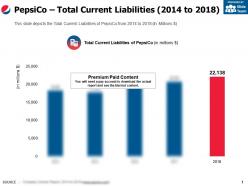 Pepsico total current liabilities 2014-2018
This is a professionally designed visual chart for Pepsico Total Current Liabilities 2014 to 2018. This is part of our Data and Statistics products selection, and you will need a Paid account to download the actual report with accurate data and sources. Downloaded report will contain the editable graph with accurate data, an excel table with the actual data, the exact source of the data and the release date. This slide depicts the Total Current Liabilities of PepsiCo from 2014 to 2018 In Millions JPY. Download it immediately and use it for your business.
-
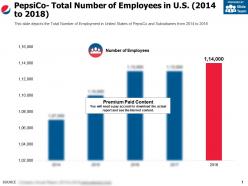 Pepsico total number of employees in us 2014-2018
This is a professionally designed visual chart for Pepsico Total Number Of Employees In Us 2014 to 2018. This is part of our Data and Statistics products selection, and you will need a Paid account to download the actual report with accurate data and sources. Downloaded report will contain the editable graph with accurate data, an excel table with the actual data, the exact source of the data and the release date. This slide depicts the Total Number of Employment in United States of PepsiCo and Subsidiaries from 2014 to 2018. Download it immediately and use it for your business.


