Consumer Goods and FMCG Data Statistics PowerPoint Templates, PowerPoint Statistics Slides
- Sub Categories
-
- Agriculture
- Chemicals and Resources
- Construction
- Consumer Goods and FMCG
- E-Commerce
- Energy and Environmental Services
- Finance Insurance and Real Estate
- Health and Pharmaceuticals
- Internet
- Life
- Media and Advertising
- Metals and Electronics
- Retail and Trade
- Services
- Society
- Sports and Recreation
- Survey
- Technology and Telecommunications
- Transportation and Logistics
- Travel Tourism and Hospitality
- USA
-
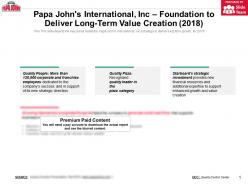 Papa johns international inc foundation to deliver long term value creation 2018
The information presented in this slide has been researched by our team of professional business analysts. This is part of our Company Profiles products selection, and you will need a Paid account to download the actual report with accurate data and sources. Downloaded report will be in Powerpoint and will contain the actual editable slides with the actual data and sources for each data. This This slide depicts the key points related to Papa Johns International, Incs strategy to deliver long term growth for 2018. Download it immediately and use it for your business.
-
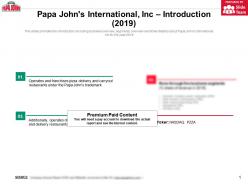 Papa johns international inc introduction 2019
The information presented in this slide has been researched by our team of professional business analysts. This is part of our Company Profiles products selection, and you will need a Paid account to download the actual report with accurate data and sources. Downloaded report will be in Powerpoint and will contain the actual editable slides with the actual data and sources for each data. This slides provides the introduction including business overview, segments, overview and ticker details about Papa Johns International, Inc for the year 2019. Download it immediately and use it for your business.
-
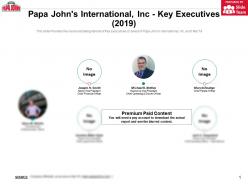 Papa johns international inc key executives 2019
The information presented in this slide has been researched by our team of professional business analysts. This is part of our Company Profiles products selection, and you will need a Paid account to download the actual report with accurate data and sources. Downloaded report will be in Powerpoint and will contain the actual editable slides with the actual data and sources for each data. This slide Provides the name and designations of Key Executives C level of Papa Johns International, Inc as of Mar19. Download it immediately and use it for your business.
-
 Papa johns international inc key facts 2018
The information presented in this slide has been researched by our team of professional business analysts. This is part of our Company Profiles products selection, and you will need a Paid account to download the actual report with accurate data and sources. Downloaded report will be in Powerpoint and will contain the actual editable slides with the actual data and sources for each data. This slide provides the Key Statistics Facts including revenue, operating and net income, and store and employee count of the Papa Johns International Inc for FY 2018. Download it immediately and use it for your business.
-
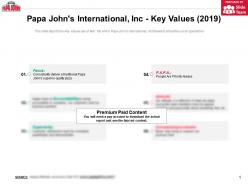 Papa johns international inc key values 2019
The information presented in this slide has been researched by our team of professional business analysts. This is part of our Company Profiles products selection, and you will need a Paid account to download the actual report with accurate data and sources. Downloaded report will be in Powerpoint and will contain the actual editable slides with the actual data and sources for each data. This slide depicts the Key Values as of Mar19 which Papa Johns International, Inc follows to smoothly run its operations. Download it immediately and use it for your business.
-
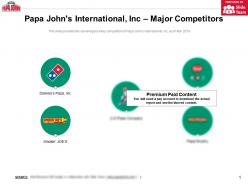 Papa johns international inc major competitors
The information presented in this slide has been researched by our team of professional business analysts. This is part of our Company Profiles products selection, and you will need a Paid account to download the actual report with accurate data and sources. Downloaded report will be in Powerpoint and will contain the actual editable slides with the actual data and sources for each data. This slide provides the name logos of key competitors of Papa Johns International, Inc as of Mar 2019. Download it immediately and use it for your business.
-
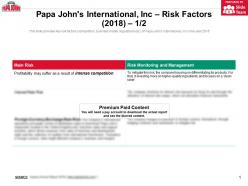 Papa johns international inc risk factors 2018
The information presented in this slide has been researched by our team of professional business analysts. This is part of our Company Profiles products selection, and you will need a Paid account to download the actual report with accurate data and sources. Downloaded report will be in Powerpoint and will contain the actual editable slides with the actual data and sources for each data. This slide provides key risk factors competition, business model, regulations etc. of Papa Johns International, Inc in the year 2018. Download it immediately and use it for your business.
-
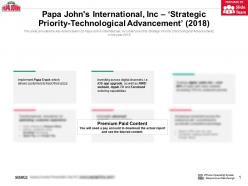 Papa johns international inc strategic priority technological advancement 2018
The information presented in this slide has been researched by our team of professional business analysts. This is part of our Company Profiles products selection, and you will need a Paid account to download the actual report with accurate data and sources. Downloaded report will be in Powerpoint and will contain the actual editable slides with the actual data and sources for each data. This slide provides the key actions taken by Papa Johns International, Inc under one of its Strategic Priority Technological Advancement in the year 2018. Download it immediately and use it for your business.
-
 Papa johns international inc strategic priority-creating accessible value 2018
The information presented in this slide has been researched by our team of professional business analysts. This is part of our Company Profiles products selection, and you will need a Paid account to download the actual report with accurate data and sources. Downloaded report will be in Powerpoint and will contain the actual editable slides with the actual data and sources for each data. This slide provides the key actions taken by Papa Johns International, Inc under one of its Strategic Priority Creating Accessible Value in the year 2018. Download it immediately and use it for your business.
-
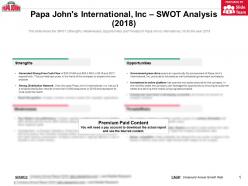 Papa johns international inc swot analysis 2018
The information presented in this slide has been researched by our team of professional business analysts. This is part of our Company Profiles products selection, and you will need a Paid account to download the actual report with accurate data and sources. Downloaded report will be in Powerpoint and will contain the actual editable slides with the actual data and sources for each data. This slide shows the SWOT Strengths, Weaknesses, Opportunities, and Threats of Papa Johns International Inc for the year 2018. Download it immediately and use it for your business.
-
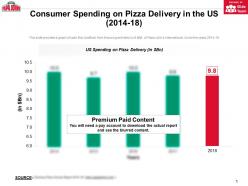 Consumer spending on pizza delivery in the us 2014-18
This is a professionally designed visual chart for Consumer Spending On Pizza Delivery In The Us 2014 to 18. This is part of our Data and Statistics products selection, and you will need a Paid account to download the actual report with accurate data and sources. Downloaded report will contain the editable graph with accurate data, an excel table with the actual data, the exact source of the data and the release date. This slide provides Consumer spending in JPY Bn on Pizza Delivery in the US for the years 2014 to 18. Download it immediately and use it for your business.
-
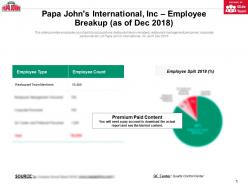 Papa johns international inc employee breakup as of dec 2018
This is a professionally designed visual chart forPapa Johns International Inc Employee Breakup As Of Dec 2018. This is part of our Data and Statistics products selection, and you will need a Paid account to download the actual report with accurate data and sources. Downloaded report will contain the editable graph with accurate data, an excel table with the actual data, the exact source of the data and the release date. This slide provides employee count split by job positions restaurant team members, restaurant management personnel, corporate personnel etc. of Papa Johns International, Inc as of Dec 2018. Download it immediately and use it for your business.
-
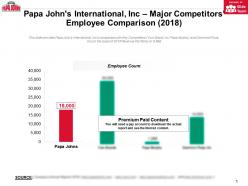 Papa johns international inc major competitors employee comparison 2018
This is a professionally designed visual chart for Papa Johns International Inc Major Competitors Employee Comparison 2018. This is part of our Data and Statistics products selection, and you will need a Paid account to download the actual report with accurate data and sources. Downloaded report will contain the editable graph with accurate data, an excel table with the actual data, the exact source of the data and the release date. This slide provides Papa Johns International, Incs comparison with Key Competitors Yum Brand, Inc, Papa Murphy, and Dominos Pizza, Inc on the basis of 2018 Employee Count. Download it immediately and use it for your business.
-
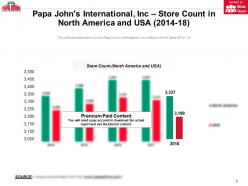 Papa johns international inc store count in north america and usa 2014-18
This is a professionally designed visual chart for Papa Johns International Inc Store Count In North America And USA 2014 to 18. This is part of our Data and Statistics products selection, and you will need a Paid account to download the actual report with accurate data and sources. Downloaded report will contain the editable graph with accurate data, an excel table with the actual data, the exact source of the data and the release date. This slide depicts North America and USA store count comparison of Papa Johns International, Inc for the years 2014 to18. Download it immediately and use it for your business.
-
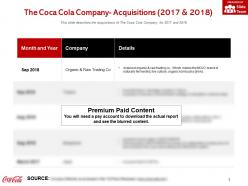 The coca cola company acquisitions 2017-2018
The information presented in this slide has been researched by our team of professional business analysts. This is part of our Company Profiles products selection, and you will need a Paid account to download the actual report with accurate data and sources. Downloaded report will be in Powerpoint and will contain the actual editable slides with the actual data and sources for each data. This slide describes the acquisitions of The Coca Cola Company for 2017 to 2018. Download it immediately and use it for your business.
-
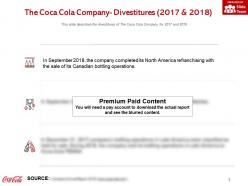 The coca cola company divestitures 2017-2018
The information presented in this slide has been researched by our team of professional business analysts. This is part of our Company Profiles products selection, and you will need a Paid account to download the actual report with accurate data and sources. Downloaded report will be in Powerpoint and will contain the actual editable slides with the actual data and sources for each data. This slide describes the divestitures of The Coca Cola Company for 2017 to 2018. Download it immediately and use it for your business.
-
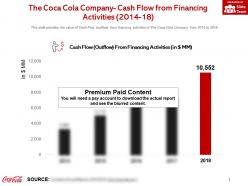 The coca cola company cash flow from financing activities 2014-18
This is a professionally designed visual chart for The Coca Cola Company Cash Flow From Financing Activities 2014 to 18. This is part of our Data and Statistics products selection, and you will need a Paid account to download the actual report with accurate data and sources. Downloaded report will contain the editable graph with accurate data, an excel table with the actual data, the exact source of the data and the release date. This slide provides the value of Cash Flow outflow from financing activities of The Coca Cola Company from 2014 to 2018. Download it immediately and use it for your business.
-
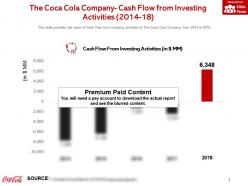 The coca cola company cash flow from investing activities 2014-18
This is a professionally designed visual chart for The Coca Cola Company Cash Flow From Investing Activities 2014 to 18. This is part of our Data and Statistics products selection, and you will need a Paid account to download the actual report with accurate data and sources. Downloaded report will contain the editable graph with accurate data, an excel table with the actual data, the exact source of the data and the release date. This slide provides the value of Cash Flow from investing activities of The Coca Cola Company from 2014 to 2018. Download it immediately and use it for your business.
-
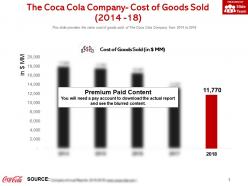 The coca cola company cost of goods sold 2014-18
This is a professionally designed visual chart for The Coca Cola Company Cost Of Goods Sold 2014 to 18. This is part of our Data and Statistics products selection, and you will need a Paid account to download the actual report with accurate data and sources. Downloaded report will contain the editable graph with accurate data, an excel table with the actual data, the exact source of the data and the release date. This slide provides the value cost of goods sold of The Coca Cola Company from 2014 to 2018. Download it immediately and use it for your business.
-
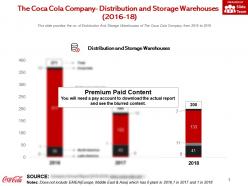 The coca cola company distribution and storage warehouses 2016-18
This is a professionally designed visual chart for The Coca Cola Company Distribution And Storage Warehouses 2016 to 18. This is part of our Data and Statistics products selection, and you will need a Paid account to download the actual report with accurate data and sources. Downloaded report will contain the editable graph with accurate data, an excel table with the actual data, the exact source of the data and the release date. This slide provides the no of Distribution And Storage Warehouses of The Coca Cola Company from 2016 to 2018. Download it immediately and use it for your business.
-
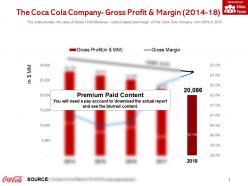 The coca cola company gross profit and margin
This is a professionally designed visual chart for The Coca Cola Company Gross Profit And Margin. This is part of our Data and Statistics products selection, and you will need a Paid account to download the actual report with accurate data and sources. Downloaded report will contain the editable graph with accurate data, an excel table with the actual data, the exact source of the data and the release date. This slide provides the value of Gross Profit Revenue cost of sales and margin of The Coca Cola Company from 2014 to 2018. Download it immediately and use it for your business.
-
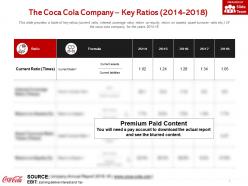 The coca cola company key ratios 2014-2018
This is a professionally designed visual chart for The Coca Cola Company Key Ratios 2014 to 2018. This is part of our Data and Statistics products selection, and you will need a Paid account to download the actual report with accurate data and sources. Downloaded report will contain the editable graph with accurate data, an excel table with the actual data, the exact source of the data and the release date. This slide provides a table of key ratios current ratio, interest coverage ratio, return on equity, return on assets, asset turnover ratio etc. Of the coca cola company, for the years 2014 to 18. Download it immediately and use it for your business.
-
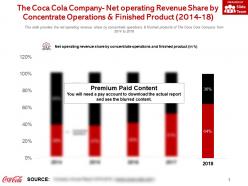 The coca cola company net operating revenue share by concentrate operations and finished product 2014-18
This is a professionally designed visual chart for The Coca Cola Company Net Operating Revenue Share By Concentrate Operations And Finished Product 2014 to 18. This is part of our Data and Statistics products selection, and you will need a Paid account to download the actual report with accurate data and sources. Downloaded report will contain the editable graph with accurate data, an excel table with the actual data, the exact source of the data and the release date. This slide provides the net operating revenue share by concentrate operations and finished products of The Coca Cola Company from 2014 to 2018. Download it immediately and use it for your business.
-
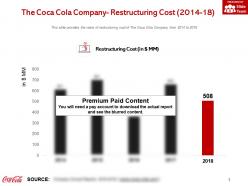 The coca cola company restructuring cost 2014-18
This is a professionally designed visual chart for The Coca Cola Company Restructuring Cost 2014 to 18. This is part of our Data and Statistics products selection, and you will need a Paid account to download the actual report with accurate data and sources. Downloaded report will contain the editable graph with accurate data, an excel table with the actual data, the exact source of the data and the release date. This slide provides the value of restructuring cost of The Coca Cola Company from 2014 to 2018. Download it immediately and use it for your business.
-
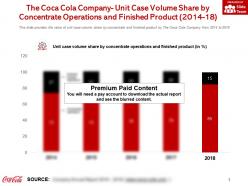 The coca cola company unit case volume share by concentrate operations and finished product 2014-18
This is a professionally designed visual chart for The Coca Cola Company Unit Case Volume Share By Concentrate Operations And Finished Product 2014 to 18. This is part of our Data and Statistics products selection, and you will need a Paid account to download the actual report with accurate data and sources. Downloaded report will contain the editable graph with accurate data, an excel table with the actual data, the exact source of the data and the release date. This slide provides the value of unit case volume share by concentrate and finished product by The Coca Cola Company from 2014 to 2018. Download it immediately and use it for your business.
-
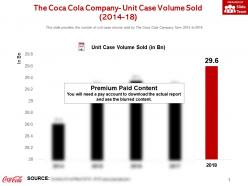 The coca cola company unit case volume sold 2014-18
This is a professionally designed visual chart for The Coca Cola Company Unit Case Volume Sold 2014 to 18. This is part of our Data and Statistics products selection, and you will need a Paid account to download the actual report with accurate data and sources. Downloaded report will contain the editable graph with accurate data, an excel table with the actual data, the exact source of the data and the release date. This slide provides the number of unit case volume sold by The Coca Cola Company from 2014 to 2018. Download it immediately and use it for your business.
-
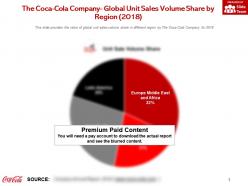 The coca cola company global unit sales volume share by region 2018
This is a professionally designed visual chart for The Coca Cola Company Global Unit Sales Volume Share By Region 2018. This is part of our Data and Statistics products selection, and you will need a Paid account to download the actual report with accurate data and sources. Downloaded report will contain the editable graph with accurate data, an excel table with the actual data, the exact source of the data and the release date. This slide provides the value of global unit sales volume share in different region by The Coca Cola Company for 2018. Download it immediately and use it for your business.
-
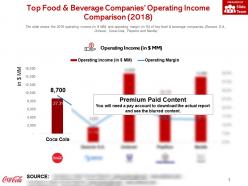 Top food and beverage companies operating income comparison 2018
This is a professionally designed visual chart for Top Food And Beverage Companies Operating Income Comparison 2018. This is part of our Data and Statistics products selection, and you will need a Paid account to download the actual report with accurate data and sources. Downloaded report will contain the editable graph with accurate data, an excel table with the actual data, the exact source of the data and the release date. The slide shows the 2018 operating income in JPY MM and operating margin in percent of key food and beverage companies Danone S.A, Unilever, Coca-Cola, Pepsico and Nestle. Download it immediately and use it for your business.
-
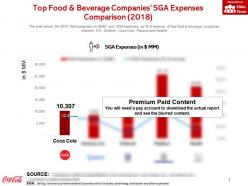 Top food and beverage companies sga expenses comparison 2018
This is a professionally designed visual chart for Top Food And Beverage Companies SGA Expenses Comparison 2018. This is part of our Data and Statistics products selection, and you will need a Paid account to download the actual report with accurate data and sources. Downloaded report will contain the editable graph with accurate data, an excel table with the actual data, the exact source of the data and the release date. The slide shows the 2018 SGA expenses in JPY MM and SGA expenses, as percent of revenue of key food and beverage companies Danone S.A, Unilever, Coca-Cola, Pepsico and Nestle. Download it immediately and use it for your business.
-
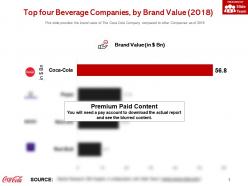 Top four beverage companies by brand value 2018
This is a professionally designed visual chart for Top Four Beverage Companies By Brand Value 2018. This is part of our Data and Statistics products selection, and you will need a Paid account to download the actual report with accurate data and sources. Downloaded report will contain the editable graph with accurate data, an excel table with the actual data, the exact source of the data and the release date. This slide provides the brand value of The Coca Cola Company compared to other Companies as of 2018. Download it immediately and use it for your business.
-
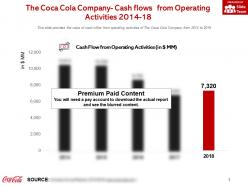 The coca cola company cash flows from operating activities 2014-18
This is a professionally designed visual chart for The Coca Cola Company Cash Flows From Operating Activities 2014 to 18. This is part of our Data and Statistics products selection, and you will need a Paid account to download the actual report with accurate data and sources. Downloaded report will contain the editable graph with accurate data, an excel table with the actual data, the exact source of the data and the release date. This slide provides the value of cash inflow from operating activities of The Coca Cola Company from 2014 to 2018. Download it immediately and use it for your business.
-
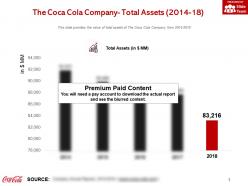 The coca cola company total assets 2014-18
This is a professionally designed visual chart for The Coca Cola Company Total Assets 2014 to 18. This is part of our Data and Statistics products selection, and you will need a Paid account to download the actual report with accurate data and sources. Downloaded report will contain the editable graph with accurate data, an excel table with the actual data, the exact source of the data and the release date. This slide provides the value of total assets of The Coca Cola Company from 2014 to 2018. Download it immediately and use it for your business.
-
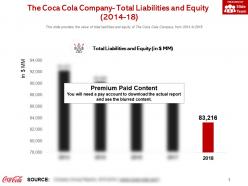 The coca cola company total liabilities and equity 2014-18
This is a professionally designed visual chart for The Coca Cola Company Total Liabilities And Equity 2014 to 18. This is part of our Data and Statistics products selection, and you will need a Paid account to download the actual report with accurate data and sources. Downloaded report will contain the editable graph with accurate data, an excel table with the actual data, the exact source of the data and the release date. This slide provides the value of total liabilities and equity of The Coca Cola Company from 2014 to 2018. Download it immediately and use it for your business.
-
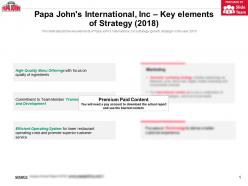 Papa johns international inc key elements of strategy 2018
The information presented in this slide has been researched by our team of professional business analysts. This is part of our Company Profiles products selection, and you will need a Paid account to download the actual report with accurate data and sources. Downloaded report will be in Powerpoint and will contain the actual editable slides with the actual data and sources for each data. This slide depicts the key elements of Papa Johns International, Incs strategy growth strategy in the year 2018. Download it immediately and use it for your business.
-
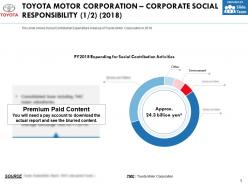 Toyota motor corporation corporate social responsibility 2018
The information presented in this slide has been researched by our team of professional business analysts. This is part of our Company Profiles products selection, and you will need a Paid account to download the actual report with accurate data and sources. Downloaded report will be in Powerpoint and will contain the actual editable slides with the actual data and sources for each data. This slide shows the environmental challenges to overcome by Toyota Motor Corporation in 2050. Download it immediately and use it for your business.
-
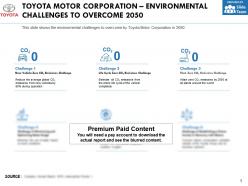 Toyota motor corporation environmental challenges to overcome 2050
The information presented in this slide has been researched by our team of professional business analysts. This is part of our Company Profiles products selection, and you will need a Paid account to download the actual report with accurate data and sources. Downloaded report will be in Powerpoint and will contain the actual editable slides with the actual data and sources for each data. This slide shows the environmental challenges to overcome by Toyota Motor Corporation in 2050. Download it immediately and use it for your business.
-
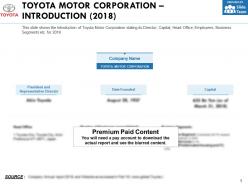 Toyota motor corporation introduction 2018
The information presented in this slide has been researched by our team of professional business analysts. This is part of our Company Profiles products selection, and you will need a Paid account to download the actual report with accurate data and sources. Downloaded report will be in Powerpoint and will contain the actual editable slides with the actual data and sources for each data. This slide shows the Introduction of Toyota Motor Corporation stating its Director, Capital, Head Office, Employees, Business Segments etc. for 2018. Download it immediately and use it for your business.
-
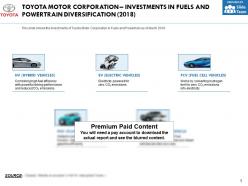 Toyota motor corporation investments in fuels and powertrain diversification 2018
The information presented in this slide has been researched by our team of professional business analysts. This is part of our Company Profiles products selection, and you will need a Paid account to download the actual report with accurate data and sources. Downloaded report will be in Powerpoint and will contain the actual editable slides with the actual data and sources for each data. This slide shows the investments of Toyota Motor Corporation in Fuels and Powertrain as of March 2018. Download it immediately and use it for your business.
-
 Toyota motor corporation major brands 2018
The information presented in this slide has been researched by our team of professional business analysts. This is part of our Company Profiles products selection, and you will need a Paid account to download the actual report with accurate data and sources. Downloaded report will be in Powerpoint and will contain the actual editable slides with the actual data and sources for each data. This slide shows the Major Brands HINO, RANZ, LEXUS etc. of Toyota Motor Corporation for 2018. Download it immediately and use it for your business.
-
 Toyota motor corporation non automotive business 2018
The information presented in this slide has been researched by our team of professional business analysts. This is part of our Company Profiles products selection, and you will need a Paid account to download the actual report with accurate data and sources. Downloaded report will be in Powerpoint and will contain the actual editable slides with the actual data and sources for each data. This slide shows Non Automotive Business of Toyota Motor Corporation in 2018. Download it immediately and use it for your business.
-
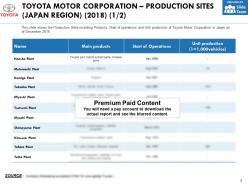 Toyota motor corporation production sites japan region 2018
The information presented in this slide has been researched by our team of professional business analysts. This is part of our Company Profiles products selection, and you will need a Paid account to download the actual report with accurate data and sources. Downloaded report will be in Powerpoint and will contain the actual editable slides with the actual data and sources for each data. This slide shows the Production Sites including Products, Start of operations and Unit production of Toyota Motor Corporation in Japan as of December 2018. Download it immediately and use it for your business.
-
 Toyota motor corporation recent highlights 2019
The information presented in this slide has been researched by our team of professional business analysts. This is part of our Company Profiles products selection, and you will need a Paid account to download the actual report with accurate data and sources. Downloaded report will be in Powerpoint and will contain the actual editable slides with the actual data and sources for each data. This slide shows some Toyota Global Recent Highlights along with different dates for the year 2019 April and May. Download it immediately and use it for your business.
-
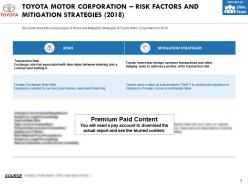 Toyota motor corporation risk factors and mitigation strategies 2018
The information presented in this slide has been researched by our team of professional business analysts. This is part of our Company Profiles products selection, and you will need a Paid account to download the actual report with accurate data and sources. Downloaded report will be in Powerpoint and will contain the actual editable slides with the actual data and sources for each data. This slide shows the various types of Risks and Mitigation Strategies of Toyota Motor Corporation for 2018. Download it immediately and use it for your business.
-
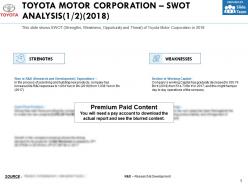 Toyota motor corporation swot analysis 2018
The information presented in this slide has been researched by our team of professional business analysts. This is part of our Company Profiles products selection, and you will need a Paid account to download the actual report with accurate data and sources. Downloaded report will be in Powerpoint and will contain the actual editable slides with the actual data and sources for each data. This slide shows SWOT Strengths, Weakness, Opportunity and Threat of Toyota Motor Corporation in 2018. Download it immediately and use it for your business.
-
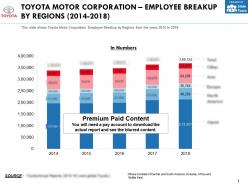 Toyota motor corporation employee breakup by regions 2014-18
This is a professionally designed visual chart for Toyota Motor Corporation Employee Breakup By Regions 2014 to 18. This is part of our Data and Statistics products selection, and you will need a Paid account to download the actual report with accurate data and sources. Downloaded report will contain the editable graph with accurate data, an excel table with the actual data, the exact source of the data and the release date. This slide shows Toyota Motor Corporation Employee Breakup by Regions from the years 2014 to 2018. Download it immediately and use it for your business.
-
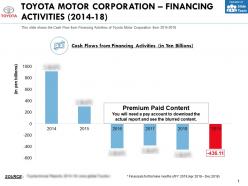 Toyota motor corporation financing activities 2014-18
This is a professionally designed visual chart for Toyota Motor Corporation Financing Activities 2014 to 18. This is part of our Data and Statistics products selection, and you will need a Paid account to download the actual report with accurate data and sources. Downloaded report will contain the editable graph with accurate data, an excel table with the actual data, the exact source of the data and the release date. This slide shows the Cash Flow from Financing Activities of Toyota Motor Corporation from 2014 to 2018. Download it immediately and use it for your business.
-
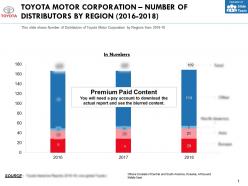 Toyota motor corporation number of distributors by region 2016-2018
This is a professionally designed visual chart for Toyota Motor Corporation Number Of Distributors By Region 2016 to 2018. This is part of our Data and Statistics products selection, and you will need a Paid account to download the actual report with accurate data and sources. Downloaded report will contain the editable graph with accurate data, an excel table with the actual data, the exact source of the data and the release date. This slide shows Number of Distributors of Toyota Motor Corporation by Regions from 2016 to 18. Download it immediately and use it for your business.
-
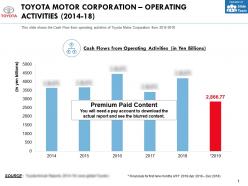 Toyota motor corporation operating activities 2014-18
This is a professionally designed visual chart for Toyota Motor Corporation Operating Activities 2014 to 18. This is part of our Data and Statistics products selection, and you will need a Paid account to download the actual report with accurate data and sources. Downloaded report will contain the editable graph with accurate data, an excel table with the actual data, the exact source of the data and the release date. This slide shows the Cash Flow from operating activities of Toyota Motor Corporation from 2014 to 2018. Download it immediately and use it for your business.
-
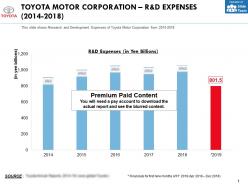 Toyota motor corporation r and d expenses 2014-2018
This is a professionally designed visual chart for Toyota Motor Corporation R And D Expenses 2014 to 2018. This is part of our Data and Statistics products selection, and you will need a Paid account to download the actual report with accurate data and sources. Downloaded report will contain the editable graph with accurate data, an excel table with the actual data, the exact source of the data and the release date. This slide shows Research and Development Expenses of Toyota Motor Corporation from 2014 to 2018. Download it immediately and use it for your business.
-
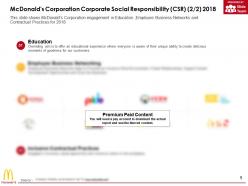 Mcdonalds corporation corporate social responsibility csr 2 2 2018
The information presented in this slide has been researched by our team of professional business analysts. This is part of our Company Profiles products selection, and you will need a Paid account to download the actual report with accurate data and sources. Downloaded report will be in Powerpoint and will contain the actual editable slides with the actual data and sources for each data. This slide shows McDonalds Corporation engagement in Education ,Employee Business Networks and Contractual Practices for 2018. Download it immediately and use it for your business.
-
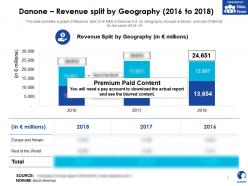 Danone revenue split by geography 2016-2018
This is a professionally designed visual chart for Danone Revenue Split By Geography 2016 to 2018. This is part of our Data and Statistics products selection, and you will need a Paid account to download the actual report with accurate data and sources. Downloaded report will contain the editable graph with accurate data, an excel table with the actual data, the exact source of the data and the release date. This slide provides a graph of Revenue Split in JPY MM of Danone S.A by Geography Europe and Noram and rest of World for the years 2016 to 18. Download it immediately and use it for your business.
-
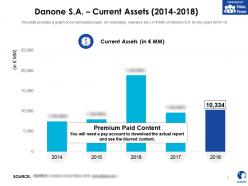 Danone sa current assets 2014-2018
This is a professionally designed visual chart for Danone SA Current Assets 2014 to 2018. This is part of our Data and Statistics products selection, and you will need a Paid account to download the actual report with accurate data and sources. Downloaded report will contain the editable graph with accurate data, an excel table with the actual data, the exact source of the data and the release date. This slide provides a graph of current assets cash, bill receivable, inventory etc. in JPY MM, of Danone S.A for the years 2014 to 18. Download it immediately and use it for your business.
-
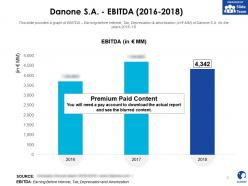 Danone sa ebitda 2016-2018
This is a professionally designed visual chart for Danone SA EBITDA 2016 to 2018. This is part of our Data and Statistics products selection, and you will need a Paid account to download the actual report with accurate data and sources. Downloaded report will contain the editable graph with accurate data, an excel table with the actual data, the exact source of the data and the release date. This slide provides a graph of EBITDA Earning before Interest, Tax, Depreciation and amortization in JPY MM of Danone S.A for the years 2016 to 18. Download it immediately and use it for your business.
-
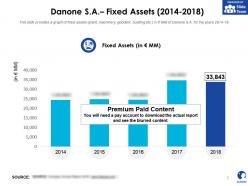 Danone sa fixed assets 2014-2018
This is a professionally designed visual chart for Danone SA Fixed Assets 2014 to 2018. This is part of our Data and Statistics products selection, and you will need a Paid account to download the actual report with accurate data and sources. Downloaded report will contain the editable graph with accurate data, an excel table with the actual data, the exact source of the data and the release date. This slide provides a graph of fixed assets plant, machinery, goodwill, building etc. in JPY MM of Danone S.A for the years 2014 to 18. Download it immediately and use it for your business.
-
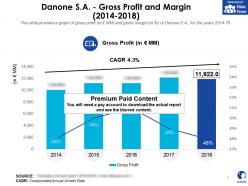 Danone sa gross profit and margin 2014-2018
This is a professionally designed visual chart for Danone SA Gross Profit And Margin 2014 to 2018. This is part of our Data and Statistics products selection, and you will need a Paid account to download the actual report with accurate data and sources. Downloaded report will contain the editable graph with accurate data, an excel table with the actual data, the exact source of the data and the release date. This slide provides a graph of gross profit in JPY MM and gross margin in percent of Danone S.A for the years 2014 to 18. Download it immediately and use it for your business.
-
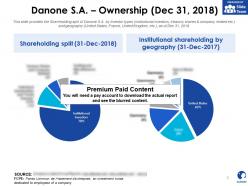 Danone sa ownership dec 31 2018
This is a professionally designed visual chart for Danone SA Ownership Dec 31 2018. This is part of our Data and Statistics products selection, and you will need a Paid account to download the actual report with accurate data and sources. Downloaded report will contain the editable graph with accurate data, an excel table with the actual data, the exact source of the data and the release date. This slide provides the Shareholding split of Danone S.A by Investor types institutional investors, treasury shares and company related etc. and geography United States, France, United Kingdom, etc. as of Dec 31, 2018. Download it immediately and use it for your business.
-
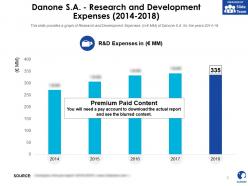 Danone sa research and development expenses 2014-2018
This is a professionally designed visual chart for Danone SA Research And Development Expenses 2014 to 2018. This is part of our Data and Statistics products selection, and you will need a Paid account to download the actual report with accurate data and sources. Downloaded report will contain the editable graph with accurate data, an excel table with the actual data, the exact source of the data and the release date. This slide provides a graph of Research and Development Expenses in JPY MM of Danone S.A for the years 2014 to 18. Download it immediately and use it for your business.
-
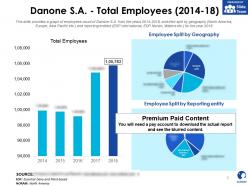 Danone sa total employees 2014-18
This is a professionally designed visual chart for Danone SA Total Employees 2014 to 18. This is part of our Data and Statistics products selection, and you will need a Paid account to download the actual report with accurate data and sources. Downloaded report will contain the editable graph with accurate data, an excel table with the actual data, the exact source of the data and the release date. This slide provides a graph of employees count of Danone S.A from the years 2014 to 2018 and their split by geography North America, Europe, Asia Pacific etc. and reporting entities EDP international, EDP Noram, Waters etc. for the year 2018. Download it immediately and use it for your business.
-
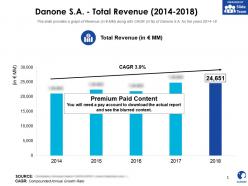 Danone sa total revenue 2014-2018
This is a professionally designed visual chart for Danone SA Total Revenue 2014 to 2018. This is part of our Data and Statistics products selection, and you will need a Paid account to download the actual report with accurate data and sources. Downloaded report will contain the editable graph with accurate data, an excel table with the actual data, the exact source of the data and the release date. This slide provides a graph of Revenue in JPY MM along with CAGR in percent of Danone S.A for the years 2014 to 18. Download it immediately and use it for your business.
-
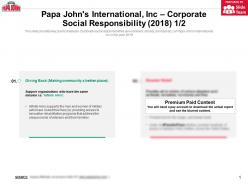 Papa johns international inc corporate social responsibility 2018
The information presented in this slide has been researched by our team of professional business analysts. This is part of our Company Profiles products selection, and you will need a Paid account to download the actual report with accurate data and sources. Downloaded report will be in Powerpoint and will contain the actual editable slides with the actual data and sources for each data. This slide provides key points related to Corporate social responsibilities environment, society, animals etc. of Papa Johns International Inc in the year 2018. Download it immediately and use it for your business.


