Consumer Goods and FMCG Data Statistics PowerPoint Templates, PowerPoint Statistics Slides
- Sub Categories
-
- Agriculture
- Chemicals and Resources
- Construction
- Consumer Goods and FMCG
- E-Commerce
- Energy and Environmental Services
- Finance Insurance and Real Estate
- Health and Pharmaceuticals
- Internet
- Life
- Media and Advertising
- Metals and Electronics
- Retail and Trade
- Services
- Society
- Sports and Recreation
- Survey
- Technology and Telecommunications
- Transportation and Logistics
- Travel Tourism and Hospitality
- USA
-
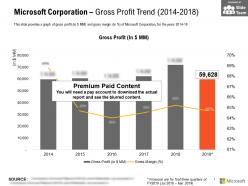 Microsoft corporation gross profit trend 2014-2018
This is a professionally designed visual chart for Microsoft Corporation Gross Profit Trend 2014 to 2018. This is part of our Data and Statistics products selection, and you will need a Paid account to download the actual report with accurate data and sources. Downloaded report will contain the editable graph with accurate data, an excel table with the actual data, the exact source of the data and the release date. This slide provides a graph of gross profit in JPY MM and gross margin in Percentage of Microsoft Corporation for the years 2014 to 18. Download it immediately and use it for your business.
-
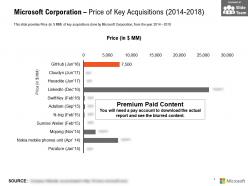 Microsoft corporation price of key acquisitions 2014-2018
This is a professionally designed visual chart for Microsoft Corporation Price Of Key Acquisitions 2014 to 2018. This is part of our Data and Statistics products selection, and you will need a Paid account to download the actual report with accurate data and sources. Downloaded report will contain the editable graph with accurate data, an excel table with the actual data, the exact source of the data and the release date. This slide provides Price in JPY MM of key acquisitions done by Microsoft Corporation from the year 2014 to 2018. Download it immediately and use it for your business.
-
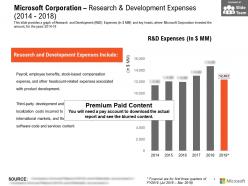 Microsoft corporation research and development expenses 2014-2018
This is a professionally designed visual chart for Microsoft Corporation Research And Development Expenses 2014 to 2018. This is part of our Data and Statistics products selection, and you will need a Paid account to download the actual report with accurate data and sources. Downloaded report will contain the editable graph with accurate data, an excel table with the actual data, the exact source of the data and the release date. This slide provides a graph of Research and Development R and D Expenses in JPY MM and key heads where Microsoft Corporation invested the amount for the years 2014 to 18. Download it immediately and use it for your business.
-
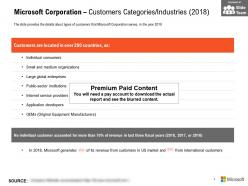 Microsoft corporation customers categories industries 2018
The information presented in this slide has been researched by our team of professional business analysts. This is part of our Company Profiles products selection, and you will need a Paid account to download the actual report with accurate data and sources. Downloaded report will be in Powerpoint and will contain the actual editable slides with the actual data and sources for each data. The slide provides the details about types of customers that Microsoft Corporation serves in the year 2018. Download it immediately and use it for your business.
-
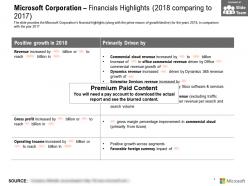 Microsoft corporation financials highlights 2018 comparing to 2017
The information presented in this slide has been researched by our team of professional business analysts. This is part of our Company Profiles products selection, and you will need a Paid account to download the actual report with accurate data and sources. Downloaded report will be in Powerpoint and will contain the actual editable slides with the actual data and sources for each data. The slide provides the Microsoft Corporations financial highlights along with the prime reason of growth decline for the years 2018 in comparison with the year 2017. Download it immediately and use it for your business.
-
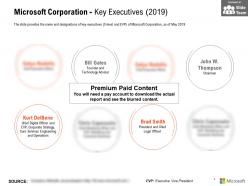 Microsoft corporation key executives 2019
The information presented in this slide has been researched by our team of professional business analysts. This is part of our Company Profiles products selection, and you will need a Paid account to download the actual report with accurate data and sources. Downloaded report will be in Powerpoint and will contain the actual editable slides with the actual data and sources for each data. The slide provides the name and designations of key executives C level and EVP of Microsoft Corporation as of May 2019. Download it immediately and use it for your business.
-
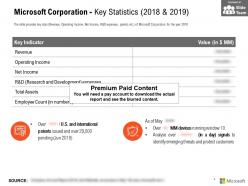 Microsoft corporation key statistics 2018-2019
The information presented in this slide has been researched by our team of professional business analysts. This is part of our Company Profiles products selection, and you will need a Paid account to download the actual report with accurate data and sources. Downloaded report will be in Powerpoint and will contain the actual editable slides with the actual data and sources for each data. The slide provides key stats Revenue Operating Income Net Income and D expenses patents etc of Microsoft Corporation for the year 2018. Download it immediately and use it for your business.
-
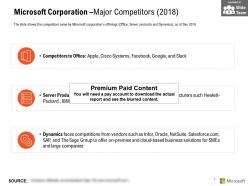 Microsoft corporation major competitors 2018
The information presented in this slide has been researched by our team of professional business analysts. This is part of our Company Profiles products selection, and you will need a Paid account to download the actual report with accurate data and sources. Downloaded report will be in Powerpoint and will contain the actual editable slides with the actual data and sources for each data. The slide shows the competitors name by Microsoft corporations offerings Office Server products and Dynamics as of Dec 2018. Download it immediately and use it for your business.
-
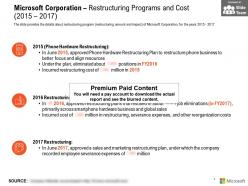 Microsoft corporation restructuring programs and cost 2015-2017
The information presented in this slide has been researched by our team of professional business analysts. This is part of our Company Profiles products selection, and you will need a Paid account to download the actual report with accurate data and sources. Downloaded report will be in Powerpoint and will contain the actual editable slides with the actual data and sources for each data. The slide provides the details about restructuring program restructuring amount and impact of Microsoft Corporation for the years 2015-2017. Download it immediately and use it for your business.
-
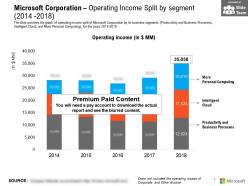 Microsoft corporation operating income split by segment 2014-2018
This is a professionally designed visual chart for Microsoft Corporation Operating Income Split By Segment 2014 to 2018. This is part of our Data and Statistics products selection, and you will need a Paid account to download the actual report with accurate data and sources. Downloaded report will contain the editable graph with accurate data, an excel table with the actual data, the exact source of the data and the release date. The slide provides the graph of operating income split of Microsoft Corporation by its business segments Productivity and Business Processes Intelligent Cloud and More Personal Computing for the years 2014 to 2018. Download it immediately and use it for your business.
-
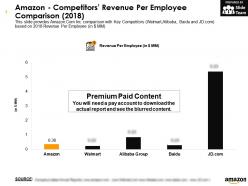 Amazon competitors revenue per employee comparison 2018
This is a professionally designed visual chart for Amazon Competitors Revenue Per Employee Comparison 2018. This is part of our Data and Statistics products selection, and you will need a Paid account to download the actual report with accurate data and sources. Downloaded report will contain the editable graph with accurate data, an excel table with the actual data, the exact source of the data and the release date. This slide provides Amazon.Com Inc comparison with Key Competitors Walmart, Alibaba, Baidu and JD.com based on 2018 Revenue Per Employee in JPY MM. Download it immediately and use it for your business.
-
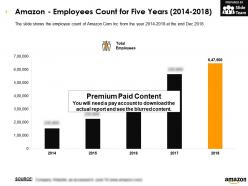 Amazon employees count for five years 2014-2018
This is a professionally designed visual chart for Amazon Employees Count For Five Years 2014 to 2018. This is part of our Data and Statistics products selection, and you will need a Paid account to download the actual report with accurate data and sources. Downloaded report will contain the editable graph with accurate data, an excel table with the actual data, the exact source of the data and the release date. The slide shows the employee count of Amazon.Com Inc from the year 2014 to 2018 at the end Dec 2018. Download it immediately and use it for your business.
-
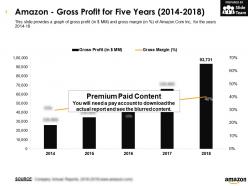 Amazon gross profit for five years 2014-2018
This is a professionally designed visual chart for Amazon Gross Profit For Five Years 2014 to 2018. This is part of our Data and Statistics products selection, and you will need a Paid account to download the actual report with accurate data and sources. Downloaded report will contain the editable graph with accurate data, an excel table with the actual data, the exact source of the data and the release date. This slide provides a graph of gross profit in JPY MM and gross margin in percent of Amazon.Com Inc for the years 2014 to 18. Download it immediately and use it for your business.
-
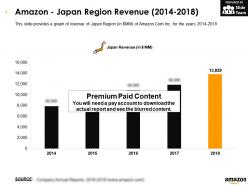 Amazon japan region revenue 2014-2018
This is a professionally designed visual chart for Amazon Japan Region Revenue 2014 to 2018. This is part of our Data and Statistics products selection, and you will need a Paid account to download the actual report with accurate data and sources. Downloaded report will contain the editable graph with accurate data, an excel table with the actual data, the exact source of the data and the release date. This slide provides a graph of revenue of Japan Region in JPY MM of Amazon.Com Inc for the years 2014 to 2018. Download it immediately and use it for your business.
-
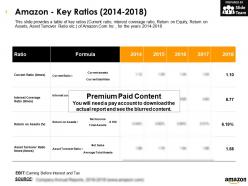 Amazon key ratios 2014-2018
This is a professionally designed visual chart for Amazon Key Ratios 2014 to 2018. This is part of our Data and Statistics products selection, and you will need a Paid account to download the actual report with accurate data and sources. Downloaded report will contain the editable graph with accurate data, an excel table with the actual data, the exact source of the data and the release date. This slide provides a table of key ratios Current ratio, interest coverage ratio, Return on Equity, Return on Assets, Asset Turnover Ratio etc. of Amazon.Com Inc for the years 2014 to 2018. Download it immediately and use it for your business.
-
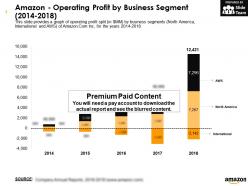 Amazon operating profit by business segment 2014-2018
This is a professionally designed visual chart for Amazon Operating Profit By Business Segment 2014 to 2018. This is part of our Data and Statistics products selection, and you will need a Paid account to download the actual report with accurate data and sources. Downloaded report will contain the editable graph with accurate data, an excel table with the actual data, the exact source of the data and the release date. This slide provides a graph of operating profit split in JPY MM by business segments North America, International and AWS of Amazon.Com Inc for the years 2014 to 2018. Download it immediately and use it for your business.
-
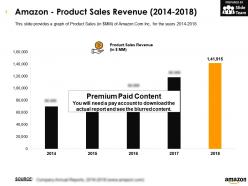 Amazon product sales revenue 2014-2018
This is a professionally designed visual chart for Amazon Product Sales Revenue 2014 to 2018. This is part of our Data and Statistics products selection, and you will need a Paid account to download the actual report with accurate data and sources. Downloaded report will contain the editable graph with accurate data, an excel table with the actual data, the exact source of the data and the release date. This slide provides a graph of Product Sales in JPY MM of Amazon.Com Inc for the years 2014 to 2018. Download it immediately and use it for your business.
-
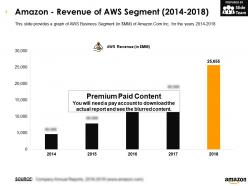 Amazon revenue of aws segment 2014-2018
This is a professionally designed visual chart for Amazon Revenue Of Aws Segment 2014 to 2018. This is part of our Data and Statistics products selection, and you will need a Paid account to download the actual report with accurate data and sources. Downloaded report will contain the editable graph with accurate data, an excel table with the actual data, the exact source of the data and the release date. This slide provides a graph of AWS Business Segment in JPY MM of Amazon.Com Inc for the years 2014 to 2018. Download it immediately and use it for your business.
-
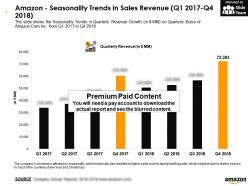 Amazon seasonality trends in sales revenue q1 2017 q4 2018
This is a professionally designed visual chart for Amazon Seasonality Trends In Sales Revenue Q1 2017 Q4 2018. This is part of our Data and Statistics products selection, and you will need a Paid account to download the actual report with accurate data and sources. Downloaded report will contain the editable graph with accurate data, an excel table with the actual data, the exact source of the data and the release date. The slide shows the Seasonality Trends in Quarterly Revenue Growth in JPY MM on Quarterly Basis of Amazon.Com Inc from Q1 2017 to Q4 2018. Download it immediately and use it for your business.
-
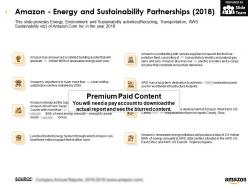 Amazon energy and sustainability partnerships 2018
The information presented in this slide has been researched by our team of professional business analysts. This is part of our Company Profiles products selection, and you will need a Paid account to download the actual report with accurate data and sources. Downloaded report will be in Powerpoint and will contain the actual editable slides with the actual data and sources for each data. This slide provides Energy, Environment and Sustainability activities Recycling, Transportation, AWS Sustainability etc of Amazon.Com Inc in the year 2018. Download it immediately and use it for your business.
-
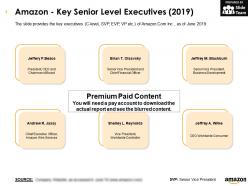 Amazon key senior level executives 2019
The information presented in this slide has been researched by our team of professional business analysts. This is part of our Company Profiles products selection, and you will need a Paid account to download the actual report with accurate data and sources. Downloaded report will be in Powerpoint and will contain the actual editable slides with the actual data and sources for each data. The slide provides the key executives C level, SVP, EVP, VP etc. of Amazon.Com Inc as of June 2019. Download it immediately and use it for your business.
-
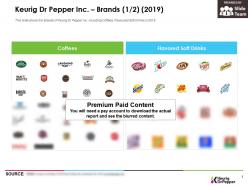 Keurig dr pepper inc brands 2019
The information presented in this slide has been researched by our team of professional business analysts. This is part of our Company Profiles products selection, and you will need a Paid account to download the actual report with accurate data and sources. Downloaded report will be in Powerpoint and will contain the actual editable slides with the actual data and sources for each data. This slide shows the Brands of Keurig Dr Pepper Inc. including Coffees, Flavoured Soft Drinks in 2019. Download it immediately and use it for your business.
-
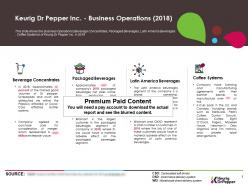 Keurig dr pepper inc business operations 2018
The information presented in this slide has been researched by our team of professional business analysts. This is part of our Company Profiles products selection, and you will need a Paid account to download the actual report with accurate data and sources. Downloaded report will be in Powerpoint and will contain the actual editable slides with the actual data and sources for each data. This slide shows the Business Operations Beverage Concentrates, Packaged Beverages, Latin America Beverages, Coffee Systems of Keurig Dr Pepper Inc. in 2018. Download it immediately and use it for your business.
-
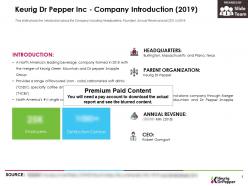 Keurig dr pepper inc company introduction 2019
The information presented in this slide has been researched by our team of professional business analysts. This is part of our Company Profiles products selection, and you will need a Paid account to download the actual report with accurate data and sources. Downloaded report will be in Powerpoint and will contain the actual editable slides with the actual data and sources for each data. This slide shows the Introduction about the Company Including Headquarters, Founded , Annual Revenue and CEO In 2019. Download it immediately and use it for your business.
-
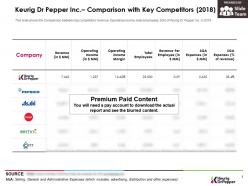 Keurig dr pepper inc comparison with key competitors 2018
The information presented in this slide has been researched by our team of professional business analysts. This is part of our Company Profiles products selection, and you will need a Paid account to download the actual report with accurate data and sources. Downloaded report will be in Powerpoint and will contain the actual editable slides with the actual data and sources for each data. This slide shows the Comparison between top competitors revenue, Operating income, total employees, SGA of Keurig Dr Pepper Inc. in 2018. Download it immediately and use it for your business.
-
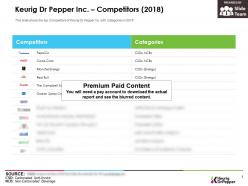 Keurig dr pepper inc competitors 2018
The information presented in this slide has been researched by our team of professional business analysts. This is part of our Company Profiles products selection, and you will need a Paid account to download the actual report with accurate data and sources. Downloaded report will be in Powerpoint and will contain the actual editable slides with the actual data and sources for each data. This slide shows the top Competitors of Keurig Dr Pepper Inc. with Categories in 2018. Download it immediately and use it for your business.
-
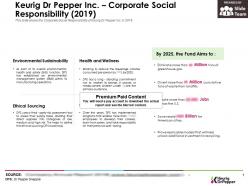 Keurig dr pepper inc corporate social responsibility 2019
The information presented in this slide has been researched by our team of professional business analysts. This is part of our Company Profiles products selection, and you will need a Paid account to download the actual report with accurate data and sources. Downloaded report will be in Powerpoint and will contain the actual editable slides with the actual data and sources for each data. This slide shows the Corporate Social Responsibility of Keurig Dr Pepper Inc. in 2019. Download it immediately and use it for your business.
-
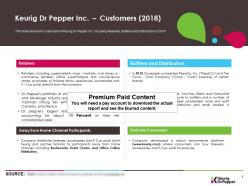 Keurig dr pepper inc customers 2018
The information presented in this slide has been researched by our team of professional business analysts. This is part of our Company Profiles products selection, and you will need a Paid account to download the actual report with accurate data and sources. Downloaded report will be in Powerpoint and will contain the actual editable slides with the actual data and sources for each data. This slide shows the Customers of Keurig Dr Pepper Inc. Including Retailers, Bottlers and Distributors in 2018. Download it immediately and use it for your business.
-
 Keurig dr pepper inc key statistics 2018
The information presented in this slide has been researched by our team of professional business analysts. This is part of our Company Profiles products selection, and you will need a Paid account to download the actual report with accurate data and sources. Downloaded report will be in Powerpoint and will contain the actual editable slides with the actual data and sources for each data. This slide Depicts the Key Major Statistics of Keurig Dr Pepper Inc. in 2018. Download it immediately and use it for your business.
-
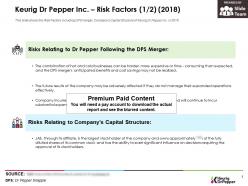 Keurig dr pepper inc risk factors 2018
The information presented in this slide has been researched by our team of professional business analysts. This is part of our Company Profiles products selection, and you will need a Paid account to download the actual report with accurate data and sources. Downloaded report will be in Powerpoint and will contain the actual editable slides with the actual data and sources for each data. This slide shows the Risk Factors including DPS merger, Companys Capital Structure of Keurig Dr Pepper Inc. in 2018. Download it immediately and use it for your business.
-
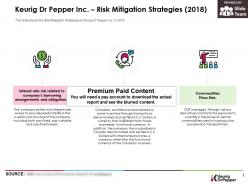 Keurig dr pepper inc risk mitigation strategies 2018
The information presented in this slide has been researched by our team of professional business analysts. This is part of our Company Profiles products selection, and you will need a Paid account to download the actual report with accurate data and sources. Downloaded report will be in Powerpoint and will contain the actual editable slides with the actual data and sources for each data. This slide shows the Risk Mitigation Strategies of Keurig Dr Pepper Inc. in 2018. Download it immediately and use it for your business.
-
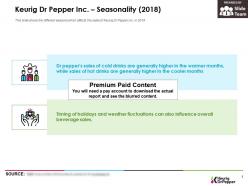 Keurig dr pepper inc seasonality 2018
The information presented in this slide has been researched by our team of professional business analysts. This is part of our Company Profiles products selection, and you will need a Paid account to download the actual report with accurate data and sources. Downloaded report will be in Powerpoint and will contain the actual editable slides with the actual data and sources for each data. This slide shows the different seasons which affects the sales of Keurig Dr Pepper Inc. in 2018. Download it immediately and use it for your business.
-
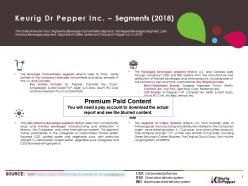 Keurig dr pepper inc segments 2018
The information presented in this slide has been researched by our team of professional business analysts. This is part of our Company Profiles products selection, and you will need a Paid account to download the actual report with accurate data and sources. Downloaded report will be in Powerpoint and will contain the actual editable slides with the actual data and sources for each data. This slide shows the Four Segments Beverage Concentrates Segment, Packaged Beverages Segment, Latin America Beverages Segment, Segment of Coffee Systems of Keurig Dr Pepper Inc. in 2018. Download it immediately and use it for your business.
-
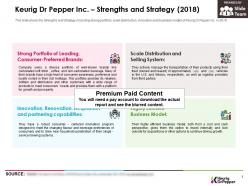 Keurig dr pepper inc strengths and strategy 2018
The information presented in this slide has been researched by our team of professional business analysts. This is part of our Company Profiles products selection, and you will need a Paid account to download the actual report with accurate data and sources. Downloaded report will be in Powerpoint and will contain the actual editable slides with the actual data and sources for each data. This slide shows the Strengths and Strategy including strong portfolio, scale distribution, innovation and business model of Keurig Dr Pepper Inc. in 2018. Download it immediately and use it for your business.
-
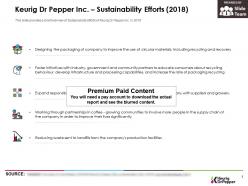 Keurig dr pepper inc sustainability efforts 2018
The information presented in this slide has been researched by our team of professional business analysts. This is part of our Company Profiles products selection, and you will need a Paid account to download the actual report with accurate data and sources. Downloaded report will be in Powerpoint and will contain the actual editable slides with the actual data and sources for each data. This slide provides a brief overview of Sustainability efforts of Keurig Dr Pepper Inc. in 2018. Download it immediately and use it for your business.
-
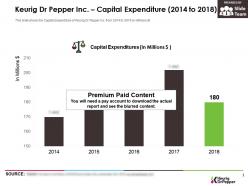 Keurig dr pepper inc capital expenditure 2014-2018
This is a professionally designed visual chart for Keurig Dr Pepper Inc Capital Expenditure 2014 to 2018. This is part of our Data and Statistics products selection, and you will need a Paid account to download the actual report with accurate data and sources. Downloaded report will contain the editable graph with accurate data, an excel table with the actual data, the exact source of the data and the release date. This slide shows the Capital Expenditure of Keurig Dr Pepper Inc. from 2014 to 2018 in Millions JPY. Download it immediately and use it for your business.
-
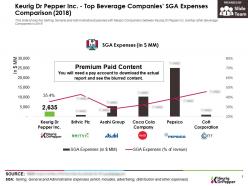 Keurig dr pepper inc top beverage companies sga expenses comparison 2018
This is a professionally designed visual chart for Keurig Dr Pepper Inc Top Beverage Companies SGA Expenses Comparison 2018. This is part of our Data and Statistics products selection, and you will need a Paid account to download the actual report with accurate data and sources. Downloaded report will contain the editable graph with accurate data, an excel table with the actual data, the exact source of the data and the release date. This slide shows the Selling, General and Administrative Expenses with Margin Comparison between Keurig Dr Pepper Inc. and top other Beverage Companies in 2018. Download it immediately and use it for your business.
-
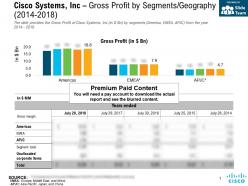 Cisco systems inc gross profit by segments geography 2014-2018
This is a professionally designed visual chart for Cisco Systems Inc Gross Profit By Segments Geography 2014 to 2018. This is part of our Data and Statistics products selection, and you will need a Paid account to download the actual report with accurate data and sources. Downloaded report will contain the editable graph with accurate data, an excel table with the actual data, the exact source of the data and the release date. The slide provides the Gross Profit of Cisco Systems, Inc in JPY Bn by segments America, EMEA, APJC from the year 2014 to 2018. Download it immediately and use it for your business.
-
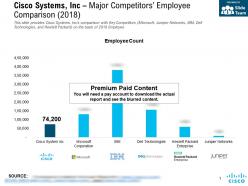 Cisco systems inc major competitors employee comparison 2018
This is a professionally designed visual chart for Cisco Systems Inc Major Competitors Employee Comparison 2018. This is part of our Data and Statistics products selection, and you will need a Paid account to download the actual report with accurate data and sources. Downloaded report will contain the editable graph with accurate data, an excel table with the actual data, the exact source of the data and the release date. This slide provides Cisco Systems, Incs comparison with Key Competitors Microsoft, Juniper Networks, IBM, Dell Technologies and Hewlett Packard on the basis of 2018 Employee. Download it immediately and use it for your business.
-
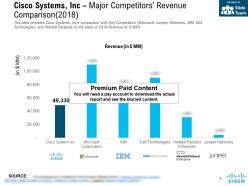 Cisco systems inc major competitors revenue comparison 2018
This is a professionally designed visual chart for Cisco Systems Inc Major Competitors Revenue Comparison 2018. This is part of our Data and Statistics products selection, and you will need a Paid account to download the actual report with accurate data and sources. Downloaded report will contain the editable graph with accurate data, an excel table with the actual data, the exact source of the data and the release date. This slide provides Cisco Systems, Incs comparison with Key Competitors Microsoft, Juniper Networks, IBM, Dell Technologies and Hewlett Packard on the basis of 2018 Revenue in JPY MM. Download it immediately and use it for your business.
-
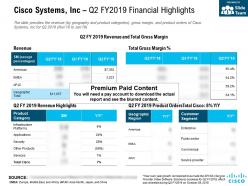 Cisco systems inc q2 fy 2019 financial highlights
This is a professionally designed visual chart for Cisco Systems Inc Q2 FY 2019 Financial Highlights. This is part of our Data and Statistics products selection, and you will need a Paid account to download the actual report with accurate data and sources. Downloaded report will contain the editable graph with accurate data, an excel table with the actual data, the exact source of the data and the release date. The slide provides the revenue by geography and product categories, gross margin and product orders of Cisco Systems, Inc for Q2 2019 Nov 18 to Jan 19. Download it immediately and use it for your business.
-
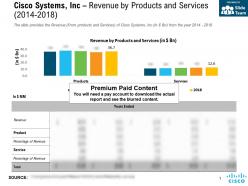 Cisco systems inc revenue by products and services 2014-2018
This is a professionally designed visual chart for Cisco Systems Inc Revenue By Products And Services 2014 to 2018. This is part of our Data and Statistics products selection, and you will need a Paid account to download the actual report with accurate data and sources. Downloaded report will contain the editable graph with accurate data, an excel table with the actual data, the exact source of the data and the release date. The slide provides the Revenue From products and Services of Cisco Systems, Inc in JPY Bn from the year 2014 to 2018. Download it immediately and use it for your business.
-
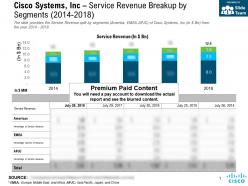 Cisco systems inc service revenue breakup by segments 2014-2018
This is a professionally designed visual chart for Cisco Systems Inc Service Revenue Breakup By Segments 2014 to 2018. This is part of our Data and Statistics products selection, and you will need a Paid account to download the actual report with accurate data and sources. Downloaded report will contain the editable graph with accurate data, an excel table with the actual data, the exact source of the data and the release date. The slide provides the Service Revenue split by segments America, EMEA, APJC of Cisco Systems, Inc in JPY Bn from the year 2014 to 2018. Download it immediately and use it for your business.
-
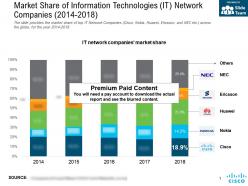 Market share of information technologies it network companies 2014-2018
This is a professionally designed visual chart for Market Share Of Information Technologies It Network Companies 2014 to 2018. This is part of our Data and Statistics products selection, and you will need a Paid account to download the actual report with accurate data and sources. Downloaded report will contain the editable graph with accurate data, an excel table with the actual data, the exact source of the data and the release date. The slide provides the market share of top IT Network Companies Cisco, Nokia, Huawei, Ericsson, and NEC etc. across the globe for the year 2014 to 2018. Download it immediately and use it for your business.
-
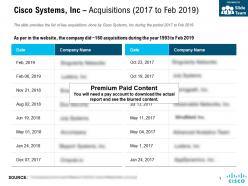 Cisco systems inc acquisitions 2017 to feb 2019
The information presented in this slide has been researched by our team of professional business analysts. This is part of our Company Profiles products selection, and you will need a Paid account to download the actual report with accurate data and sources. Downloaded report will be in Powerpoint and will contain the actual editable slides with the actual data and sources for each data. The slide provides the list of key acquisitions done by Cisco Systems, Inc during the period 2017 to Feb 2019. Download it immediately and use it for your business.
-
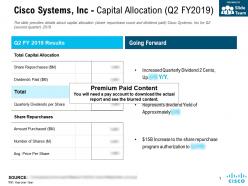 Cisco systems inc capital allocation q2 fy 2019
The information presented in this slide has been researched by our team of professional business analysts. This is part of our Company Profiles products selection, and you will need a Paid account to download the actual report with accurate data and sources. Downloaded report will be in Powerpoint and will contain the actual editable slides with the actual data and sources for each data. The slide provides details about capital allocation share repurchase count and dividend paid Cisco Systems, Inc for Q2 second quarter 2019. Download it immediately and use it for your business.
-
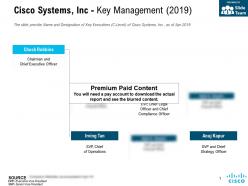 Cisco systems inc key management 2019
The information presented in this slide has been researched by our team of professional business analysts. This is part of our Company Profiles products selection, and you will need a Paid account to download the actual report with accurate data and sources. Downloaded report will be in Powerpoint and will contain the actual editable slides with the actual data and sources for each data. The slide provide Name and Designation of Key Executives C Level of Cisco Systems, Inc as of Apr 2019. Download it immediately and use it for your business.
-
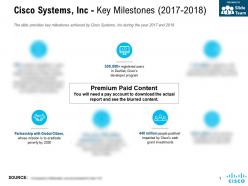 Cisco systems inc key milestones 2017-2018
The information presented in this slide has been researched by our team of professional business analysts. This is part of our Company Profiles products selection, and you will need a Paid account to download the actual report with accurate data and sources. Downloaded report will be in Powerpoint and will contain the actual editable slides with the actual data and sources for each data. The slide provides key milestones achieved by Cisco Systems, Inc during the year 2017 to 2018. Download it immediately and use it for your business.
-
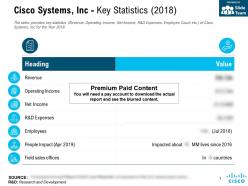 Cisco systems inc key statistics 2018
The information presented in this slide has been researched by our team of professional business analysts. This is part of our Company Profiles products selection, and you will need a Paid account to download the actual report with accurate data and sources. Downloaded report will be in Powerpoint and will contain the actual editable slides with the actual data and sources for each data. The sides provides key statistics Revenue, Operating Income, Net income, R and D Expenses, Employee Count etc. of Cisco Systems, Inc for the Year 2018. Download it immediately and use it for your business.
-
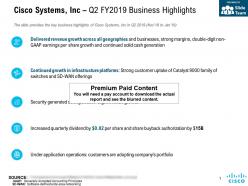 Cisco systems inc q2 fy 2019 business highlights
The information presented in this slide has been researched by our team of professional business analysts. This is part of our Company Profiles products selection, and you will need a Paid account to download the actual report with accurate data and sources. Downloaded report will be in Powerpoint and will contain the actual editable slides with the actual data and sources for each data. The slide provides the key business highlights of Cisco Systems, Inc in Q2 2019 Nov 18 to Jan 19. Download it immediately and use it for your business.
-
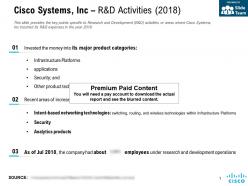 Cisco systems inc r and d activities 2018
The information presented in this slide has been researched by our team of professional business analysts. This is part of our Company Profiles products selection, and you will need a Paid account to download the actual report with accurate data and sources. Downloaded report will be in Powerpoint and will contain the actual editable slides with the actual data and sources for each data. This slide provides the key points specific to Research and Development R and D activities or areas where Cisco Systems, Inc incurred its R and D expenses in the year 2018. Download it immediately and use it for your business.
-
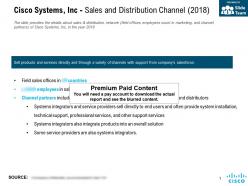 Cisco systems inc sales and distribution channel 2018
The information presented in this slide has been researched by our team of professional business analysts. This is part of our Company Profiles products selection, and you will need a Paid account to download the actual report with accurate data and sources. Downloaded report will be in Powerpoint and will contain the actual editable slides with the actual data and sources for each data. The slide provides the details about sales and distribution network field offices, employees count in marketing and channel partners of Cisco Systems, Inc in the year 2018. Download it immediately and use it for your business.
-
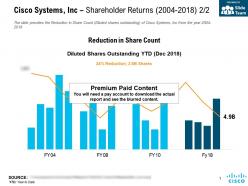 Cisco systems inc shareholder returns 2004-2018
The information presented in this slide has been researched by our team of professional business analysts. This is part of our Company Profiles products selection, and you will need a Paid account to download the actual report with accurate data and sources. Downloaded report will be in Powerpoint and will contain the actual editable slides with the actual data and sources for each data. The slide provides the Reduction in Share Count Diluted shares outstanding of Cisco Systems, Inc from the year 2004 to 2018. Download it immediately and use it for your business.
-
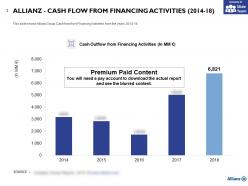 Allianz cash flow from financing activities 2014-18
This is a professionally designed visual chart for Allianz Cash Flow From Financing Activities 2014 to 18. This is part of our Data and Statistics products selection, and you will need a Paid account to download the actual report with accurate data and sources. Downloaded report will contain the editable graph with accurate data, an excel table with the actual data, the exact source of the data and the release date. This slide shows Allianz Group Cash flow from Financing Activities from the years 2014 to 18. Download it immediately and use it for your business.
-
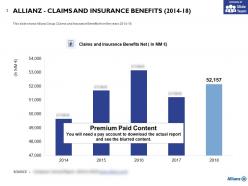 Allianz claims and insurance benefits 2014-18
This is a professionally designed visual chart for Allianz Claims And Insurance Benefits 2014 to 18. This is part of our Data and Statistics products selection, and you will need a Paid account to download the actual report with accurate data and sources. Downloaded report will contain the editable graph with accurate data, an excel table with the actual data, the exact source of the data and the release date. This slide shows Allianz Group Claims and Insurance Benefits from the years 2014 to 18. Download it immediately and use it for your business.
-
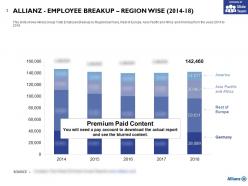 Allianz employee breakup region wise 2014-18
This is a professionally designed visual chart for Allianz Employee Breakup Region Wise 2014 to 18. This is part of our Data and Statistics products selection, and you will need a Paid account to download the actual report with accurate data and sources. Downloaded report will contain the editable graph with accurate data, an excel table with the actual data, the exact source of the data and the release date. This slide shows Allianz Group Total Employee Breakup by Region Germany, Rest of Europe, Asia Pacific and Africa and America from the years 2014 to 2018. Download it immediately and use it for your business.
-
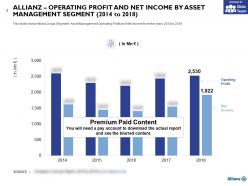 Allianz operating profit and net income by asset management segment 2014-2018
This is a professionally designed visual chart for Allianz Operating Profit And Net Income By Asset Management Segment 2014 to 2018. This is part of our Data and Statistics products selection, and you will need a Paid account to download the actual report with accurate data and sources. Downloaded report will contain the editable graph with accurate data, an excel table with the actual data, the exact source of the data and the release date. This slide shows Allianz Group Segment Asset Management Operating Profit and Net Income from the years 2014 to 2018. Download it immediately and use it for your business.
-
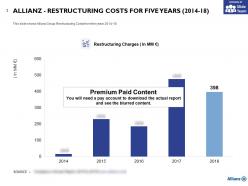 Allianz restructuring costs for five years 2014-18
This is a professionally designed visual chart for Allianz Restructuring Costs For Five Years 2014 to 18. This is part of our Data and Statistics products selection, and you will need a Paid account to download the actual report with accurate data and sources. Downloaded report will contain the editable graph with accurate data, an excel table with the actual data, the exact source of the data and the release date. This slide shows Allianz Group Restructuring Costs from the years 2014 to 18. Download it immediately and use it for your business.
-
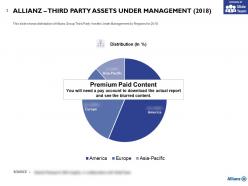 Allianz third party assets under management 2018
This is a professionally designed visual chart for Allianz Third Party Assets Under Management 2018. This is part of our Data and Statistics products selection, and you will need a Paid account to download the actual report with accurate data and sources. Downloaded report will contain the editable graph with accurate data, an excel table with the actual data, the exact source of the data and the release date. This slide shows distribution of Allianz Group Third Party Assets Under Management by Regions for 2018. Download it immediately and use it for your business.
-
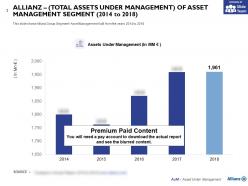 Allianz total assets under management of asset management segment 2014-2018
This is a professionally designed visual chart for Allianz Total Assets Under Management Of Asset Management Segment 2014 to 2018. This is part of our Data and Statistics products selection, and you will need a Paid account to download the actual report with accurate data and sources. Downloaded report will contain the editable graph with accurate data, an excel table with the actual data, the exact source of the data and the release date. This slide shows Allianz Group Segment Asset Management AuM from the years 2014 to 2018. Download it immediately and use it for your business.


