USA Data Statistics PowerPoint Templates, PowerPoint Statistics Slides
- Sub Categories
-
- Agriculture
- Chemicals and Resources
- Construction
- Consumer Goods and FMCG
- E-Commerce
- Energy and Environmental Services
- Finance Insurance and Real Estate
- Health and Pharmaceuticals
- Internet
- Life
- Media and Advertising
- Metals and Electronics
- Retail and Trade
- Services
- Society
- Sports and Recreation
- Survey
- Technology and Telecommunications
- Transportation and Logistics
- Travel Tourism and Hospitality
- USA
-
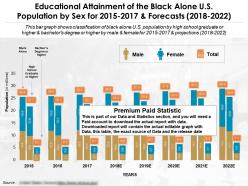 Educational attainment of the black alone us population by sex for 2015-2022
Presenting this set of slides with name - Educational Attainment Of The Black Alone US Population By Sex For 2015-2022. Educational Attainment of the Black alone U.S. Population by Sex for 2015 TO 2017 and Forecasts 2018 TO 2022. This is part of our Data and Statistics products selection, and you will need a Paid account to download the actual report with accurate data. Downloaded report will contain the actual editable graph with the actual data, an excel table with the actual data, the exact source of the data and the release date. This bar graph shows classification of Black alone U.S. Population by High School Graduate or higher and Bachelors degree or higher by male and female for 2015 TO 2017 and projections 2018 TO 2022. It covers topic Educational Attainment levels of Black Alone by Sex for region USA and is for date range 2015 TO 22. Download it immediately and use it for your business.
-
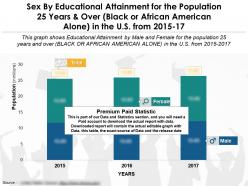 Sex by educational attainment for the population 25 years and over black or african american alone in us 2015-17
Presenting this set of slides with name - Sex By Educational Attainment For The Population 25 Years And Over Black Or African American Alone In US 2015-17. Sex By Educational Attainment For The Population 25 Years And Over Black Or African American Alone In The U.S. From 2015 TO 17. This is part of our Data and Statistics products selection, and you will need a Paid account to download the actual report with accurate data. Downloaded report will contain the actual editable graph with the actual data, an excel table with the actual data, the exact source of the data and the release date. This graph shows Educational Attainment by Male and Female for the population 25 years and over Black Or African American Alone in the U.S. from 2015 TO 2017. It covers topic Educational Attainment for Black Or African American Alone by sex for region USAand is for date range 2015 TO 17. Download it immediately and use it for your business.
-
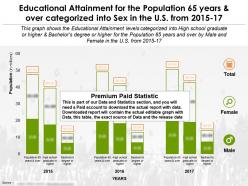 Educational attainment by sex for 65 years and over in the us from 2015-2017
Presenting this set of slides with name - Educational Attainment By Sex For 65 Years And Over In The US From 2015-2017. Educational Attainment for the Population 65 Years and Over categorized into Sex in the U.S. from 2015 TO 17. This is part of our Data and Statistics products selection, and you will need a Paid account to download the actual report with accurate data. Downloaded report will contain the actual editable graph with the actual data, an excel table with the actual data, the exact source of the data and the release date. This graph shows the Educational Attainment levels categorized into High school graduate or higher and Bachelors degree or higher for the Population 65 years and Over by Male and Female in the U.S. from 2015 TO 17. It covers topic Educational Attainment levels by Sex for 65 Years and Over for region USA and is for date range 2015 TO 17. Download it immediately and use it for your business.
-
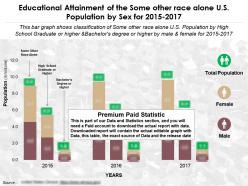 Educational attainment by sex of the some other race alone us population from 2015-2017
Presenting this set of slides with name - Educational Attainment By Sex Of The Some Other Race Alone US Population From 2015-2017. Educational Attainment of the Some other race alone U.S. Population by Sex for 2015 TO 2017. This is part of our Data and Statistics products selection, and you will need a Paid account to download the actual report with accurate data. Downloaded report will contain the actual editable graph with the actual data, an excel table with the actual data, the exact source of the data and the release date.This bar graph shows classification of Some other race alone U.S. Population by High School Graduate or higher and Bachelors degree or higher by male and female for 2015 TO 2017. It covers topic Educational Attainment levels of Some Other Race Alone for region USA and is for date range 2015 TO 17. Download it immediately and use it for your business.
-
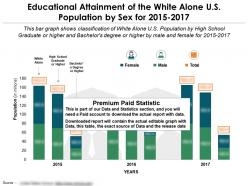 Educational attainment of the white alone us population by sex for 2015-2017
Presenting this set of slides with name - Educational Attainment Of The White Alone US Population By Sex For 2015-2017. Educational Attainment of the White Alone U.S. Population by Sex for 2015 TO 2017. This is part of our Data and Statistics products selection, and you will need a Paid account to download the actual report with accurate data. Downloaded report will contain the actual editable graph with the actual data, an excel table with the actual data, the exact source of the data and the release date. This bar graph shows classification of White Alone U.S. Population by High School Graduate or higher and Bachelors degree or higher by male and female for 2015 TO 2017. It covers topic Educational Attainment levels by Sex for White Alone for region USA and is for date range 2017. Download it immediately and use it for your business.
-
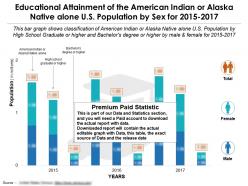 Educational attainment of american indian or alaska native alone us population by sex for 2015-2017
Presenting this set of slides with name - Educational Attainment Of American Indian Or Alaska Native Alone US Population By Sex For 2015-2017. Educational Attainment of the American Indian or Alaska Native alone U.S. Population by Sex for 2015 TO 2017. This is part of our Data and Statistics products selection, and you will need a Paid account to download the actual report with accurate data. Downloaded report will contain the actual editable graph with the actual data, an excel table with the actual data, the exact source of the data and the release date. This bar graph shows classification of American Indian or Alaska Native alone U.S. Population by High School Graduate or higher and Bachelors degree or higher by male and female for 2015 TO 2017. It covers topic Educational Attainment levels of American or Alaska Native Alone for region USA and is for date range 2015 TO 17. Download it immediately and use it for your business.
-
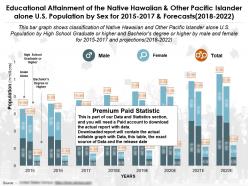 Educational attainment of native hawaiian and other pacific islander alone us population by sex for 2015-2022
Presenting this set of slides with name - Educational Attainment Of Native Hawaiian And Other Pacific Islander Alone US Population By Sex For 2015-2022. Educational Attainment of the Native Hawaiian and Other Pacific Islander alone U.S. Population by Sex for 2015 TO 2017 and Forecasts 2018 TO 2022. This is part of our Data and Statistics products selection, and you will need a Paid account to download the actual report with accurate data. Downloaded report will contain the actual editable graph with the actual data, an excel table with the actual data, the exact source of the data and the release date. This bar graph shows classification of Native Hawaiian and Other Pacific Islander alone U.S. Population by High School Graduate or higher and Bachelors degree or higher by male and female for 2015 TO 2017 and projections 2018 TO 2022. It covers topic Educational Attainment levels of Native Hawaiian and Other Pacific Islander for region USA and is for date range 2015 TO 22. Download it immediately and use it for your business.
-
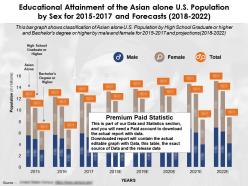 Educational attainment of the asian alone us population by sex for 2015-2022
Presenting this set of slides with name - Educational Attainment Of The Asian Alone US Population By Sex For 2015-2022. Educational Attainment of the Asian alone U.S. Population by Sex for 2015 TO 2017 and Forecasts 2018 TO 2022. This is part of our Data and Statistics products selection, and you will need a Paid account to download the actual report with accurate data. Downloaded report will contain the actual editable graph with the actual data, an excel table with the actual data, the exact source of the data and the release date. This bar graph shows classification of Asian alone U.S. Population by High School Graduate or higher and Bachelors degree or higher by male and female for 2015 TO 2017 and projections 2018 TO 2022. It covers topic Educational Attainment levels of Asian Alone by Sex for region USA and is for date range 2015 TO 22. Download it immediately and use it for your business.
-
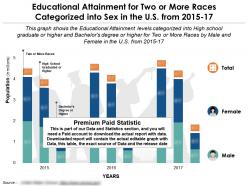 Educational attainment by sex for two or more races in the us from 2015-2017
Presenting this set of slides with name - Educational Attainment By Sex For Two Or More Races In The US From 2015-2017. Educational Attainment for Two or More Races categorized into Sex in the U.S. from 2015 TO 17. This is part of our Data and Statistics products selection, and you will need a Paid account to download the actual report with accurate data. Downloaded report will contain the actual editable graph with the actual data, an excel table with the actual data, the exact source of the data and the release date. This graph shows the Educational Attainment levels categorized into High school graduate or higher and Bachelors degree or higher for Two or More Races by Male and Female in the U.S. from 2015 TO 17. It covers topic Educational Attainment levels for Two or More Races for region USA and is for date range 2015 TO 17. Download it immediately and use it for your business.
-
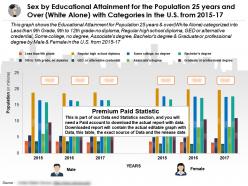 Sex by educational attainment for population 25 years and over white alone with categories in us 2015-17
Presenting this set of slides with name - Sex By Educational Attainment For Population 25 Years And Over White Alone With Categories In US 2015-17. Sex By Educational Attainment For The Population 25 Years And Over White Alone With Categories In The U.S. From 2015 TO 17. This is part of our Data and Statistics products selection, and you will need a Paid account to download the actual report with accurate data. Downloaded report will contain the actual editable graph with the actual data, an excel table with the actual data, the exact source of the data and the release date. This graph shows the Educational Attainment for Population 25 Years and Over White Alone categorized into Less than 9th Grade, 9th to 12th grade no diploma, Regular high school diploma, GED or alternative credential, Some college, no degree, Associates degree, Bachelors degree and Graduate or professional degree by Male and Female in the U.S. from 2015 TO 17. It covers topic Educational Attainment levels of White Alone with Grades for region USA and is for date range 2015 TO 17. Download it immediately and use it for your business.
-
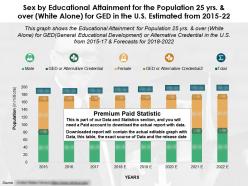 Sex by educational attainment for population 25 yrs and over white alone for ged in us 2015-22
Presenting this set of slides with name - Sex By Educational Attainment For Population 25 Yrs And Over White Alone For Ged In US 2015-22. Sex By Educational Attainment For The Population 25 Years And Over White Alone For Ged In The U.S Estimated From 2015 TO 22. This is part of our Data and Statistics products selection, and you will need a Paid account to download the actual report with accurate data. Downloaded report will contain the actual editable graph with the actual data, an excel table with the actual data, the exact source of the data and the release date. This graph shows the Educational Attainment for Population 25 Years and Over White Alone for GED General Educational Development or Alternative Credential in the U.S from 2015 TO 17 and Forecasts for 2018 TO 2022. It covers topic Educational Attainment for GED by Sex for region USA and is for date range 2015 TO 22. Download it immediately and use it for your business.
-
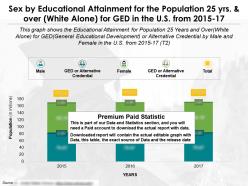 Educational achievement by sex for population 25 yrs and over white alone for ged in us from 2015-2017
Presenting this set of slides with name - Educational Achievement By Sex For Population 25 Yrs And Over White Alone For Ged In US From 2015-2017. Sex By Educational Attainment For The Population 25 Years And Over White Alone For Ged In The U.S From 2015 TO 17. This is part of our Data and Statistics products selection, and you will need a Paid account to download the actual report with accurate data. Downloaded report will contain the actual editable graph with the actual data, an excel table with the actual data, the exact source of the data and the release date. This graph shows the Educational Attainment for Population 25 Years and Over White Alone for GED General Educational Development or Alternative Credential by Male and Female in the U.S from 2015 TO 17. It covers topic Educational Attainment for GED by Sex for region USA and is for date range 2015 TO 17. Download it immediately and use it for your business.
-
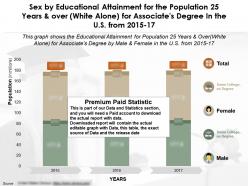 Educational attainment by sex for 25 years and over white alone for associates degree in us from 2015-2017
Presenting this set of slides with name - Educational Attainment By Sex For 25 Years And Over White Alone For Associates Degree In US From 2015-2017. Sex By Educational Attainment For The Population 25 Years And Over White Alone For Associates Degree In The U.S. From 2015 TO 17. This is part of our Data and Statistics products selection, and you will need a Paid account to download the actual report with accurate data. Downloaded report will contain the actual editable graph with the actual data, an excel table with the actual data, the exact source of the data and the release date. This graph shows the Educational Attainment for Population 25 Years and Over White Alone for Associates Degree by Male and Female in the U.S. from 2015 TO 17. It covers topic Educational Attainment of Associates Degree by Sex for region USA and is for date range 2015 TO 17. Download it immediately and use it for your business.
-
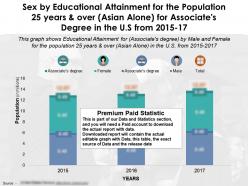 Educational attainment by sex for 25 years and over asian alone for associates degree in us from 2015-2017
Presenting this set of slides with name - Educational Attainment By Sex For 25 Years And Over Asian Alone For Associates Degree In US From 2015-2017. Sex By Educational Attainment For The Population 25 Years And Over Asian Alone For Associates Degree In The U.S From 2015 TO 17. This is part of our Data and Statistics products selection, and you will need a Paid account to download the actual report with accurate data. Downloaded report will contain the actual editable graph with the actual data, an excel table with the actual data, the exact source of the data and the release date. This graph shows Educational Attainment for Associates degree by Male and Female for the population 25 years and over Asian Alone in the U.S from 2015 TO 2017. It covers topic Educational Attainment for Associates degree by sex for region USA and is for date range 2015 TO 17. Download it immediately and use it for your business.
-
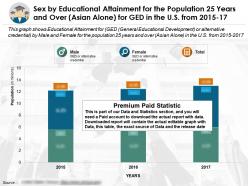 Sex by educational accomplishment for the population 25 years and over asian alone for ged in us from 2015-2017
Presenting this set of slides with name - Sex By Educational Accomplishment For The Population 25 Years And Over Asian Alone For Ged In US From 2015-2017. Sex By Educational Attainment For The Population 25 Years And Over Asian Alone For Ged In The U.S. From 2015 TO 17. This is part of our Data and Statistics products selection, and you will need a Paid account to download the actual report with accurate data. Downloaded report will contain the actual editable graph with the actual data, an excel table with the actual data, the exact source of the data and the release date. This graph shows Educational Attainment for GED General Educational Development or alternative credential by Male and Female for the population 25 years and over Asian Alone in the U.S. from 2015 TO 2017. It covers topic Educational Attainment for GED General Educational Development by sex for region USAand is for date range 2015 TO 17. Download it immediately and use it for your business.
-
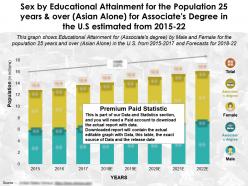 Sex by educational fulfilment 25 years and over asian alone for associates degree in us from 2015-2022
Presenting this set of slides with name - Sex By Educational Fulfilment 25 Years And Over Asian Alone For Associates Degree In US From 2015-2022. sex by educational attainment for the population 25 years and over asian alone for associates degree in the U.S estimated from 2015 TO 22. This is part of our Data and Statistics products selection, and you will need a Paid account to download the actual report with accurate data. Downloaded report will contain the actual editable graph with the actual data, an excel table with the actual data, the exact source of the data and the release date. This graph shows Educational Attainment for Associates degree by Male and Female for the population 25 years and over Asian Alone in the U.S. from 2015 TO 2017 and Forecasts for 2018 TO 22. It covers topic Educational Attainment for Associates degree for region USA and is for date range 2015 TO 22. Download it immediately and use it for your business.
-
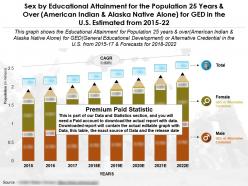 Educational achievement by sex for 25 years over american indian and alaska native alone for ged in us 2015-22
Presenting this set of slides with name - Educational Achievement By Sex For 25 Years Over American Indian And Alaska Native Alone For Ged In US 2015-22. Sex By Educational Attainment For The Population 25 Years And Over American Indian And Alaska Native Alone For Ged In The U.S Estimated From 2015 TO 22. This is part of our Data and Statistics products selection, and you will need a Paid account to download the actual report with accurate data. Downloaded report will contain the actual editable graph with the actual data, an excel table with the actual data, the exact source of the data and the release date. This graph shows the Educational Attainment for Population 25 Years and Over American Indian and Alaska Native Alone for GED General Educational Development or Alternative Credential in the U.S from 2015 TO 17 and Forecasts for 2018 TO 2022. It covers topic Educational Attainment for Alaska Native Alone for region USA and is for date range 2015 TO 22. Download it immediately and use it for your business.
-
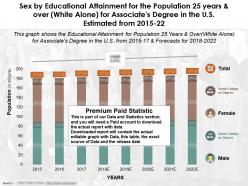 Educational attainment by sex for the 25 years and over white alone for associates degree in the us 2015-22
Presenting this set of slides with name - Educational Attainment By Sex For The 25 Years And Over White Alone For Associates Degree In The US 2015-22. Sex By Educational Attainment For The Population 25 Years And Over White Alone For Associates Degree In The U.S Estimated From 2015 TO 22. This is part of our Data and Statistics products selection, and you will need a Paid account to download the actual report with accurate data. Downloaded report will contain the actual editable graph with the actual data, an excel table with the actual data, the exact source of the data and the release date. This graph shows the Educational Attainment for Population 25 Years and Over White Alone for Associates Degree in the U.S. from 2015 TO 17 and Forecasts for 2018 TO 2022. It covers topic Educational Attainment for Associates Degree by Sex for region USA and is for date range 2015 TO 22. Download it immediately and use it for your business.
-
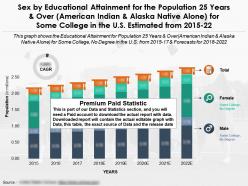 Educational fulfilment by sex for 25 years and over alaska native alone for some college in the us 2015-2022
Presenting this set of slides with name - Educational Fulfilment By Sex For 25 Years And Over Alaska Native Alone For Some College In The US 2015-2022. Sex By Educational Attainment For The Population 25 Years And Over American Indian And Alaska Native Alone For Some College In The U.S Estimated From 2015 TO 22. This is part of our Data and Statistics products selection, and you will need a Paid account to download the actual report with accurate data. Downloaded report will contain the actual editable graph with the actual data, an excel table with the actual data, the exact source of the data and the release date. This graph shows the Educational Attainment for Population 25 Years and Over American Indian and Alaska Native Alone for Some College, No Degree in the U.S from 2015 TO 17 and Forecasts for 2018 TO 2022. It covers topic Educational Attainment for Some College for region USA and is for date range 2015 TO 22. Download it immediately and use it for your business.
-
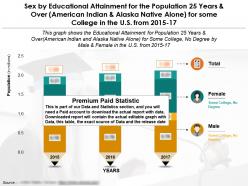 Sex by educational attainment for 25 years and over american indian for some college in the us 2015-2017
Presenting this set of slides with name - Sex By Educational Attainment For 25 Years And Over American Indian For Some College In The US 2015-2017. Sex By Educational Attainment For The Population 25 Years And Over American Indian And Alaska Native Alone For Some College In The U.S From 2015 TO 17. This is part of our Data and Statistics products selection, and you will need a Paid account to download the actual report with accurate data. Downloaded report will contain the actual editable graph with the actual data, an excel table with the actual data, the exact source of the data and the release date. This graph shows the Educational Attainment for Population 25 Years and Over American Indian and Alaska Native Alone for Some College, No Degree by Male and Female in the U.S from 2015 TO 17. It covers topic Educational Attainment for Some College by Sex for region USA and is for date range 2015 TO 17. Download it immediately and use it for your business.
-
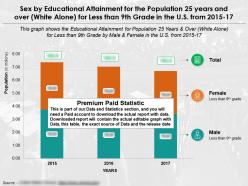 Educational fulfilment by sex for 25 years and over white alone for less than 9th grade in the us from 2015-2017
Presenting this set of slides with name - Educational Fulfilment By Sex For 25 Years And Over White Alone For Less Than 9th Grade In The US From 2015-2017. Sex By Educational Attainment For The Population 25 Years And Over White Alone For Less Than 9th Grade In The U.S From 2015 TO 17. This is part of our Data and Statistics products selection, and you will need a Paid account to download the actual report with accurate data. Downloaded report will contain the actual editable graph with the actual data, an excel table with the actual data, the exact source of the data and the release date. This graph shows the Educational Attainment for Population 25 Years and Over White Alone for Less than 9th Grade by Male and Female in the U.S from 2015 TO 17. It covers topic Educational Attainment for Less Than 9th Grade for region USA and is for date range 2015 TO 22. Download it immediately and use it for your business.
-
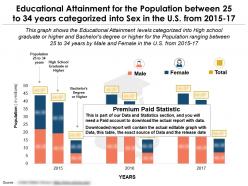 Educational attainment for the population between 25 to 34 years categorized into sex in the us from 2015-17
Presenting this set of slides with name - Educational Attainment For The Population Between 25 To 34 Years Categorized Into Sex In The US From 2015-17. Educational Attainment for the Population between 25 to 34 Years categorized into Sex in the U.S. from 2015 TO 17. This is part of our Data and Statistics products selection, and you will need a Paid account to download the actual report with accurate data. Downloaded report will contain the actual editable graph with the actual data, an excel table with the actual data, the exact source of the data and the release date. This graph shows the Educational Attainment levels categorized into High school graduate or higher and Bachelors degree or higher for the Population ranging between 25 to 34 years by Male and Female in the U.S. from 2015 TO 17. It covers topic Educational Attainment levels for 25 to 34 years by Sex for region USA and is for date range 2015 TO 17. Download it immediately and use it for your business.
-
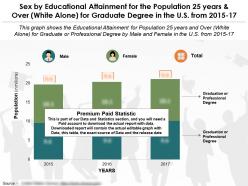 Educational competence by sex for 25 years and over white alone for graduate degree in the us from 2015-2017
Presenting this set of slides with name - Educational Competence By Sex For 25 Years And Over White Alone For Graduate Degree In The US From 2015-2017. Sex By Educational Attainment For The Population 25 Years And Over White Alone For Graduate Degree In The U.S From 2015 TO 17. This is part of our Data and Statistics products selection, and you will need a Paid account to download the actual report with accurate data. Downloaded report will contain the actual editable graph with the actual data, an excel table with the actual data, the exact source of the data and the release date. This graph shows the Educational Attainment for Population 25 Years and Over White Alone for Graduate or Professional Degree by Male and Female in the U.S from 2015 TO 17. It covers topic Educational Attainment for Graduate Degree by Sex for region USA and is for date range 2015 TO 17. Download it immediately and use it for your business.
-
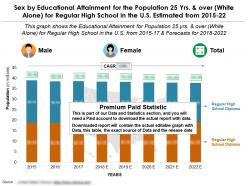 Educational proficiency by sex for 25 years over white alone for regular high school in the us from 2015-2022
Presenting this set of slides with name - Educational Proficiency By Sex For 25 Years Over White Alone For Regular High School In The US From 2015-2022. Sex By Educational Attainment For The Population 25 Years And Over White Alone For Regular High School In The U.S Estimated From 2015 TO 22. This is part of our Data and Statistics products selection, and you will need a Paid account to download the actual report with accurate data. Downloaded report will contain the actual editable graph with the actual data, an excel table with the actual data, the exact source of the data and the release date. This graph shows the Educational Attainment for Population 25 Years and Over White Alone for Regular High School in the U.S from 2015 TO 17 and Forecasts for 2018 TO 2022. It covers topic Educational Attainment for Regular High School with Forecasts for region USA and is for date range 2015 TO 22. Download it immediately and use it for your business.
-
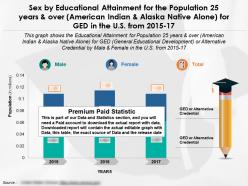 Educational attainment by sex for 25 years and over american indian alone for ged in us 2015-2017
Presenting this set of slides with name - Educational Attainment By Sex For 25 Years And Over American Indian Alone For Ged In US 2015-2017. Sex By Educational Attainment For The Population 25 Years And Over American Indian And Alaska Native Alone For Ged In The U.S From 2015 TO 17. This is part of our Data and Statistics products selection, and you will need a Paid account to download the actual report with accurate data. Downloaded report will contain the actual editable graph with the actual data, an excel table with the actual data, the exact source of the data and the release date. This Graph Shows The Educational Attainment For Population 25 Years And Over American Indian And Alaska Native Alone For GED General Educational Development Or Alternative Credential By Male And Female In The U.S From 2015 TO 17. It covers topic Educational Attainment for GED by Sex for region USA and is for date range 2015 TO 17. Download it immediately and use it for your business.
-
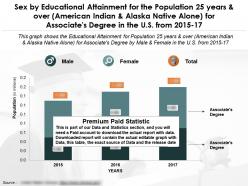 Educational fulfilment by sex for 25 years and over american indian for associates degree in us 2015-2017
Presenting this set of slides with name - Educational Fulfilment By Sex For 25 Years And Over American Indian For Associates Degree In US 2015-2017. Sex By Educational Attainment For The Population 25 Years And Over American Indian And Alaska Native Alone For Associates Degree In The U.S From 2015 TO 17. This is part of our Data and Statistics products selection, and you will need a Paid account to download the actual report with accurate data. Downloaded report will contain the actual editable graph with the actual data, an excel table with the actual data, the exact source of the data and the release date. This graph shows the Educational Attainment for Population 25 Years and Over American Indian and Alaska Native Alone for Associates Degree by Male and Female in the U.S from 2015 TO 17. It covers topic Educational Attainment for Associates Degree for region USA and is for date range 2015 TO 17. Download it immediately and use it for your business.
-
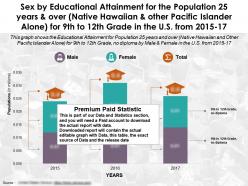 Educational achievement by sex population 25 years over native hawaiian for 9th to 12th grade in us 2015-2017
Presenting this set of slides with name - Educational Achievement By Sex Population 25 Years Over Native Hawaiian For 9th To 12th Grade In US 2015-2017. Sex By Educational Attainment For The Population 25 Years And Over Native Hawaiian And Other Pacific Islander Alone For 9th To 12th Grade In The U.S From 2015 TO 17. This is part of our Data and Statistics products selection, and you will need a Paid account to download the actual report with accurate data. Downloaded report will contain the actual editable graph with the actual data, an excel table with the actual data, the exact source of the data and the release date. This graph shows the Educational Attainment for Population 25 Years and Over Native Hawaiian and Other Pacific Islander Alone for 9th to 12th Grade no diploma by Male and Female in the U.S from 2015 TO 17. It covers topic Educational Attainment for 9th to 12th Grade for region USA and is for date range 2015 TO 17. Download it immediately and use it for your business.
-
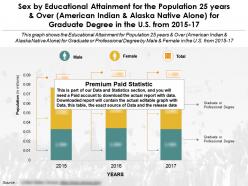 Educational attainment by sex 25 years and over alaska native alone for graduate degree in us from 2015-2017
Presenting this set of slides with name - Educational Attainment By Sex 25 Years And Over Alaska Native Alone For Graduate Degree In US From 2015-2017. Sex By Educational Attainment For The Population 25 Years And Over American Indian And Alaska Native Alone For Graduate Degree In The U.S From 2015 TO 17. This is part of our Data and Statistics products selection, and you will need a Paid account to download the actual report with accurate data. Downloaded report will contain the actual editable graph with the actual data, an excel table with the actual data, the exact source of the data and the release date. This graph shows the Educational Attainment for Population 25 Years and Over American Indian and Alaska Native Alone for Graduate or Professional Degree by Male and Female in the U.S from 2015 TO 17 . It covers topic Educational Attainment for Graduate or Professional Degree for region USA and is for date range 2015 TO 17. Download it immediately and use it for your business.
-
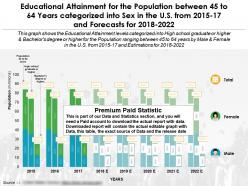 Educational attainment by sex for the population 45 to 64 years categorized in the us from 2015-2022
Presenting this set of slides with name - Educational Attainment By Sex For The Population 45 To 64 Years Categorized In The US From 2015-2022. Educational Attainment for the Population between 45 to 64 Years categorized into Sex in the U.S from 2015 TO 17 and Forecasts for 2018 TO 2022. This is part of our Data and Statistics products selection, and you will need a Paid account to download the actual report with accurate data. Downloaded report will contain the actual editable graph with the actual data, an excel table with the actual data, the exact source of the data and the release date. This graph shows the Educational Attainment levels categorized into High school graduate or higher and Bachelors degree or higher for the Population ranging between 45 to 64 years by Male and Female in the U.S from 2015 TO 17 and Estimations for 2018-2022. It covers topic Educational Attainment levels by Sex for region USA and is for date range 2015 TO 22. Download it immediately and use it for your business.
-
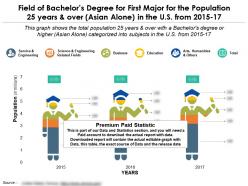 Field of bachelors degree for the population 25 years and over asian alone in the us from 2015-2017
Presenting this set of slides with name - Field Of Bachelors Degree For The Population 25 Years And Over Asian Alone In The US From 2015-2017. Field Of Bachelors Degree For First Major For The Population 25 Years And Over Asian Alone In The U.S From 2015 TO 17. This is part of our Data and Statistics products selection, and you will need a Paid account to download the actual report with accurate data. Downloaded report will contain the actual editable graph with the actual data, an excel table with the actual data, the exact source of the data and the release date. This graph shows the total population 25 years and over with a Bachelors degree or higher Asian Alone categorized into subjects in the U.S from 2015 TO 17. It covers topic Field of Bachelors Degree for First Major for Asian Alone for region USA and is for date range 2015 TO 17. Download it immediately and use it for your business.
-
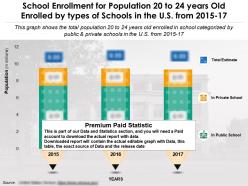 School enrollment for population 20 to 24 years old enrolled by types of schools in the us 2015-17
Presenting this set of slides with name - School Enrollment For Population 20 To 24 Years Old Enrolled By Types Of Schools In The US 2015-17. School Enrollment For Population 20 To 24 Years Old Enrolled By Types Of Schools In The U.S From 2015 TO 17. This is part of our Data and Statistics products selection, and you will need a Paid account to download the actual report with accurate data. Downloaded report will contain the actual editable graph with the actual data, an excel table with the actual data, the exact source of the data and the release date. This graph shows the total population 20 to 24 years old enrolled in school categorized by public and private schools in the U.S from 2015 TO 17. It covers topic School Enrollment for population 20 to 24 years old for region USA and is for date range 2015 TO 17. Download it immediately and use it for your business.
-
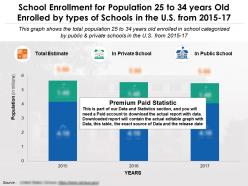 School enrollment for population 25 to 34 years old enrolled by types of schools in us 2015-17
Presenting this set of slides with name - School Enrollment For Population 25 To 34 Years Old Enrolled By Types Of Schools In US 2015-17. School Enrollment For Population 25 To 34 Years Old Enrolled By Types Of Schools In The U.S From 2015 TO 17. This is part of our Data and Statistics products selection, and you will need a Paid account to download the actual report with accurate data. Downloaded report will contain the actual editable graph with the actual data, an excel table with the actual data, the exact source of the data and the release date. This graph shows the total population 25 to 34 years old enrolled in school categorized by public and private schools in the U.S from 2015 TO 17. It covers topic School Enrollment for population 25 to 34 years old for region USA and is for date range 2015 TO 17. Download it immediately and use it for your business.
-
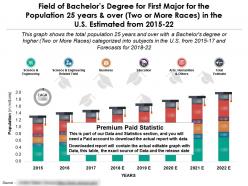 Field of bachelors degree for 25 years for first major and over for two or more races in us from 2015-2022
Presenting this set of slides with name - Field Of Bachelors Degree For 25 Years For First Major And Over For Two Or More Races In US From 2015-2022. Field Of Bachelors Degree For First Major For The Population 25 Years And Over Two Or More Races In The U.S Estimated From 2015 TO 22. This is part of our Data and Statistics products selection, and you will need a Paid account to download the actual report with accurate data. Downloaded report will contain the actual editable graph with the actual data, an excel table with the actual data, the exact source of the data and the release date. This Graph Shows The Total Population 25 Years And Over With A Bachelors Degree Or Higher Two Or More Races Categorized Into Subjects In The U.S From 2015 TO 17 And Forecasts For 2018 TO 22. It covers topic Field of Bachelors Degree for First Major for Two or More Races for region USA and is for date range 2015 TO 22. Download it immediately and use it for your business.
-
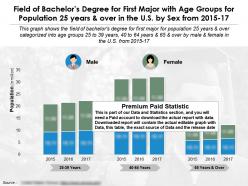 Field of bachelors degree for first major with age groups for population 25 years and over in us by sex 2015-17
Presenting this set of slides with name - Field Of Bachelors Degree For First Major With Age Groups For Population 25 Years And Over In US By Sex 2015-17. Field Of Bachelors Degree For First Major With Age Groups For Population 25 Years And Over In The U.S By Sex From 2015 TO 17. This is part of our Data and Statistics products selection, and you will need a Paid account to download the actual report with accurate data. Downloaded report will contain the actual editable graph with the actual data, an excel table with the actual data, the exact source of the data and the release date. This graph shows the Field of Bachelors Degree for First Major for population 25 years and over categorized into age groups 25 to 39 years, 40 to 64 years and 65 and over by male and female in the U.S from 2015 to 17 . It covers topic Bachelors Degree for First Major with Age for region USA and is for date range 2015 to 17. Download it immediately and use it for your business.
-
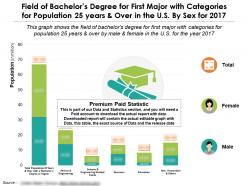 Field of bachelors degree for first major with categories for population 25 years and over in us by sex for 2017
Presenting this set of slides with name - Field Of Bachelors Degree For First Major With Categories For Population 25 Years And Over In US By Sex For 2017. Field Of Bachelors Degree For First Major With Categories For Population 25 Years And Over In The U.S By Sex For 2017. This is part of our Data and Statistics products selection, and you will need a Paid account to download the actual report with accurate data. Downloaded report will contain the actual editable graph with the actual data, an excel table with the actual data, the exact source of the data and the release date.This graph shows the Field of Bachelors Degree for First Major with categories for Population 25 Years and Over by Male and Female in the U.S for the Year 2017. It covers topic Bachelors Degree for First Major with Categories for region USA and is for date range 2017. Download it immediately and use it for your business.
-
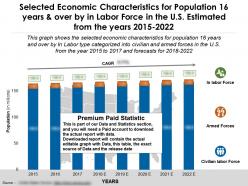 Selected economic characteristics for population 16 years and over by in labor force in us years 2015-2022
Presenting this set of slides with name - Selected Economic Characteristics For Population 16 Years And Over By In Labor Force In US Years 2015-2022. Selected Economic Characteristics For Population 16 Years And Over By In Labor Force In The U.S Estimated From The Years 2015 TO 2022. This is part of our Data and Statistics products selection, and you will need a Paid account to download the actual report with accurate data. Downloaded report will contain the actual editable graph with the actual data, an excel table with the actual data, the exact source of the data and the release date.This graph shows the selected economic characterstics for population 16 years and over by In Labor Type categorized into civilian and armed forces in the U.S from the year 2015 to 2017 and forecasts for 2018 TO 2022 . It covers topic Selected Economic Characteristics by In Labor Force for region USA and is for date range 2015 TO 22. Download it immediately and use it for your business.
-
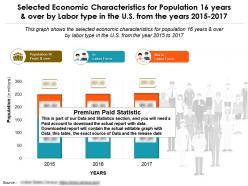 Selected economic characteristics for 16 years and over by labor type in us from 2015-17
Presenting this set of slides with name - Selected Economic Characteristics For 16 Years And Over By Labor Type In US From 2015-17. Selected Economic Characteristics For Population 16 Years And Over By Labor Type In The U.S From The Years 2015 TO 2017. This is part of our Data and Statistics products selection, and you will need a Paid account to download the actual report with accurate data. Downloaded report will contain the actual editable graph with the actual data, an excel table with the actual data, the exact source of the data and the release date. This graph shows the selected economic characterstics for population 16 years and over by labor type in the U.S from the year 2015 to 2017. It covers topic Selected economic Characteristics by labor type for region USA and is for date range 2015 TO 17. Download it immediately and use it for your business.
-
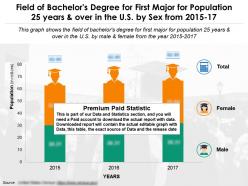 Field of bachelors degree for first major in us for 25 years and over by sex from 2015-2017
Presenting this set of slides with name - Field Of Bachelors Degree For First Major In US For 25 Years And Over By Sex From 2015-2017. Field Of Bachelors Degree For First Major For Population 25 Years And Over In The U.S By Sex From 2015 TO 17. This is part of our Data and Statistics products selection, and you will need a Paid account to download the actual report with accurate data. Downloaded report will contain the actual editable graph with the actual data, an excel table with the actual data, the exact source of the data and the release date. This graph shows the Field of Bachelors Degree for First Major for population 25 Years and Over in the U.S by Male and Female from the year 2015 TO 2017. It covers topic Field of Bachelors Degree for First Major for region USA and is for date range 2015 TO 17. Download it immediately and use it for your business.
-
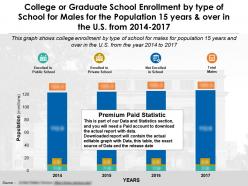 College or graduate school enrollment by type of school for males population 15 years and over in us 2014-2017
Presenting this set of slides with name - College Or Graduate School Enrollment By Type Of School For Males Population 15 Years And Over In US 2014-2017. College Or Graduate School Enrollment By Type Of School For Males For The Population 15 Years And Over In The U.S From 2014 TO 2017. This is part of our Data and Statistics products selection, and you will need a Paid account to download the actual report with accurate data. Downloaded report will contain the actual editable graph with the actual data, an excel table with the actual data, the exact source of the data and the release date. This table shows college enrollment by type of school for males for population 15 years and over in the U.S from the year 2014 to 2017. It covers topic School Enrollment by School type for males for region USA and is for date range 2014 TO 17 . Download it immediately and use it for your business.
-
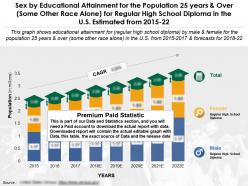 Educational attainment by sex for 25 years and over some other race alone regular high school diploma us 2015-22
Presenting this set of slides with name - Educational Attainment By Sex For 25 Years And Over Some Other Race Alone Regular High School Diploma US 2015-22. Sex By Educational Attainment For The Population 25 Years And Over Some Other Race Alone For Regular High School Diploma In The U.S Estimated From 2015 TO 22. This is part of our Data and Statistics products selection, and you will need a Paid account to download the actual report with accurate data. Downloaded report will contain the actual editable graph with the actual data, an excel table with the actual data, the exact source of the data and the release date. This graph shows Educational Attainment for Regular high school diploma by Male and Female for the population 25 years and over Some Other Race Alone in the U.S from 2015 TO 2017 and Forecasts for 2018 TO 22. It covers topic Educational Attainment for Regular high school diploma for region USA and is for date range 2015 TO 22. Download it immediately and use it for your business.
-
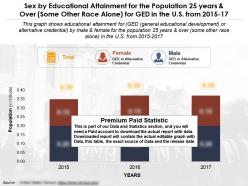 Sex by educational attainment for population 25 years and over some other race alone for ged in us 2015-17
Presenting this set of slides with name - Sex By Educational Attainment For Population 25 Years And Over Some Other Race Alone For Ged In US 2015-17. Sex By Educational Attainment For The Population 25 Years And Over Some Other Race Alone For Ged In The U.S From 2015 TO 17. This is part of our Data and Statistics products selection, and you will need a Paid account to download the actual report with accurate data. Downloaded report will contain the actual editable graph with the actual data, an excel table with the actual data, the exact source of the data and the release date. This graph shows Educational Attainment for GED General Educational Development or alternative credential by Male and Female for the population 25 years and over Some Other Race Alone in the U.S from 2015 TO 2017. It covers topic Educational Attainment for GED General Educational Development by sex for region USA and is for date range 2015 TO 17. Download it immediately and use it for your business.
-
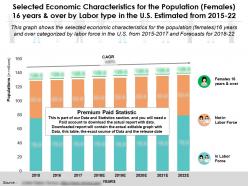 Selected economic characteristics for females 16 years and over by labor type in us 2015-2022
Presenting this set of slides with name - Selected Economic Characteristics For Females 16 Years And Over By Labor Type In US 2015-2022. Selected Economic Characteristics For The Population Females 16 Years And Over By Labor Type In The U.S Estimated From 2015 TO 22. This is part of our Data and Statistics products selection, and you will need a Paid account to download the actual report with accurate data. Downloaded report will contain the actual editable graph with the actual data, an excel table with the actual data, the exact source of the data and the release date. This graph shows the selected economic characteristics for the population females 16 years and over categorized by labor force in the U.S from 2015 TO 2017 and Forecasts for 2018 TO 22. It covers topic Selected economic characteristics for females by labor type for region USA and is for date range 2015 TO 22. Download it immediately and use it for your business.
-
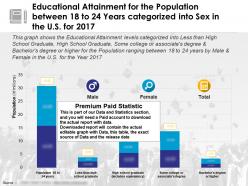 Educational attainment for population between 18 to 24 years categorized into sex us for 2017
Presenting this set of slides with name - Educational Attainment For Population Between 18 To 24 Years Categorized Into Sex US For 2017. Educational Attainment for the Population between 18 to 24 Years categorized into Sex in the U.S for 2017. This is part of our Data and Statistics products selection, and you will need a Paid account to download the actual report with accurate data. Downloaded report will contain the actual editable graph with the actual data, an excel table with the actual data, the exact source of the data and the release date. This graph shows the Educational Attainment levels categorized into Less than High School Graduate, High School Graduate, Some college or associates degree and Bachelors degree or higher for the Population ranging between 18 to 24 years by Male and Female in the U.S for the Year 2017. It covers topic Educational Attainment levels by Sex for region USA and is for date range 2017. Download it immediately and use it for your business.
-
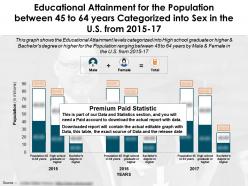 Educational attainment for population between 45 to 64 years categorized into sex us 2015-17
Presenting this set of slides with name - Educational Attainment For Population Between 45 To 64 Years Categorized Into Sex US 2015-17. Educational Attainment for the Population between 45 to 64 Years categorized into Sex in the U.S from 2015 to 17. This is part of our Data and Statistics products selection, and you will need a Paid account to download the actual report with accurate data. Downloaded report will contain the actual editable graph with the actual data, an excel table with the actual data, the exact source of the data and the release date. This graph shows the Educational Attainment levels categorized into High school graduate or higher and Bachelors degree or higher for the Population ranging between 45 to 64 years by Male and Female in the U.S from 2015 to 17. It covers topic Educational Attainment levels by Sex for 45 to 64 Years for region USA and is for date range 2015 to 17. Download it immediately and use it for your business.
-
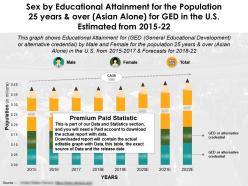 Educational attainment for 25 years and over asian alone for ged in us 2015-22
Presenting this set of slides with name - Educational Attainment For 25 Years And Over Asian Alone For Ged In US 2015-22. Sex By Educational Attainment For The Population 25 Years And Over Asian Alone For Ged In The U.S Estimated From 2015 TO 22. This is part of our Data and Statistics products selection, and you will need a Paid account to download the actual report with accurate data. Downloaded report will contain the actual editable graph with the actual data, an excel table with the actual data, the exact source of the data and the release date. This graph shows Educational Attainment for GED General Educational Development or alternative credential by Male and Female for the population 25 years and over Asian Alone in the U.S from 2015 TO 2017 and Forecasts for 2018 TO 22. It covers topic Educational Attainment for GED General Educational Development for region USA and is for date range 2015 TO 22. Download it immediately and use it for your business.
-
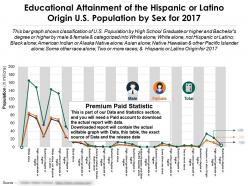 Educational attainment by sex of the hispanic or latino origin us population for 2017
Presenting this set of slides with name - Educational Attainment By Sex Of The Hispanic Or Latino Origin US Population For 2017. Educational Attainment of the Hispanic or Latino Origin U.S Population by Sex for 2017. This is part of our Data and Statistics products selection, and you will need a Paid account to download the actual report with accurate data. Downloaded report will contain the actual editable graph with the actual data, an excel table with the actual data, the exact source of the data and the release date. This bar graph shows classification of U.S Population by High School Graduate or higher and Bachelors degree or higher by male and female and categorized into White alone White alone, not Hispanic or Latino Black alone American Indian or Alaska Native alone Asian alone Native Hawaiian and Other Pacific Islander alone Some other race alone Two or more races and Hispanic or Latino Origin for 2017. It covers topic Educational Attainment levels for Hispanic or Latino Origin for region USA and is for date range 2017. Download it immediately and use it for your business.
-
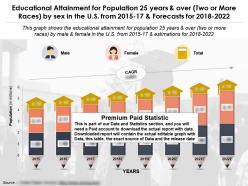 Educational attainment for population 25 years and over two or more races by sex us 2015-22
Presenting this set of slides with name - Educational Attainment For Population 25 Years And Over Two Or More Races By Sex US 2015-22. Educational Attainment for Population 25 Years and Over Two or More Races by sex in the U.S from 2015 to 17 and Forecasts for 2018 to 2022. This is part of our Data and Statistics products selection, and you will need a Paid account to download the actual report with accurate data. Downloaded report will contain the actual editable graph with the actual data, an excel table with the actual data, the exact source of the data and the release date. This graph shows the Educational Attainment for Population 25 years and Over Two or More Races by male and female in the U.S from 2015 to 17 and estimations for 2018 to 2022. It covers topic Educational Attainment for Two or More Races by Sex for region USA and is for date range 2015 to 22. Download it immediately and use it for your business.
-
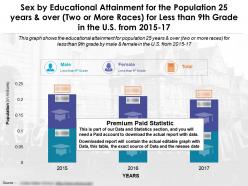 Sex by educational attainment population 25 years and over two or more races less than 9th grade us 2015-17
Presenting this set of slides with name - Sex By Educational Attainment Population 25 Years And Over Two Or More Races Less Than 9th Grade US 2015-17. Sex By Educational Attainment For The Population 25 Years And Over Two Or More Races For Less Than 9th Grade In The U.S From 2015 to 17. This is part of our Data and Statistics products selection, and you will need a Paid account to download the actual report with accurate data. Downloaded report will contain the actual editable graph with the actual data, an excel table with the actual data, the exact source of the data and the release date. This Graph Shows The Educational Attainment For Population 25 Years And Over Two Or More Races For Less Than 9th Grade By Male And Female In The U.S From 2015 To 17. It covers topic Educational Attainment for Less than 9th grade by sex for region USA and is for date range 2015 to 17. Download it immediately and use it for your business.
-
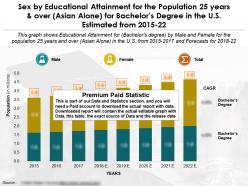 Sex by educational attainment for 25 years over asian alone for bachelors degree us 2015-2022
Presenting this set of slides with name - Sex By Educational Attainment For 25 Years Over Asian Alone For Bachelors Degree US 2015-2022. Sex By Educational Attainment For The Population 25 Years And Over Asian Alone For Bachelors Degree In The U.S Estimated From 2015 TO 22. This is part of our Data and Statistics products selection, and you will need a Paid account to download the actual report with accurate data. Downloaded report will contain the actual editable graph with the actual data, an excel table with the actual data, the exact source of the data and the release date. This graph shows Educational Attainment for Bachelors degree by Male and Female for the population 25 years and over Asian Alone in the U.S from 2015 TO 2017 and Forecasts for 2018 TO 22. It covers topic Educational Attainment for Bachelors degree for region USA and is for date range 2015 TO 22. Download it immediately and use it for your business.
-
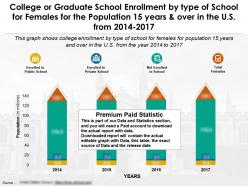 College or graduate school enrollment by type of school for females for 15 years and over in the us 2014-17
Presenting this set of slides with name - College Or Graduate School Enrollment By Type Of School For Females For 15 Years And Over In The US 2014-17. College Or Graduate School Enrollment By Type Of School For Females For The Population 15 Years And Over In The U.S From 2014 TO 2017. This is part of our Data and Statistics products selection, and you will need a Paid account to download the actual report with accurate data. Downloaded report will contain the actual editable graph with the actual data, an excel table with the actual data, the exact source of the data and the release date. This table shows college enrollment by type of school for females for population 15 years and over in the U.S from the year 2014 TO 2017 . It covers topic School Enrollment by School Type for Females for region USA and is for date range 2014 TO 17. Download it immediately and use it for your business.
-
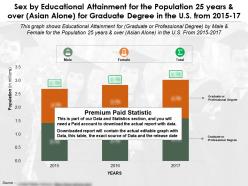 Sex by educational attainment for 25 years and over for graduate degree us 2015-2017
Presenting this set of slides with name - Sex By Educational Attainment For 25 Years And Over For Graduate Degree US 2015-2017. Sex By Educational Attainment For The Population 25 Years And Over Asian Alone For Graduate Degree In The U.S From 2015 TO 17. This is part of our Data and Statistics products selection, and you will need a Paid account to download the actual report with accurate data. Downloaded report will contain the actual editable graph with the actual data, an excel table with the actual data, the exact source of the data and the release date.This graph shows Educational Attainment for Graduate or professional degree by Male and Female for the population 25 years and over Asian Alone in the U.S from 2015 TO 2017. It covers topic Educational Attainment for Graduate or professional degree by sex for region USA and is for date range 2015 TO 17. Download it immediately and use it for your business.
-
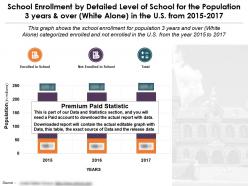 School enrollment by level of school for 3 years and over white alone us 2015-17
Presenting this set of slides with name - School Enrollment By Level Of School For 3 Years And Over White Alone US 2015-17. School Enrollment By Detailed Level Of School For The Population 3 Years And Over White Alone In The U.S From 2015 to 2017. This is part of our Data and Statistics products selection, and you will need a Paid account to download the actual report with accurate data. Downloaded report will contain the actual editable graph with the actual data, an excel table with the actual data, the exact source of the data and the release date. This Graph Shows The School Enrollment For Population 3 Years And Over White Alone Categorized Enrolled And Not Enrolled In The U.S From The Year 2015 To 2017. It covers topic School Enrollment for 3 years and over for region USA and is for date range 2015 to 17. Download it immediately and use it for your business.
-
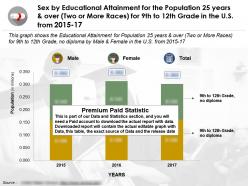 Sex by educational attainment for 25 years and over two or more races for 9th to 12th grade us 2015-2017
Presenting this set of slides with name - Sex By Educational Attainment For 25 Years And Over Two Or More Races For 9th To 12th Grade US 2015-2017. Sex By Educational Attainment For The Population 25 Years And Over Two Or More Races For 9th To 12th Grade In The U.S From 2015 to 17. This is part of our Data and Statistics products selection, and you will need a Paid account to download the actual report with accurate data. Downloaded report will contain the actual editable graph with the actual data, an excel table with the actual data, the exact source of the data and the release date. This graph shows the Educational Attainment for Population 25 Years and Over Two or More Races for 9th to 12th Grade, no diploma by Male and Female in the U.S from 2015 to 17. It covers topic Educational Attainment for 9th to 12th Grade by Sex for region USA and is for date range 2015 to 17. Download it immediately and use it for your business.
-
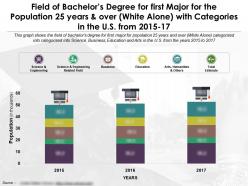 Field of bachelors degree for first major 25 years and over white alone in us 2015-17
Presenting this set of slides with name - Field Of Bachelors Degree For First Major 25 Years And Over White Alone In US 2015-17. Field Of Bachelors Degree For First Major For The Population 25 Years And Over White Alone With Categories In The U.S From 2015 To 17. This is part of our Data and Statistics products selection, and you will need a Paid account to download the actual report with accurate data. Downloaded report will contain the actual editable graph with the actual data, an excel table with the actual data, the exact source of the data and the release date. This graph shows the field of bachelors degree for first major for population 25 years and over White Alone categorized into categorized into Science, Business, Education and Arts in the U.S from the years 2015 to 2017. It covers topic Field of Bachelors Degree for White Alone for region USA and is for date range 2015 to 17. Download it immediately and use it for your business.
-
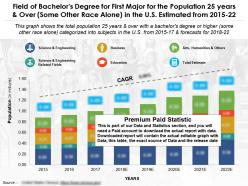 Field of bachelors degree first major 25 years and over some other race us 2015-22
Presenting this set of slides with name - Field Of Bachelors Degree First Major 25 Years And Over Some Other Race US 2015-22. Field Of Bachelors Degree For First Major For The Population 25 Years And Over Some Other Race Alone In The U.S Estimated From 2015 TO 22. This is part of our Data and Statistics products selection, and you will need a Paid account to download the actual report with accurate data. Downloaded report will contain the actual editable graph with the actual data, an excel table with the actual data, the exact source of the data and the release date.This graph shows the total population 25 years and over with a Bachelors degree or higher Some Other Race Alone categorized into subjects in the U.S from 2015 TO 17 and Forecasts for 2018 TO 22. It covers topic Field of Bachelors Degree for First Major for Some Other Race Alone for region USA and is for date range 2015 TO 22. Download it immediately and use it for your business.
-
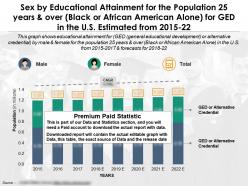 Sex by educational attainment for population 25 years and over black or african american alone ged us 2015-22
Presenting this set of slides with name - Sex By Educational Attainment For Population 25 Years And Over Black Or African American Alone Ged US 2015-22. Sex By Educational Attainment For The Population 25 Years And Over Black Or African American Alone For Ged In The U.S Estimated From 2015 to 22. This is part of our Data and Statistics products selection, and you will need a Paid account to download the actual report with accurate data. Downloaded report will contain the actual editable graph with the actual data, an excel table with the actual data, the exact source of the data and the release date. This Graph Shows Educational Attainment For GED General Educational Development Or Alternative Credential By Male And Female For The Population 25 Years And Over BLACK OR AFRICAN AMERICAN ALONE In The U.S From 2015 to 2017 And Forecasts For 2018 to 22. It covers topic Educational Attainment for GED General Educational Development for region USA and is for date range 2015 to 22. Download it immediately and use it for your business.
-
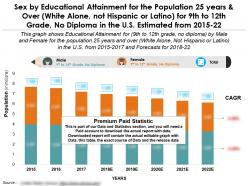 Sex by educational attainment for 25 years and over white latino for 9th to 12th grade no diploma us 2015-2022
Presenting this set of slides with name - Sex By Educational Attainment For 25 Years And Over White Latino For 9th To 12th Grade No Diploma US 2015-2022. Sex By Educational Attainment For The Population 25 Years And Over White Alone Not Hispanic Or Latino For 9th To 12th Grade No Diploma In The U.S Estimated From 2015 TO 22. This is part of our Data and Statistics products selection, and you will need a Paid account to download the actual report with accurate data. Downloaded report will contain the actual editable graph with the actual data, an excel table with the actual data, the exact source of the data and the release date. This graph shows Educational Attainment for 9th to 12th grade no diploma by Male and Female for the population 25 years and over White Alone Not Hispanic Or Latino in the U.S from 2015 TO 2017 and Forecasts for 2018 TO 22. It covers topic Educational Attainment for 9th to 12th grade no diploma for region USA and is for date range 2015 TO 22. Download it immediately and use it for your business.
-
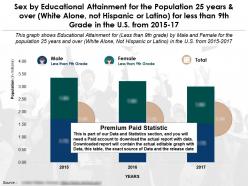 Education fulfilment by sex 25 years and over white alone not hispanic latino less by 9th grade us 2015-17
Presenting this set of slides with name - Education Fulfilment By Sex 25 Years And Over White Alone Not Hispanic Latino Less By 9th Grade US 2015-17. Sex By Educational Attainment For The Population 25 Years And Over White Alone Not Hispanic Or Latino For Less Than 9th Grade In The U.S From 2015 TO 17. This is part of our Data and Statistics products selection, and you will need a Paid account to download the actual report with accurate data. Downloaded report will contain the actual editable graph with the actual data, an excel table with the actual data, the exact source of the data and the release date. This graph shows Educational Attainment for Less than 9th grade by Male and Female for the population 25 years and over White Alone Not Hispanic Or Latino in the U.S from 2015 TO 2017. It covers topic Educational Attainment for Less than 9th grade by sex for region USA and is for date range 2015 TO 17. Download it immediately and use it for your business.
-
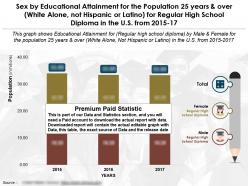 Educational completion by sex for 25 years over white alone not hispanic for high school diploma us 2015-2017
Presenting this set of slides with name - Educational Completion By Sex For 25 Years Over White Alone Not Hispanic For High School Diploma US 2015-2017. Sex By Educational Attainment For The Population 25 Years And Over White Alone Not Hispanic Or Latino For Regular High School Diploma In The U.S From 2015 TO 17. This is part of our Data and Statistics products selection, and you will need a Paid account to download the actual report with accurate data. Downloaded report will contain the actual editable graph with the actual data, an excel table with the actual data, the exact source of the data and the release date. This graph shows Educational Attainment for Regular high school diploma by Male and Female for the population 25 years and over White Alone Not Hispanic Or Latino in the U.S from 2015 TO 2017. It covers topic Educational Attainment for Regular high school diploma by sex for region USA and is for date range 2015 TO 17. Download it immediately and use it for your business.
-
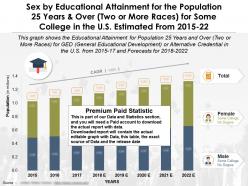 Educational achievement by sex 25 years and over two or more races some college us 2015-2022
Presenting this set of slides with name - Educational Achievement By Sex 25 Years And Over Two Or More Races Some College US 2015-2022. Sex By Educational Attainment For The Population 25 Years And Over Two Or More Races For Some College In The U.S Estimated From 2015 to 22. This is part of our Data and Statistics products selection, and you will need a Paid account to download the actual report with accurate data. Downloaded report will contain the actual editable graph with the actual data, an excel table with the actual data, the exact source of the data and the release date. This Graph Shows The Educational Attainment For Population 25 Years And Over Two Or More Races For Some College No Degree In The U.S From 2015 to 17 And Forecasts For 2018 to 2022. It covers topic Educational Attainment for Some College by Sex for region USA and is for date range 2015 to 22. Download it immediately and use it for your business.


