Data flow funnel diagram five input and one output
People get emotive over trivial issues. Restore balance with our Data Flow Funnel Diagram Five Input And One Output.
People get emotive over trivial issues. Restore balance with our Data Flow Funnel Diagram Five Input And One Output.
- Google Slides is a new FREE Presentation software from Google.
- All our content is 100% compatible with Google Slides.
- Just download our designs, and upload them to Google Slides and they will work automatically.
- Amaze your audience with SlideTeam and Google Slides.
-
Want Changes to This PPT Slide? Check out our Presentation Design Services
- WideScreen Aspect ratio is becoming a very popular format. When you download this product, the downloaded ZIP will contain this product in both standard and widescreen format.
-

- Some older products that we have may only be in standard format, but they can easily be converted to widescreen.
- To do this, please open the SlideTeam product in Powerpoint, and go to
- Design ( On the top bar) -> Page Setup -> and select "On-screen Show (16:9)” in the drop down for "Slides Sized for".
- The slide or theme will change to widescreen, and all graphics will adjust automatically. You can similarly convert our content to any other desired screen aspect ratio.
Compatible With Google Slides

Get This In WideScreen
You must be logged in to download this presentation.
PowerPoint presentation slides
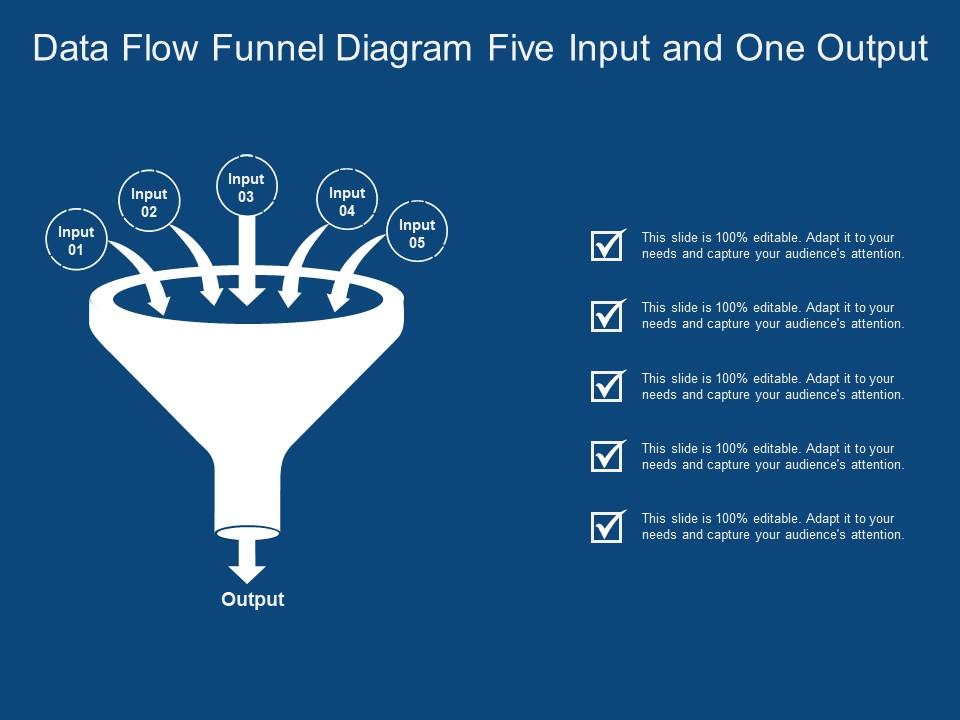
Presenting this set of slides with name - Data Flow Funnel Diagram Five Input And One Output. This is a five stage process. The stages in this process are Data Flow, Data Management, Big Data.
People who downloaded this PowerPoint presentation also viewed the following :
Content of this Powerpoint Presentation
Description:
The image features a PowerPoint slide titled "Data Flow Funnel Diagram Five Input and One Output," which visually represents a funneling process where multiple inputs converge into a single output. This kind of diagram is used to illustrate the consolidation or filtering process where diverse data or information sources are streamlined into one focused outcome or result.
The slide comprises:
1. A funnel graphic with five arrows pointing downwards labeled "Input 01" to "Input 05," indicating various sources of data or information.
2. A single arrow labeled "Output" at the narrow end of the funnel, indicating the result of combining or filtering the inputs.
3. Text boxes adjacent to each input and the output for adding specific details.
Use Cases:
This type of visual is versatile and can be used across various industries for strategic presentations:
1. Marketing:
Use: To illustrate customer segmentation leading to a targeted marketing strategy.
Presenter: Marketing Director.
Audience: Marketing Team, Stakeholders.
2. Data Analytics:
Use: Demonstrating how multiple data sources are synthesized into actionable insights.
Presenter: Data Analyst.
Audience: Data Science Team, Business Analysts.
3. Finance:
Use: Showing how different financial inputs are factored into fiscal decision-making.
Presenter: Chief Financial Officer.
Audience: Finance Department, Investors.
4. Operations Management:
Use: Explaining the process of streamlining operations from various inputs to optimize workflow.
Presenter: Operations Manager.
Audience: Operations Team, Department Heads.
5. Supply Chain:
Use: Visualizing how multiple logistics inputs contribute to a single supply chain outcome.
Presenter: Supply Chain Specialist.
Audience: Logistics Partners, Supply Chain Team.
6. IT Services:
Use: Displaying how various technology inputs lead to a unified IT infrastructure.
Presenter: IT Project Manager.
Audience: IT Department, Technology Consultants.
7. Healthcare:
Use: Mapping out patient intake information leading to a singular care plan.
Presenter: Healthcare Administrator.
Audience: Medical Staff, Healthcare Providers.
Data flow funnel diagram five input and one output with all 5 slides:
Join the hunt for appropriate answers with our Data Flow Funnel Diagram Five Input And One Output. Get involved in handling the issue.
-
Much better than the original! Thanks for the quick turnaround.
-
Excellent products for quick understanding.


