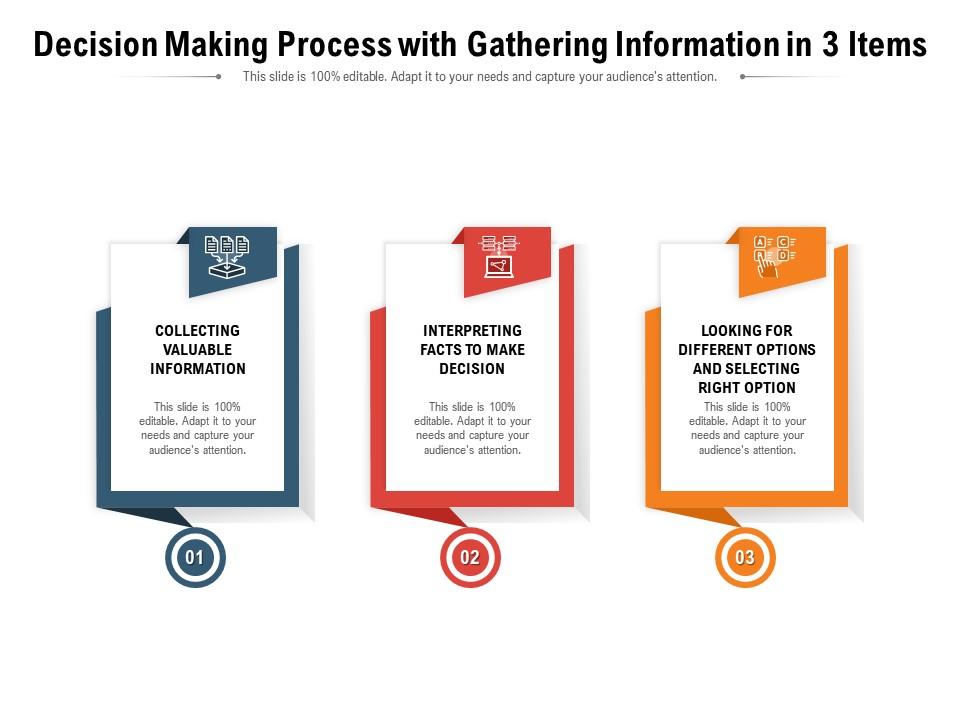
Decision making process with gathering information in 3 items
Try Before you Buy Download Free Sample Product
Audience
Editable
of Time
Our Decision Making Process With Gathering Information In 3 Items are topically designed to provide an attractive backdrop to any subject. Use them to look like a presentation pro.
People who downloaded this PowerPoint presentation also viewed the following :
Decision making process with gathering information in 3 items with all 2 slides:
Use our Decision Making Process With Gathering Information In 3 Items to effectively help you save your valuable time. They are readymade to fit into any presentation structure.
FAQs for Decision making process with gathering information
The key stages in the decision-making process include problem identification, information gathering, alternative generation, evaluation and analysis, and implementation with monitoring. Templates streamline these stages by providing structured frameworks for data collection, standardized criteria for option assessment, and systematic tracking mechanisms, with many organizations finding that templated approaches reduce decision time by up to 40% while enhancing consistency and accountability across teams.
Understanding cognitive biases enhances decision-making strategy by identifying mental shortcuts that lead to errors, implementing structured evaluation processes, and creating systematic checkpoints for critical choices. Through bias awareness training, organizations streamline strategic planning, minimize costly misjudgments, and improve risk assessment accuracy, with many financial institutions finding that bias-conscious frameworks ultimately deliver more objective outcomes and competitive advantage.
Visual presentation tools improve group decision-making by centralizing information, enabling real-time collaboration, simplifying complex data through charts and diagrams, and creating shared reference points for discussion. These tools streamline consensus-building by allowing teams to visualize options simultaneously, track decision criteria transparently, and document outcomes effectively, with many organizations finding that visual formats reduce meeting times while enhancing strategic alignment.
Data analysis elevates decision-making quality by transforming raw information into actionable insights, identifying patterns and trends, reducing uncertainty, and providing evidence-based foundations for strategic choices. Through predictive analytics and real-time dashboards, organizations in healthcare, finance, and retail can minimize risks, optimize resource allocation, and accelerate response times, ultimately delivering competitive advantages.
Templates help align team perspectives by standardizing information gathering, establishing consistent evaluation criteria, ensuring all stakeholders contribute relevant insights, and creating transparent frameworks for comparing options. Through structured decision-making formats, teams streamline discussions, minimize bias, and document rationale systematically, with many organizations finding that templated approaches accelerate consensus-building while delivering more objective, defensible outcomes.
Strategies to mitigate emotional influences include implementing structured decision frameworks, establishing cooling-off periods for major decisions, seeking diverse perspectives through team consultation, and utilizing data-driven analysis tools. These approaches enable organizations to maintain objectivity by separating facts from feelings, creating systematic evaluation processes, and ultimately delivering more consistent, strategic outcomes across departments.
Scenario planning templates aid decision-making by systematically mapping multiple future possibilities, identifying key variables and their potential impacts, and creating structured frameworks for evaluating risks and opportunities. Through these comprehensive tools, organizations can simulate various market conditions, regulatory changes, and competitive scenarios, ultimately enabling more informed strategic choices and minimizing unexpected outcomes across different business environments.
Techniques include brainstorming frameworks, scenario planning templates, mind mapping visuals, collaborative polling tools, and creative thinking exercises. These presentation elements foster innovation by encouraging diverse perspectives, visualizing multiple pathways, and facilitating interactive participation, with many organizations finding that structured creative processes ultimately enhance decision quality and stakeholder engagement.
Flowcharts facilitate clearer decision paths by visualizing complex choices through step-by-step sequences, decision points, and outcome branches, enabling teams to systematically evaluate options and consequences. Through structured mapping, organizations streamline strategic planning, risk assessment, and resource allocation, with many businesses finding that visual decision frameworks reduce confusion, accelerate consensus-building, and ultimately deliver more consistent, defensible outcomes across departments.
Stakeholder analysis enhances decision-making frameworks by identifying key influencers, understanding diverse perspectives, mapping potential resistance points, and clarifying communication channels. Through comprehensive stakeholder mapping, organizations streamline consensus-building, anticipate implementation challenges, and ensure broader buy-in, with many finding that early stakeholder engagement significantly reduces project delays and enhances strategic outcomes.
Retrospective templates enable teams to systematically analyze past decisions by examining what worked, what didn't, and underlying factors that influenced outcomes. These structured frameworks help organizations identify decision-making patterns, uncover blind spots, and develop improved processes, with many companies finding that regular retrospective practices enhance strategic planning and reduce repeated mistakes.
**INPUT**: What are some best practices for creating decision-making dashboards or visual aids for presentations? **OUTPUT**: Best practices include prioritizing key metrics, using consistent color coding, implementing interactive filters, maintaining clean layouts, and ensuring real-time data integration. These design principles streamline information processing by reducing cognitive load, highlighting critical insights, and enabling stakeholders to quickly identify trends, with many organizations finding that well-designed dashboards accelerate decision-making cycles and improve strategic outcomes. [Word count: 58 words]
Templates standardize evaluation criteria by providing structured frameworks that define key factors, weighting systems, scoring methodologies, and comparison matrices for consistent decision-making. These frameworks enable teams to transparently assess options against predetermined benchmarks, eliminate subjective bias, and communicate rationale clearly to stakeholders, with many organizations finding that standardized criteria accelerate approval processes while improving decision quality.
Decision fatigue reduces cognitive capacity, impairs judgment quality, leads to procrastination, and increases reliance on mental shortcuts that compromise strategic thinking. Structured templates mitigate these effects by standardizing evaluation criteria, streamlining information processing, and reducing cognitive load, with many organizations finding that systematic frameworks enable faster, more consistent decisions while preserving mental energy for complex strategic choices.
Cultural differences influence international team decision-making through varying communication styles, hierarchy preferences, risk tolerance levels, and consensus-building approaches, creating potential misalignment and delays. Decision-making templates address these disparities by providing standardized frameworks that accommodate diverse cultural perspectives, establish clear evaluation criteria, and streamline cross-cultural collaboration, ultimately enabling organizations to leverage global talent while maintaining consistent, efficient decision processes.
-
Attractive design and informative presentation.
-
Informative design.
-
Use of icon with content is very relateable, informative and appealing.
-
Easily Editable.
-
Enough space for editing and adding your own content.
-
Out of the box and creative design.
-
Awesome presentation, really professional and easy to edit.