Decline in the number of visitors of a theme park case competition complete deck
Formulate an informative set of data with our decline in the number of visitors of a theme park case competition complete PPT deck. It is essential for the working-class to be well versed with the current market size and total number of visitors in order to function smoothly, therefore, this fall in guests PowerPoint layout is a must have. Including the company's overview, mission, total revenue and profits, capital expenditure etc, the statistical representation of figures in this downfall of visitant PPT deck is beneficial to acquire in your organization to leave a lasting impact. The slides in this PowerPoint bundle showcase the figures on top competitor details, market demographics, and key trends in order for the audience to be well attentive regarding the same. The helpful slides in this depreciating explorers creative PPT set jots down all the persisting or possible problems that might occur in the business, along with corrective and systematic measures and plans for each and every issue that will help the business to grow. Grab it immediately to ensure hassle free working.
Formulate an informative set of data with our decline in the number of visitors of a theme park case competition complete P..
- Google Slides is a new FREE Presentation software from Google.
- All our content is 100% compatible with Google Slides.
- Just download our designs, and upload them to Google Slides and they will work automatically.
- Amaze your audience with SlideTeam and Google Slides.
-
Want Changes to This PPT Slide? Check out our Presentation Design Services
- WideScreen Aspect ratio is becoming a very popular format. When you download this product, the downloaded ZIP will contain this product in both standard and widescreen format.
-

- Some older products that we have may only be in standard format, but they can easily be converted to widescreen.
- To do this, please open the SlideTeam product in Powerpoint, and go to
- Design ( On the top bar) -> Page Setup -> and select "On-screen Show (16:9)” in the drop down for "Slides Sized for".
- The slide or theme will change to widescreen, and all graphics will adjust automatically. You can similarly convert our content to any other desired screen aspect ratio.
Compatible With Google Slides

Get This In WideScreen
You must be logged in to download this presentation.
PowerPoint presentation slides
Presenting our decline in the number of visitors of a theme park case competition complete PPT deck. This PowerPoint theme includes forty-eight slides and each one of them is available for download in both standard and widescreen formats. Easy to edit, this PPT deck is compatible with all popular presentation software such as Microsoft Office, Google Slides, and many others.
People who downloaded this PowerPoint presentation also viewed the following :
Content of this Powerpoint Presentation
Slide 1: Introduce the title of the presentation, "Decline in the number of visitors of a theme park (case competition)," in This slide. Add your company name here.
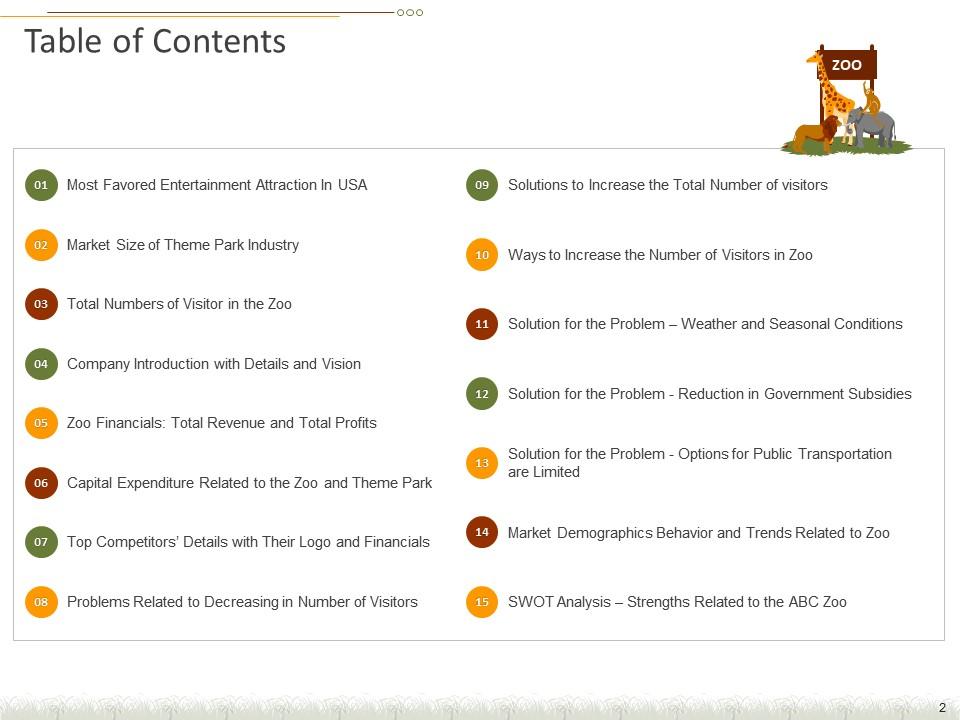
Slide 2: Use This slide to share the table of contents for your presentation. Cover aspects like the entertainment attractions of the US, your company's introduction and role in this project, and problems and solutions to this decline.
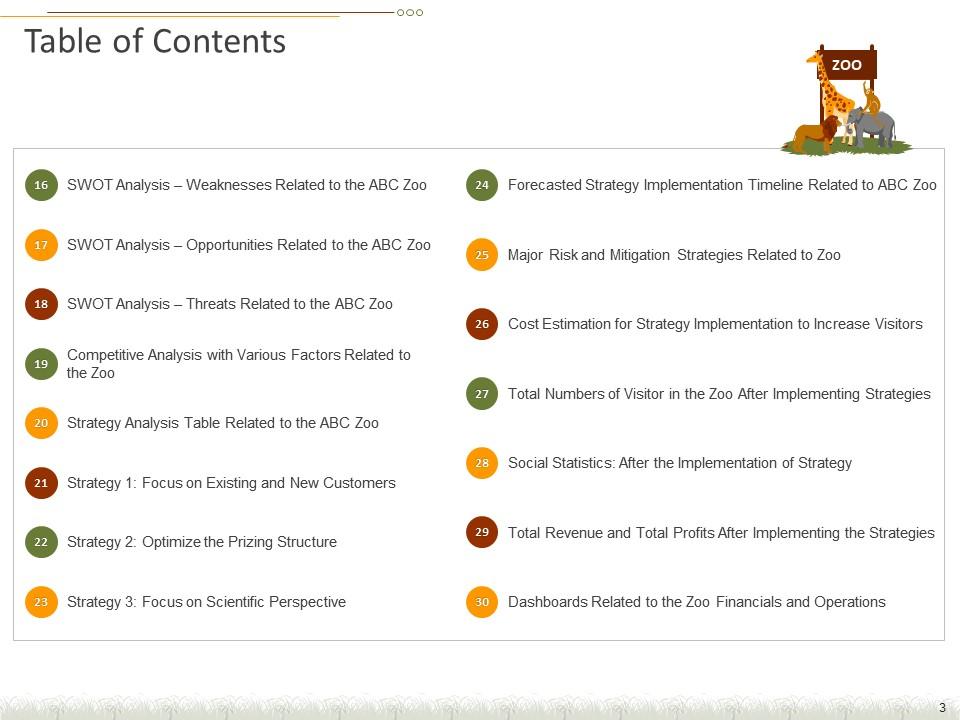
Slide 3: This slide is in continuation with the previous slide and will cover the remaining portion of headings to be covered in this PPT presentation.
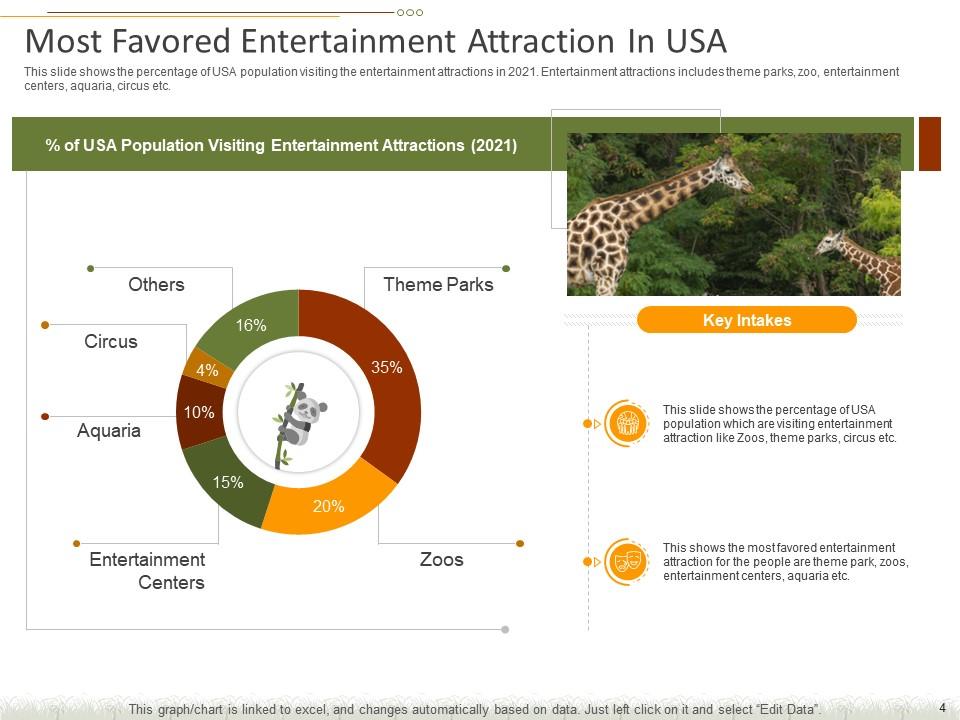
Slide 4: This slide shows the percentage of the USA population visiting the entertainment attractions in a particular year, including theme parks, zoos, entertainment centers, aquaria, circuses, etc.
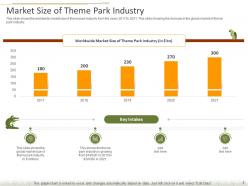
Slide 5: This slide shows the worldwide market size of the theme park industry over the years.
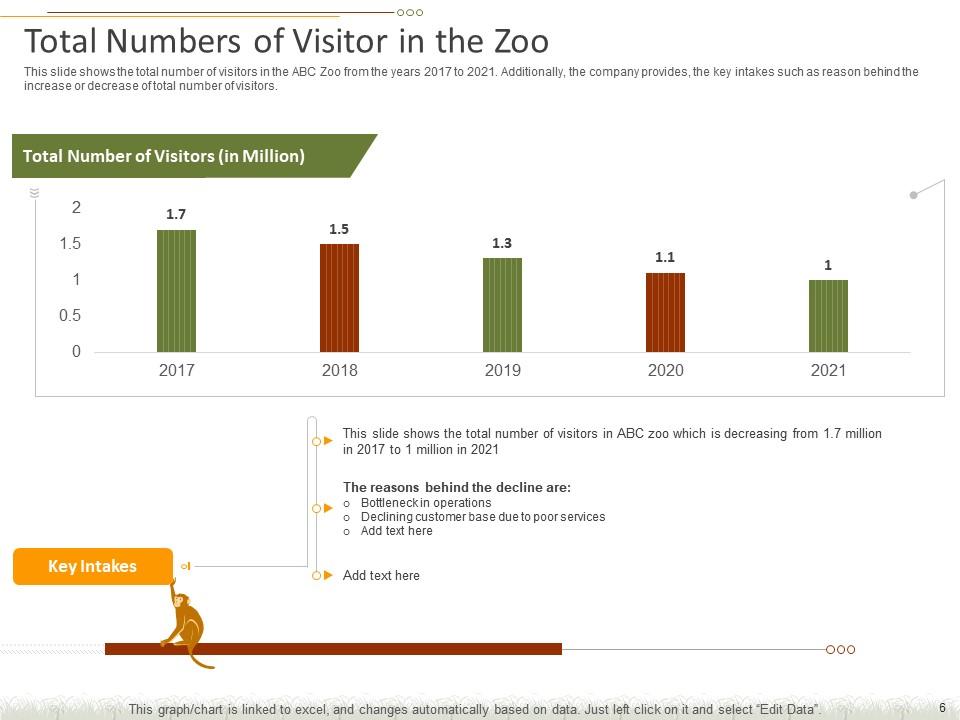
Slide 6: This slide shows the total number of visitors to the ABC zoo from 2017 to 2021. In addition to the key intakes, such as the reason behind the increase or decrease of the total number of visitors.
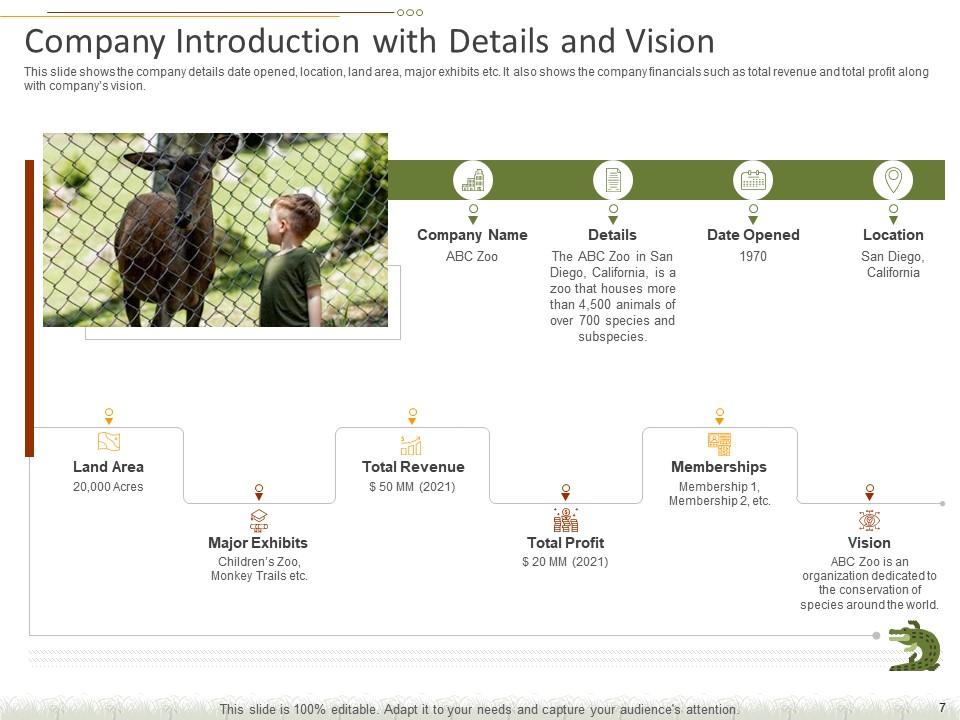
Slide 7: This slide shows the company details such as the date opened, location, land area, major exhibits, etc. It also shows the company's financials, such as total revenue and total profit, along with its vision.
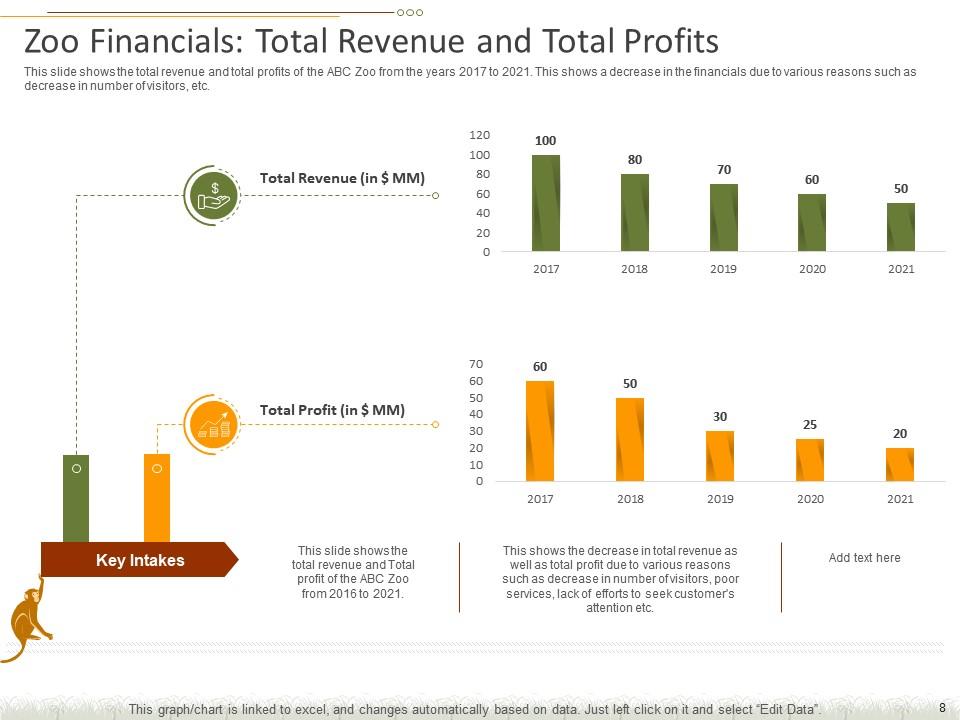
Slide 8: This slide shows the total revenue and profits of the ABC zoo over the years to show a stoop in the financials due to various reasons such as the decrease in the number of visitors, etc.
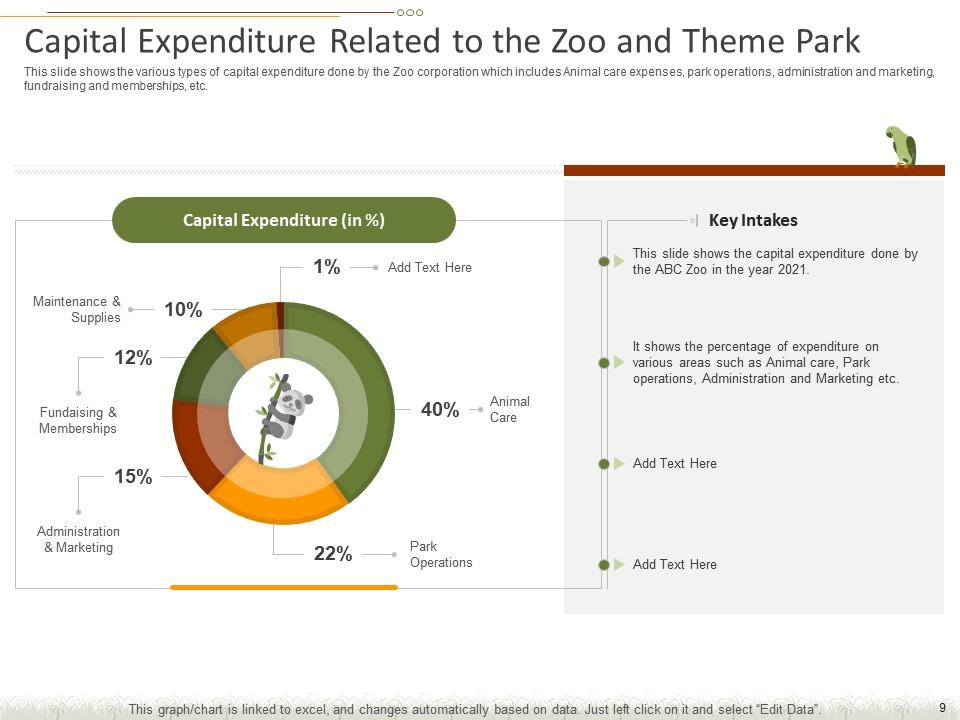
Slide 9: This slide shows the various types of capital expenditure done by the zoo corporation, including animal care expenses, park operations, administration and marketing, fundraising and memberships, etc.
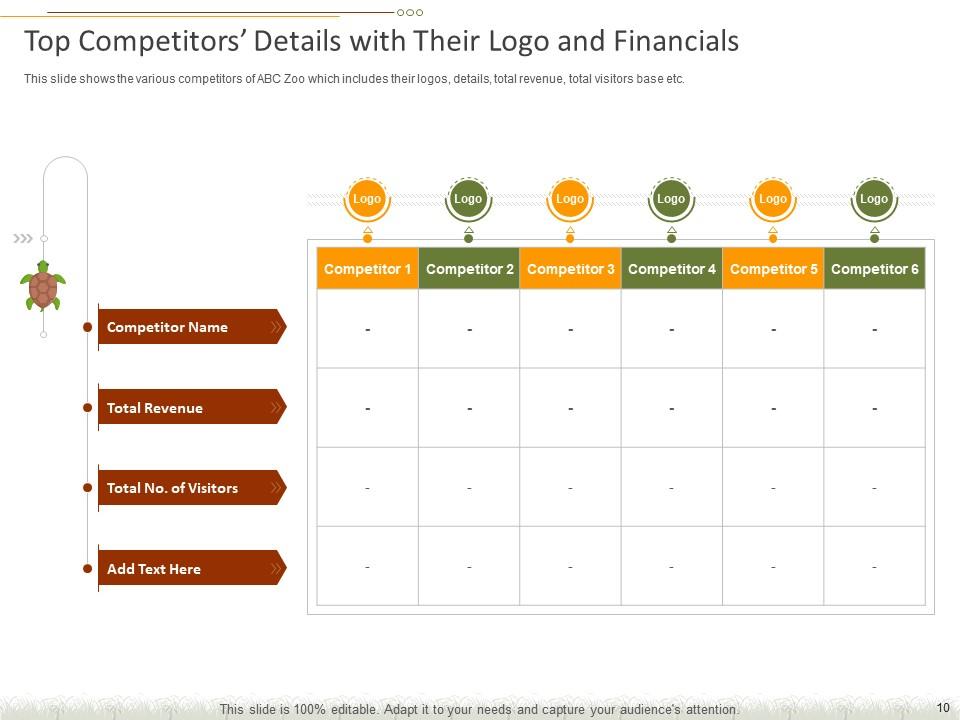
Slide 10: This slide shows the various competitors of ABC zoo, including their logos, details, total revenue, total visitors base, etc.
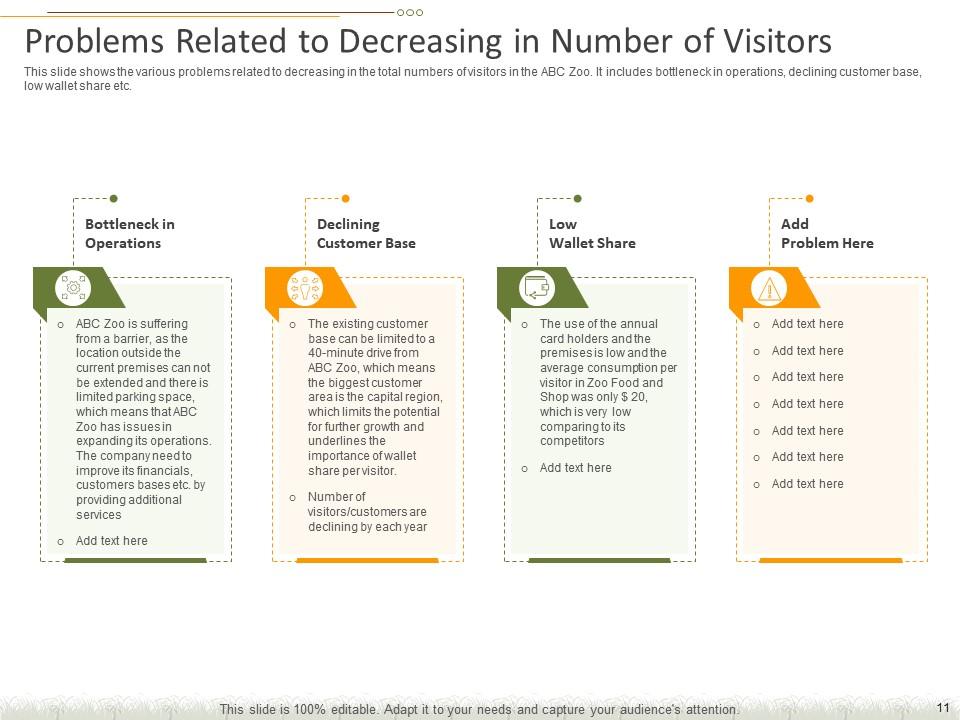
Slide 11: This slide shows the various problems related to the decrease in the total numbers of visitors to the ABC zoo. It includes operational bottlenecks, declining customer base, low wallet share, etc.
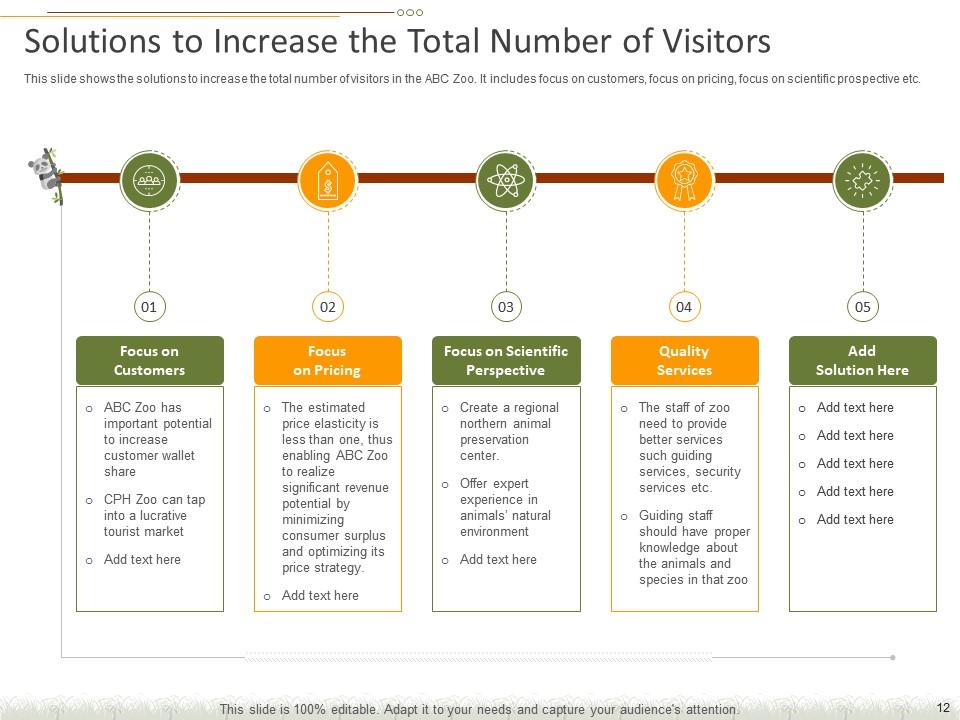
Slide 12: This slide shows the solutions to increase the total number of visitors to the ABC zoo. It includes the focus on customers, pricing, scientific perspective, etc.
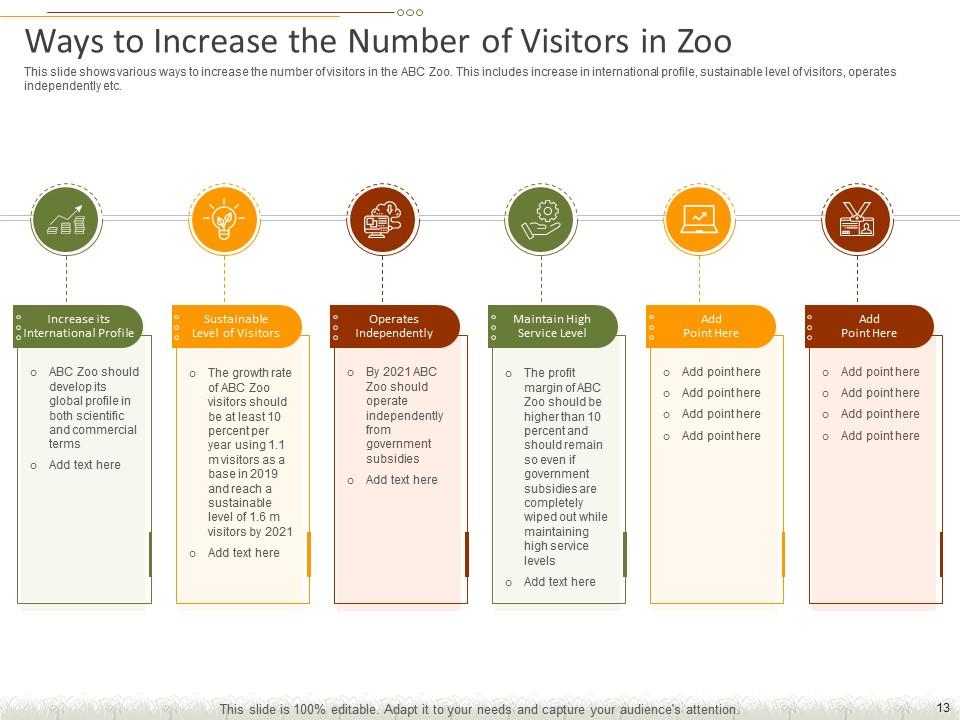
Slide 13: This slide shows various ways to increase the number of visitors to the ABC zoo. This includes an increase in international profile, sustainable level of visitors, independent operation, etc.
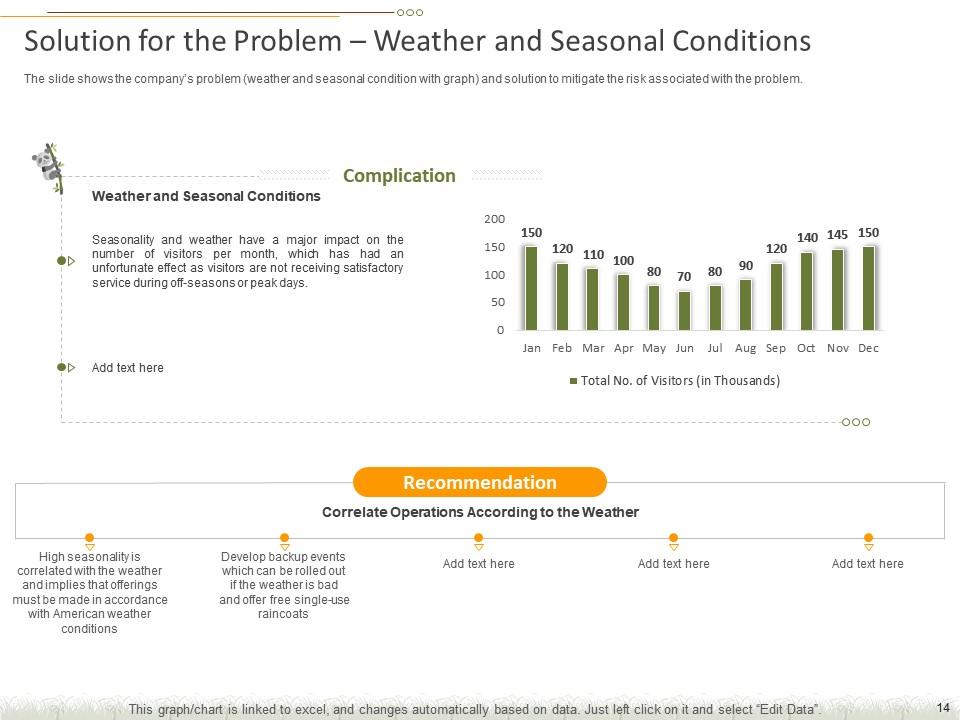
Slide 14: This slide shows the company's problem (weather and seasonal condition with graph) and solution to mitigate the risk associated with the problem.
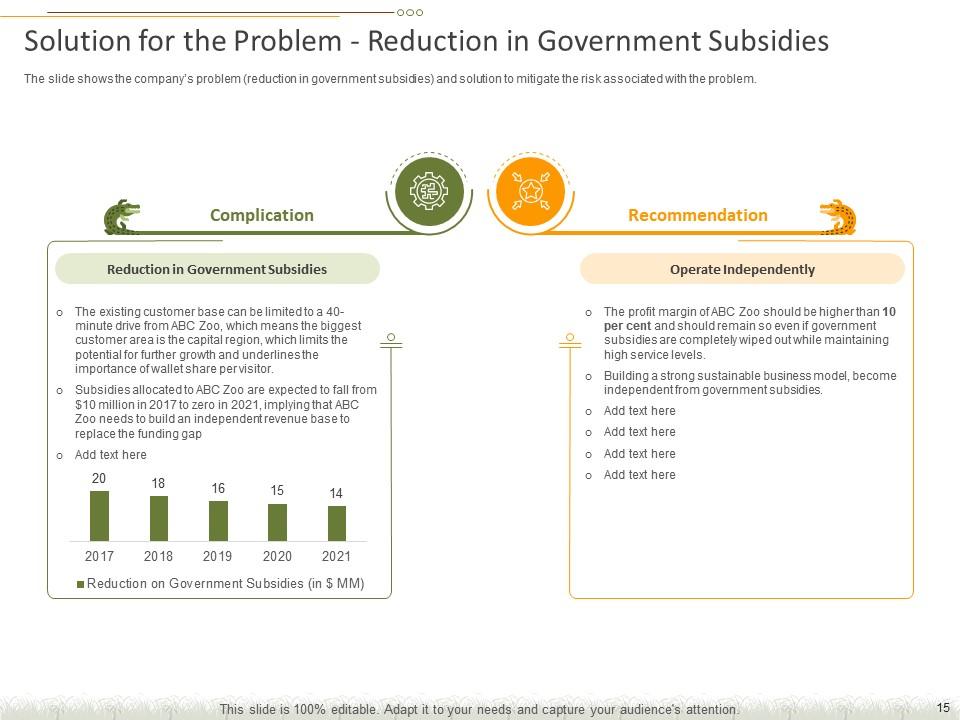
Slide 15: This slide shows the company's problem (reduction in government subsidies) and solutions to mitigate the risk associated with the problem.
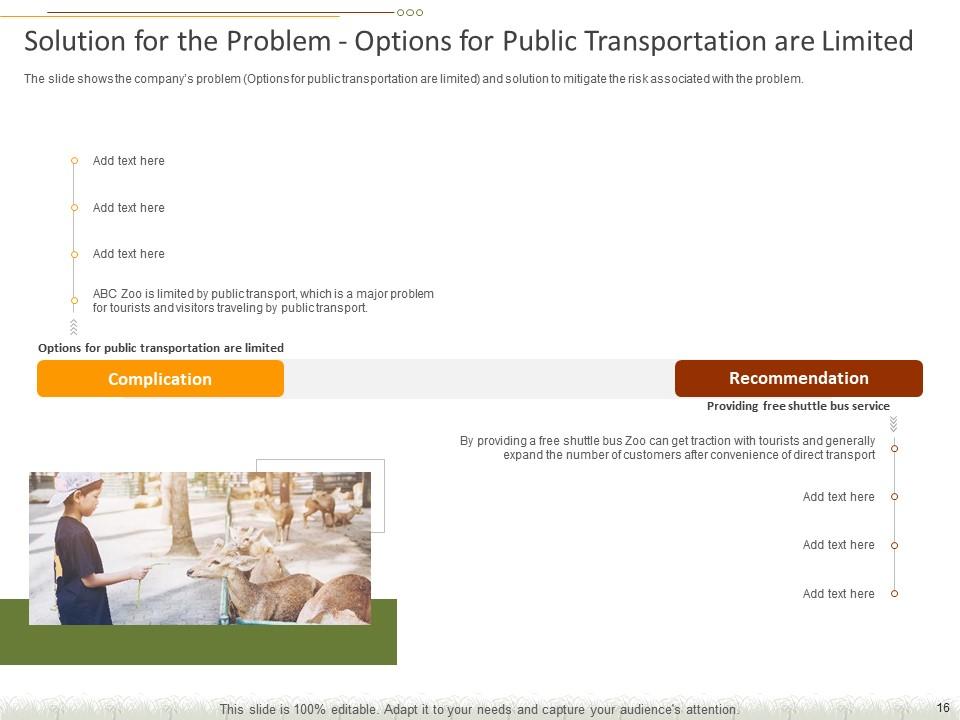
Slide 16: This slide shows the company's problem (options for public transportation are limited) and solutions to mitigate the risk associated with the problem.
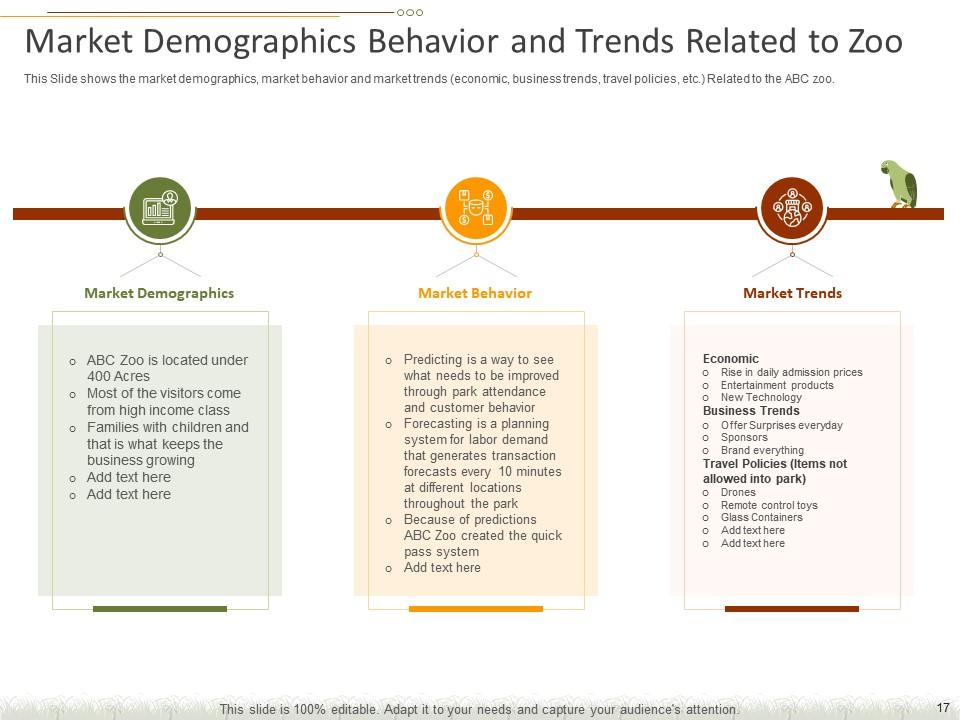
Slide 17: This slide shows the market demographics, behavior, and trends (economic, business trends, travel policies, etc.) related to the ABC zoo.
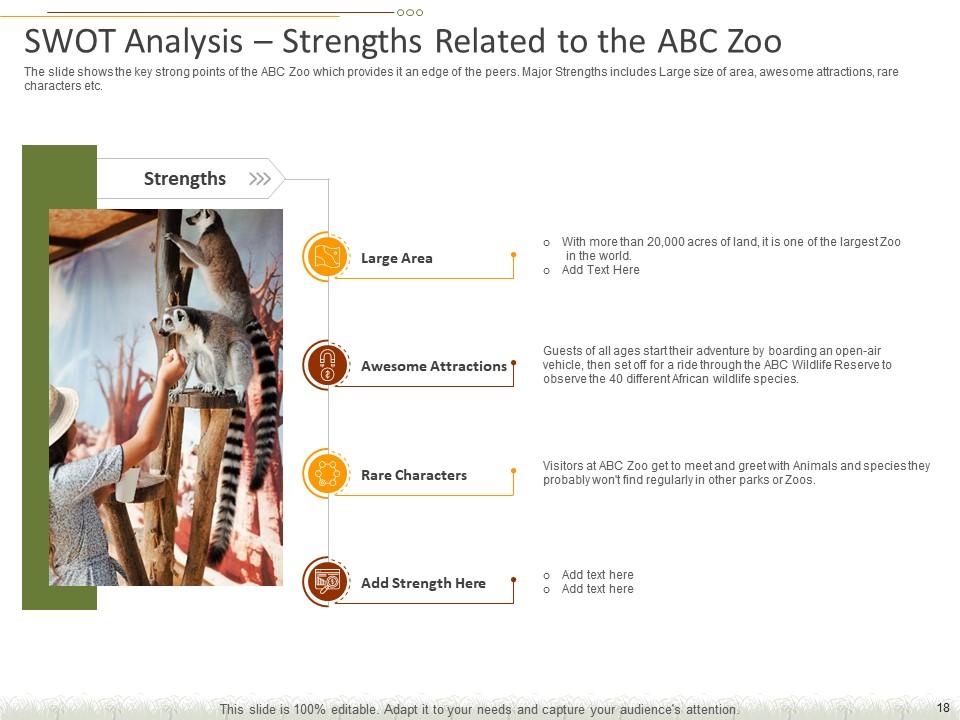
Slide 18: This slide shows the key strong points of the ABC zoo, which provides it an edge over its peers. And its major strengths include extensive areas, awesome attractions, rare characters, etc.
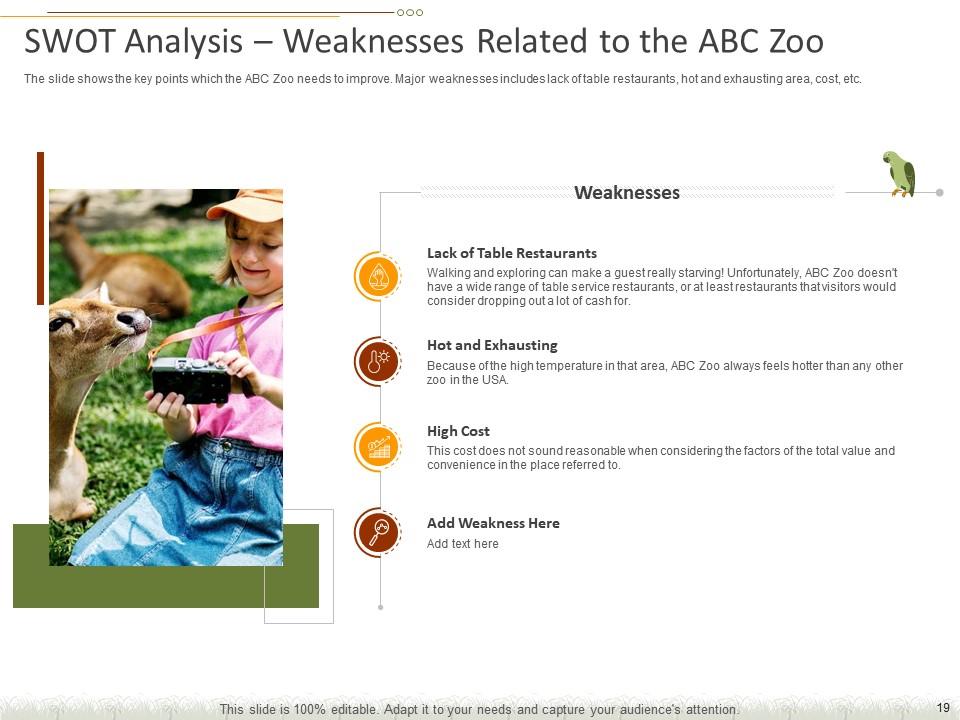
Slide 19: This slide shows the key points which the ABC zoo needs to improve. Major weaknesses include lack of table restaurants, hot and exhausting areas, cost, etc.
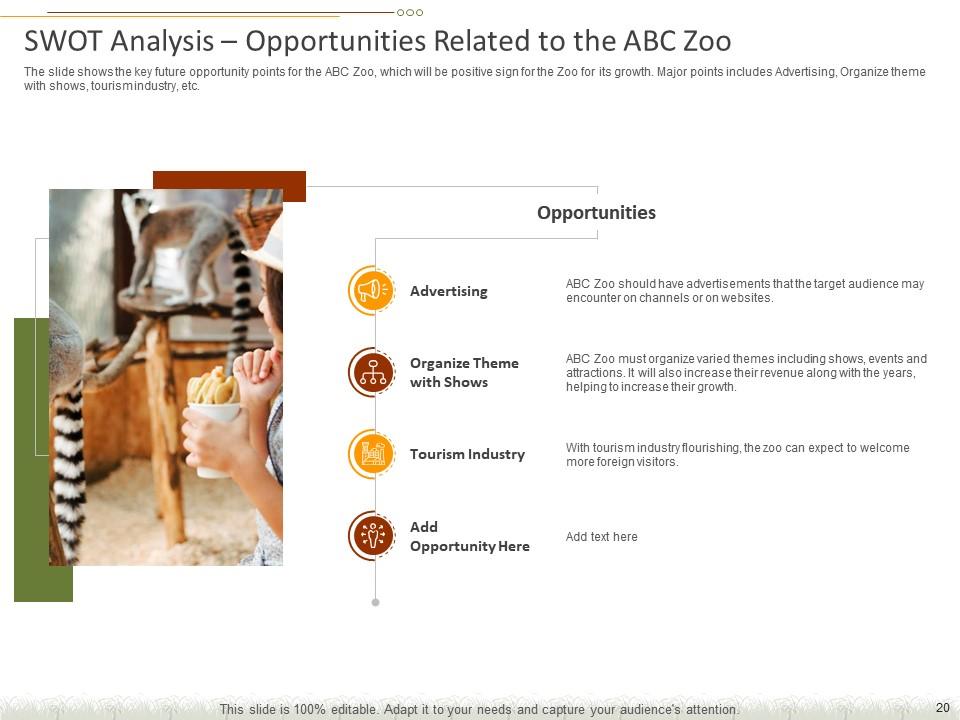
Slide 20: This slide shows the key future opportunity points for the ABC zoo, which will be a positive sign for its growth. Major topics include advertising, organizing themes with shows, the tourism industry, etc.
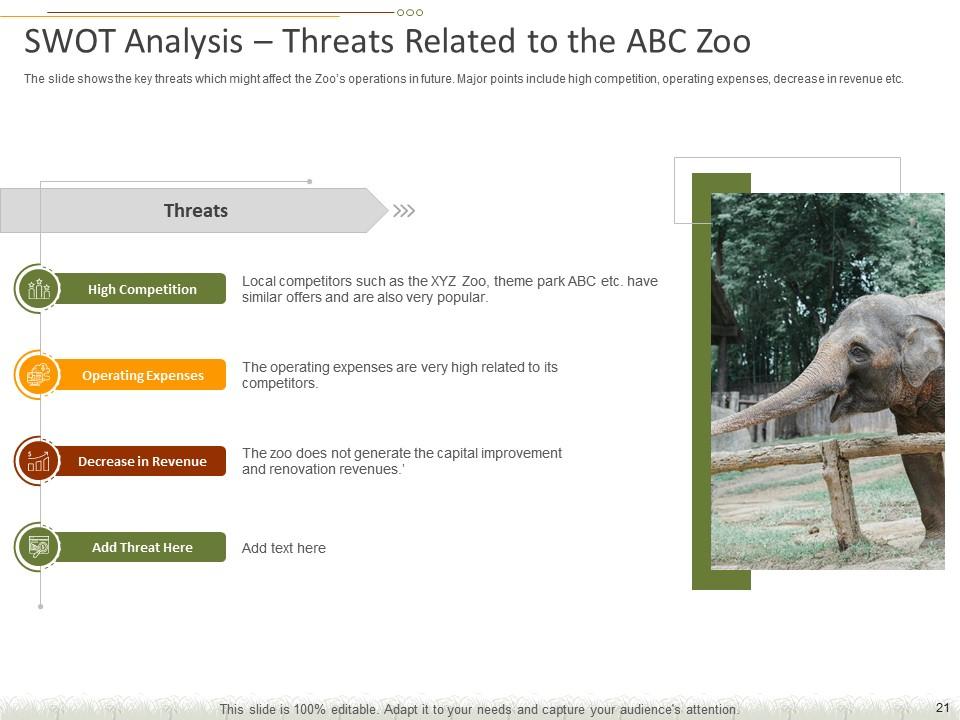
Slide 21: This slide shows the key threats which might affect the zoo's operations in the future. Major points include high competition, operating expenses, decrease in revenue, etc.
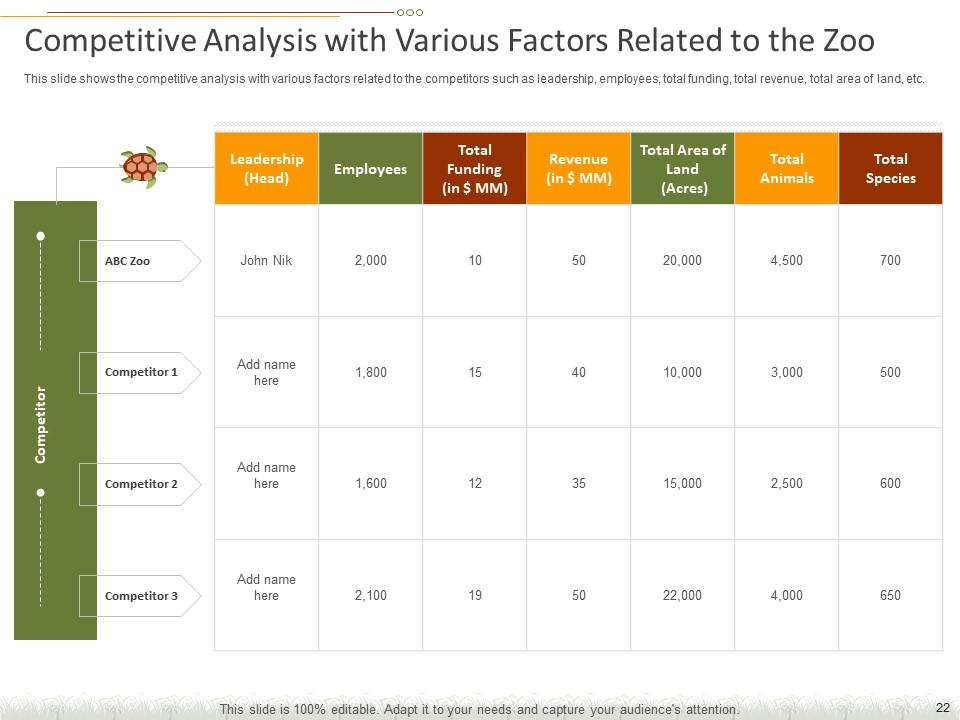
Slide 22: This slide shows the competitive analysis with various factors related to the competitors such as leadership, employees, total funding, total revenue, the total area of land, etc.
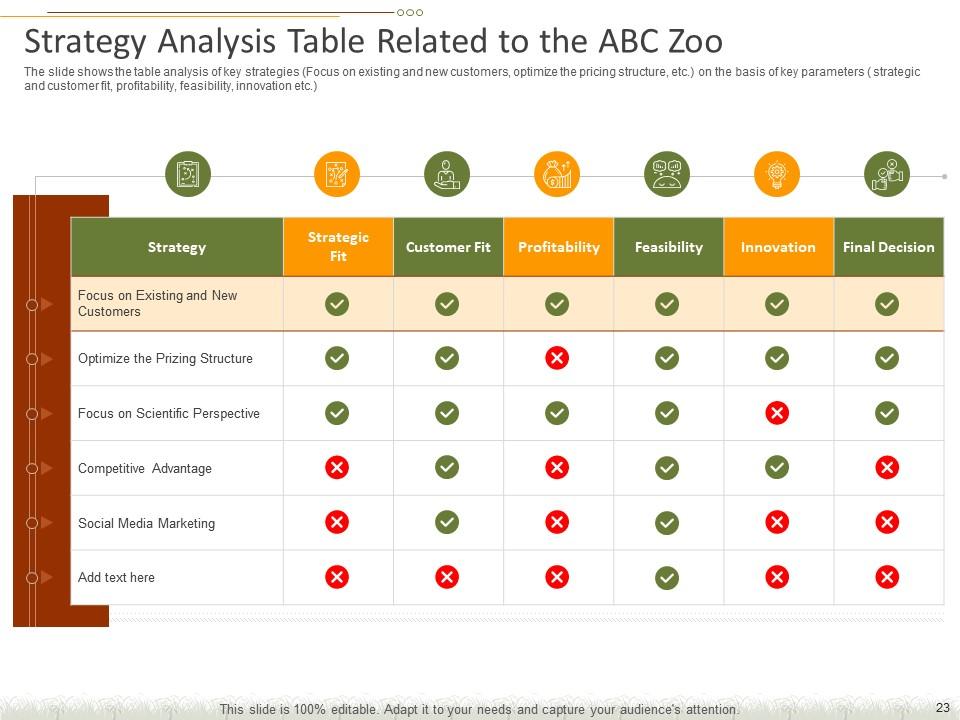
Slide 23: This slide shows the table analysis of key strategies (focusing on existing and new customers, optimizing the pricing structure, etc.) based on key parameters (strategic and customer fit, profitability, feasibility, innovation, etc.)
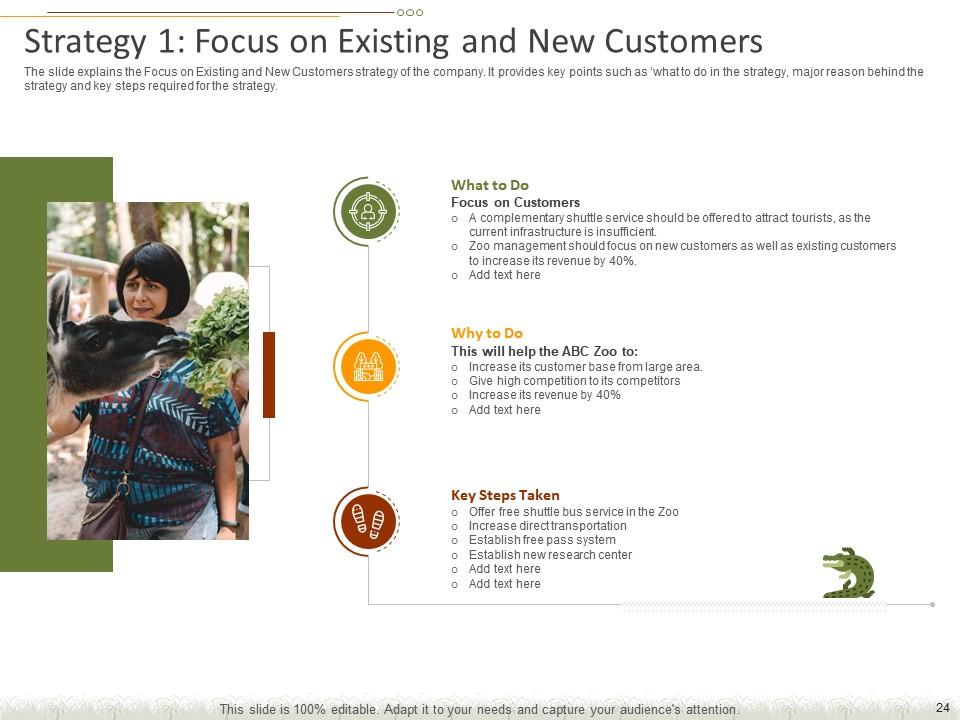
Slide 24: This slide explains the focus on existing and new customers strategy of the company. It provides key points such as what to do in the strategy, the primary reason behind the strategy, and key steps required.
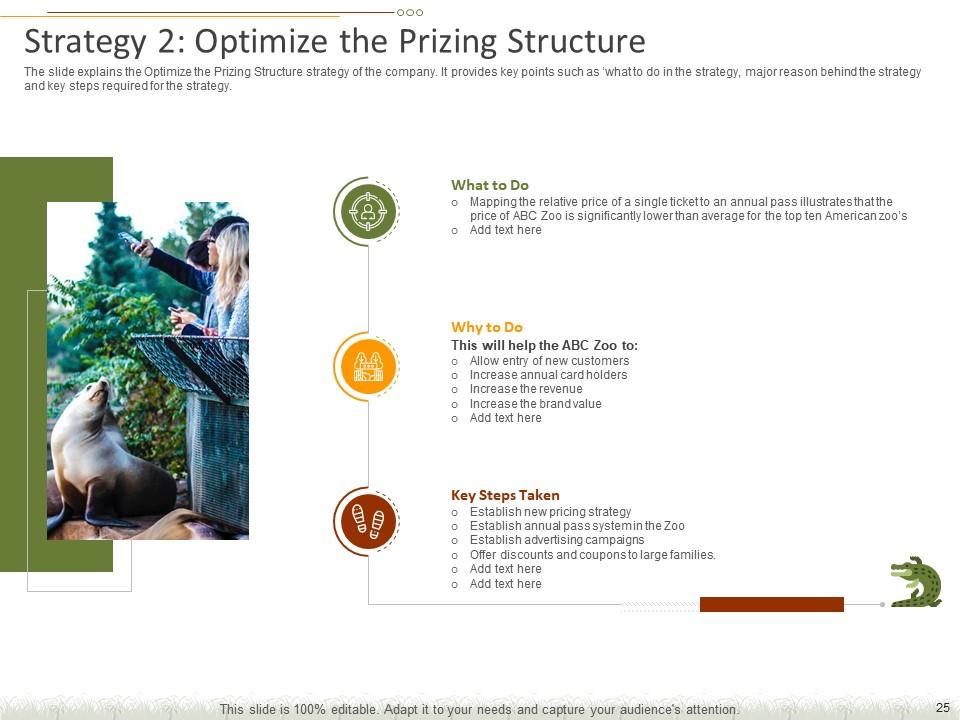
Slide 25: This slide explains “optimize the prizing structure strategy of the company”. It provides key points such as 'what to do in the strategy, the major reason behind the strategy, and key steps required.
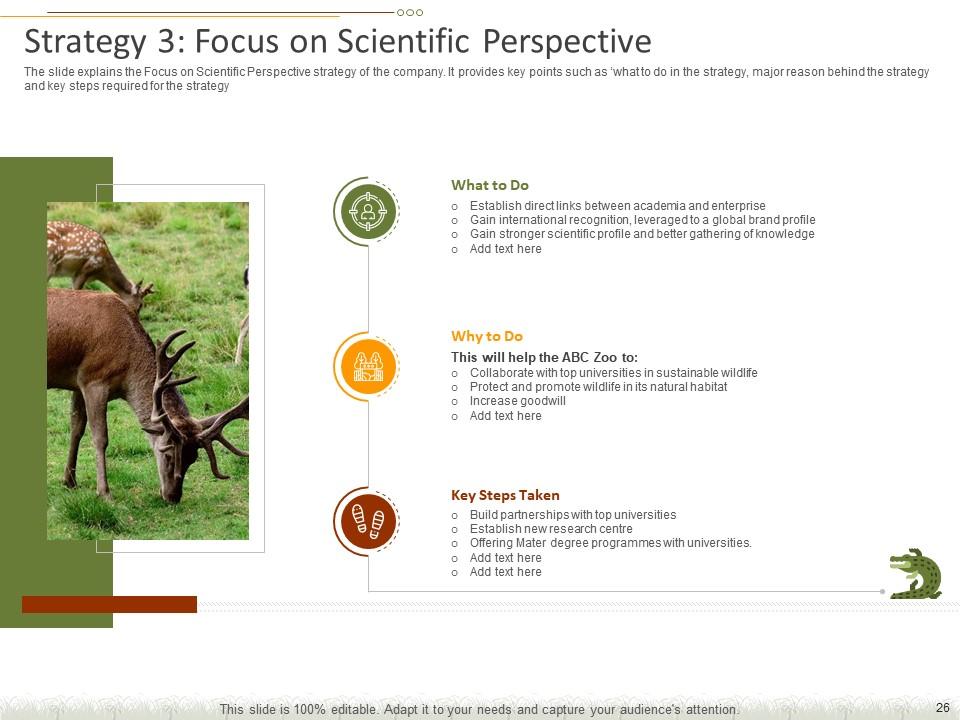
Slide 26: This slide explains the focus on scientific perspective strategy of the company. It provides key points such as what to do in the strategy, the major reason behind the strategy, and key steps required for the strategy.
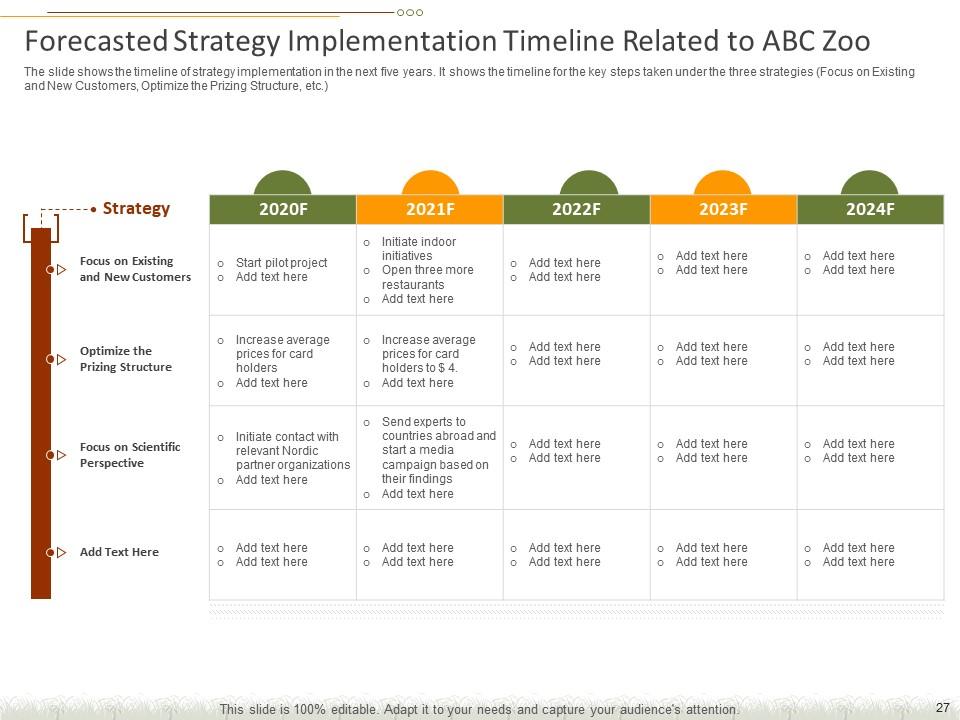
Slide 27: This slide shows the timeline of strategy implementation in the next five years. It shows the timeline for the key steps taken under the three strategies (focus on existing and new customers, optimize the pricing structure, etc.)
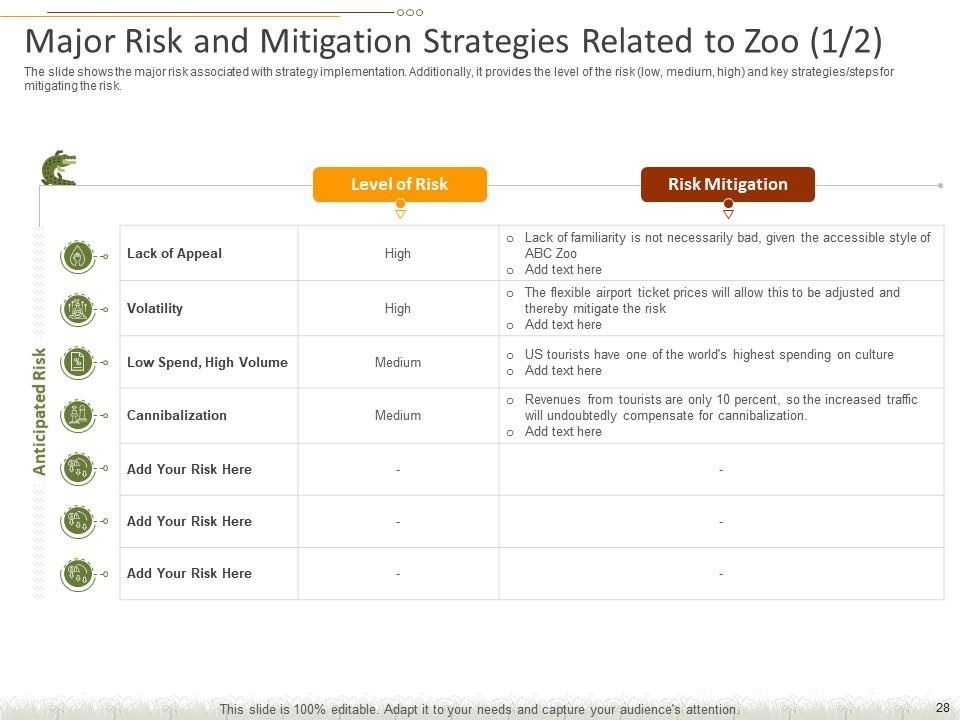
Slide 28: This slide shows the major risk associated with strategy implementation. Additionally, it provides the level of the risk (low, medium, high) and key strategies/steps for mitigating the risk.
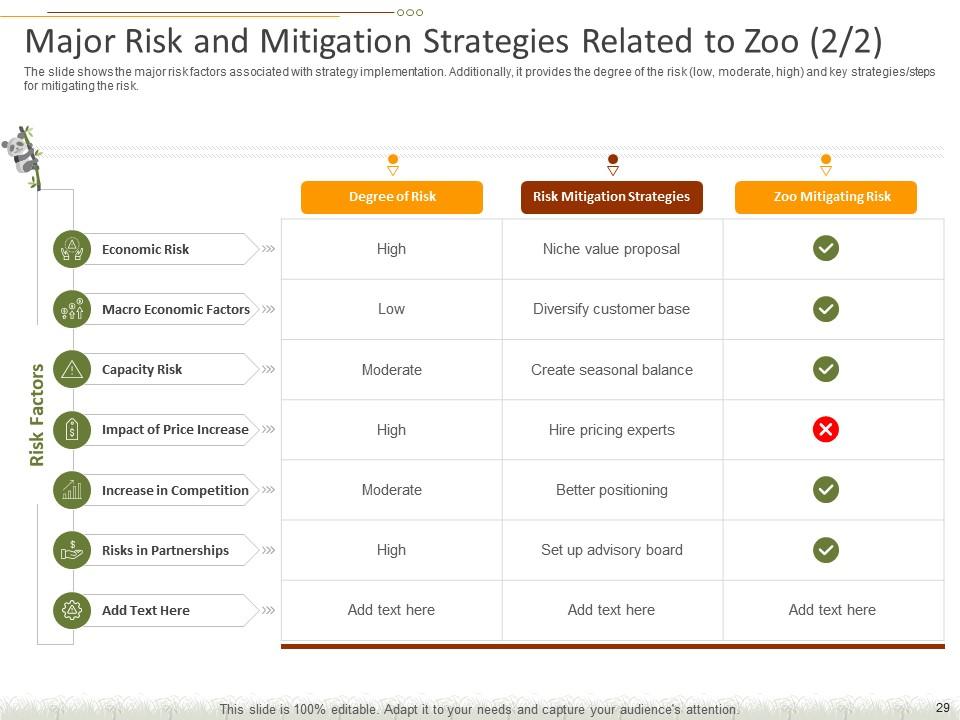
Slide 29: This slide shows the major risk factors associated with strategy implementation.
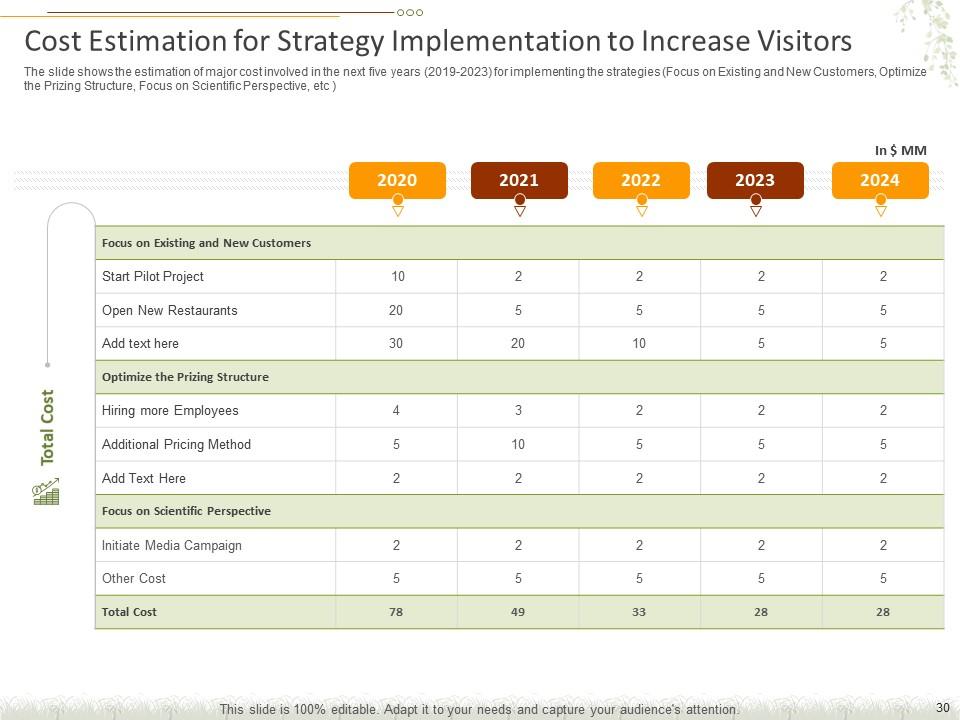
Slide 30: This slide is in continuation with the previous slide and can additionally showcase the degree of the risk (low, moderate, high) and key strategies/steps for mitigating the risk by focusing on existing and new customers, optimizing the pricing structure, etc.
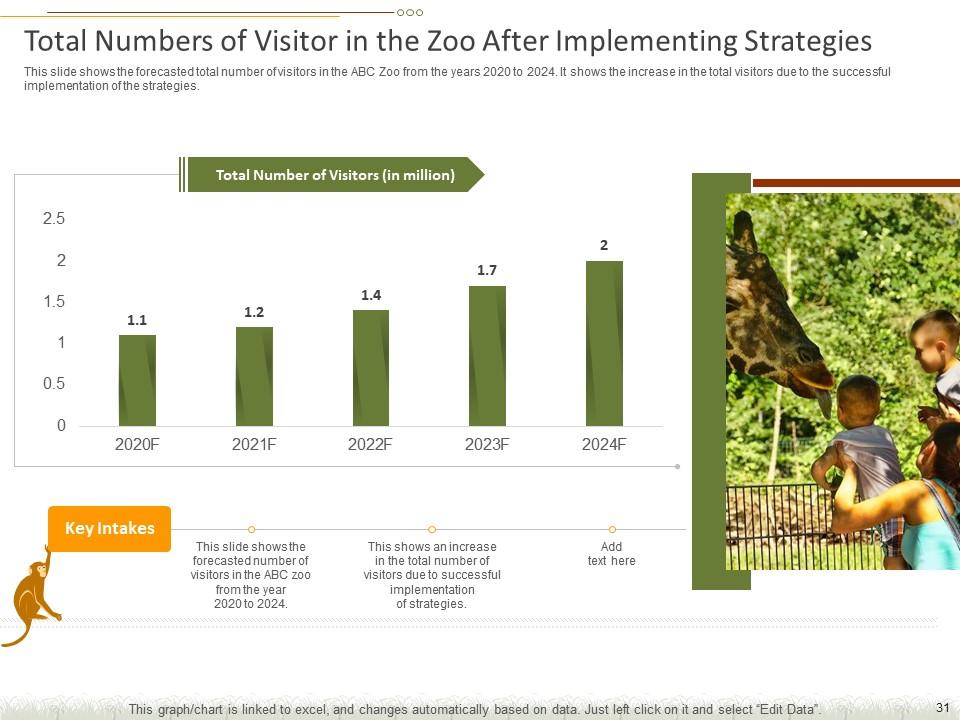
Slide 31: This slide shows the forecasted total number of visitors to the ABC zoo over a time period. It shows the increase in the total number of visitors due to the successful implementation of the strategies.
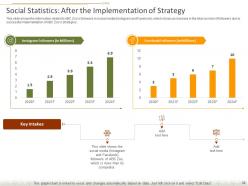
Slide 32: This slide shows the information related to ABC zoo's followers in social media (Instagram and Facebook), which shows an increase in the total number of followers due to the successful implementation of ABC zoo's strategies.
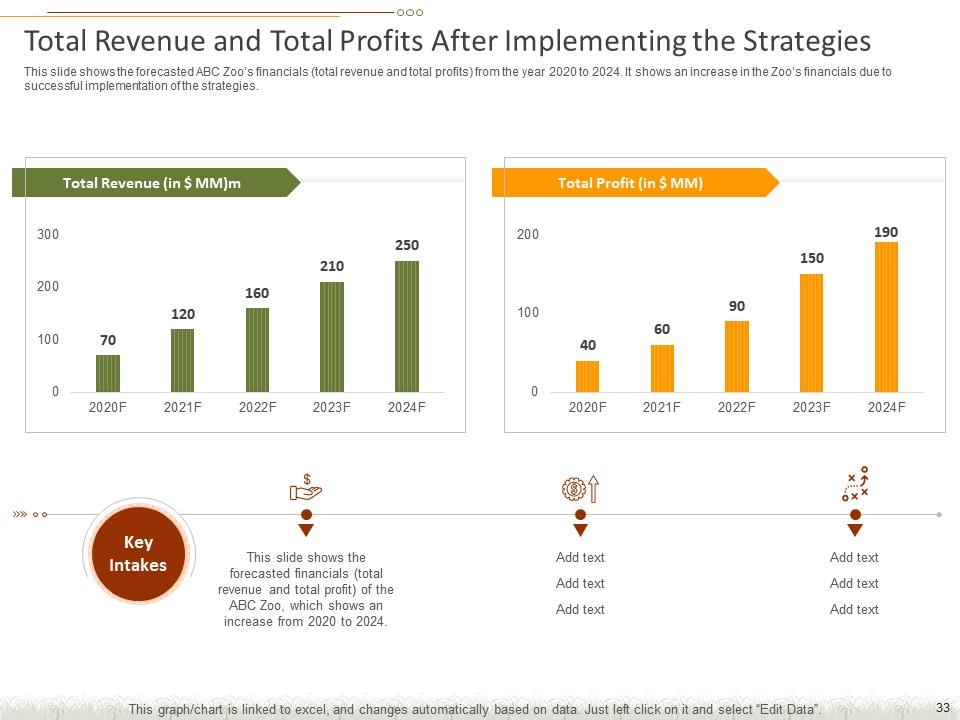
Slide 33: This slide shows ABC zoo's forecasted financials (total revenue and total profits) over a while, showing an increase in the zoo's financials due to the successful implementation of the strategies.
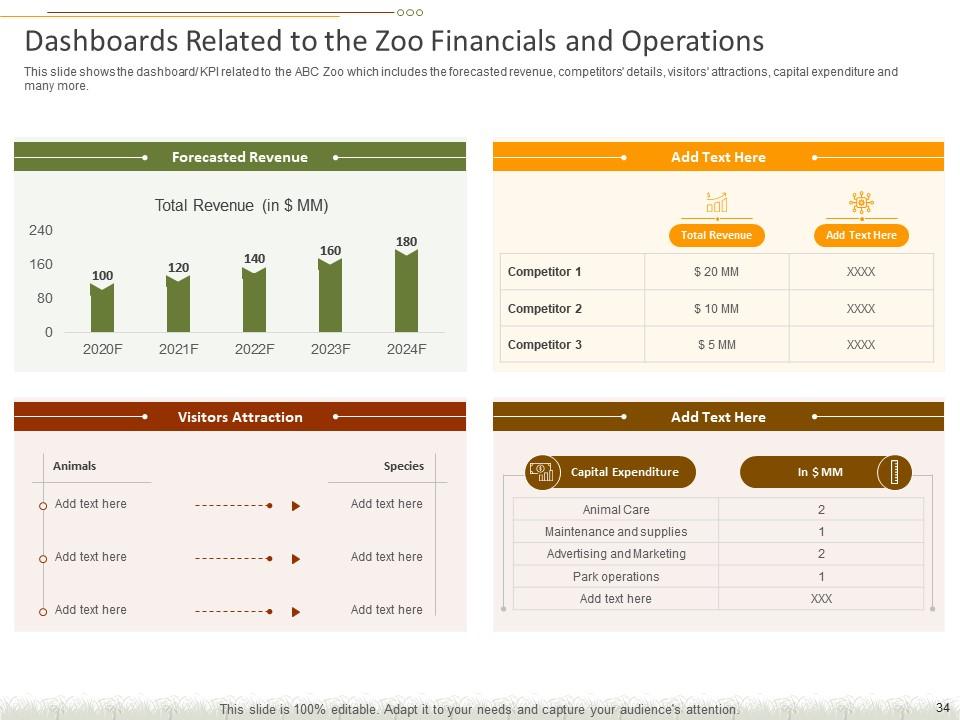
Slide 34: This slide shows the dashboard/ KPI related to the ABC zoo, including the forecasted revenue, competitors' details, visitors' attractions, capital expenditure, and many more.
Slide 35: This is the icons' slide for this presentation comprising infographics that can simplify visualization.
Slide 36: This slide marks the beginning of Additional slides for this presentation. It comprises charts and miscellaneous slides that you can use to make this presentation thorough and well researched.
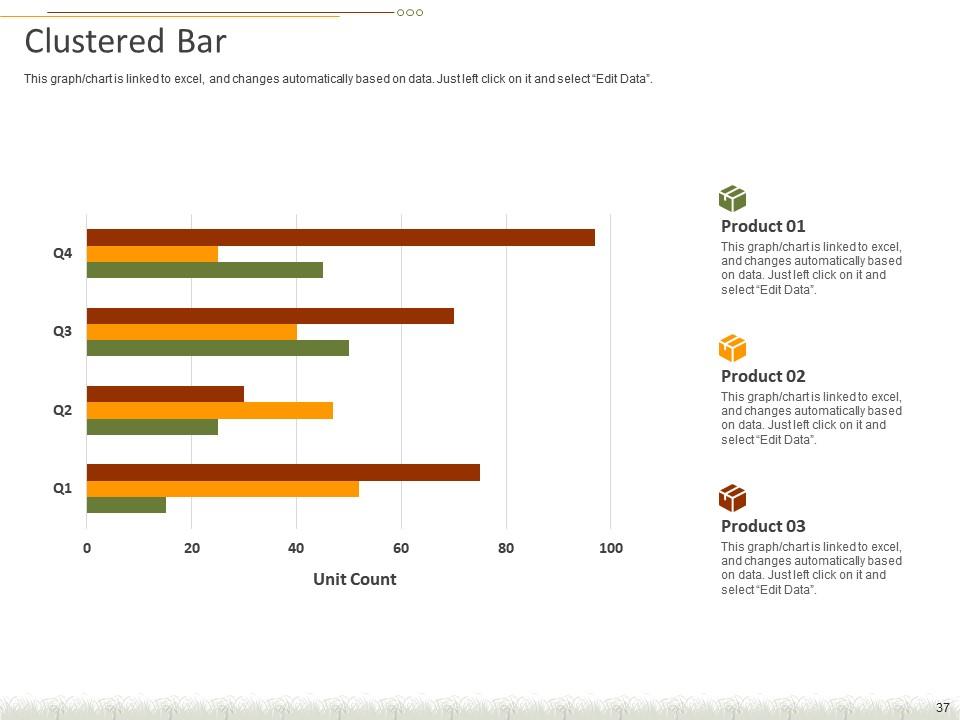
Slide 37: This slide presents a clustered bar graph diagram to analyze multiple variables on a single slide.
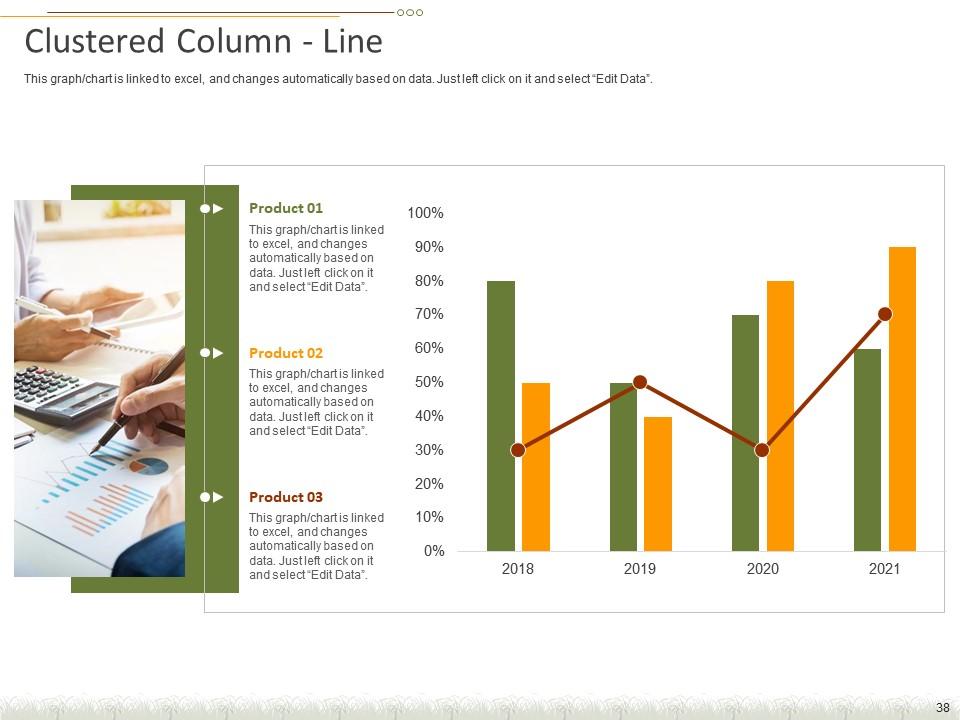
Slide 38: This is a clustered column chart to present a visual difference from the previous slide.
Slide 39: Share your company vision, mission, and values in this PPT slide.
Slide 40: This is the 'About Us' slide. Highlight your characteristic features, target audience, and distinct clients in This slide
Slide 41: Share your 30, 60, and 90 Days plans in this PPT slide.
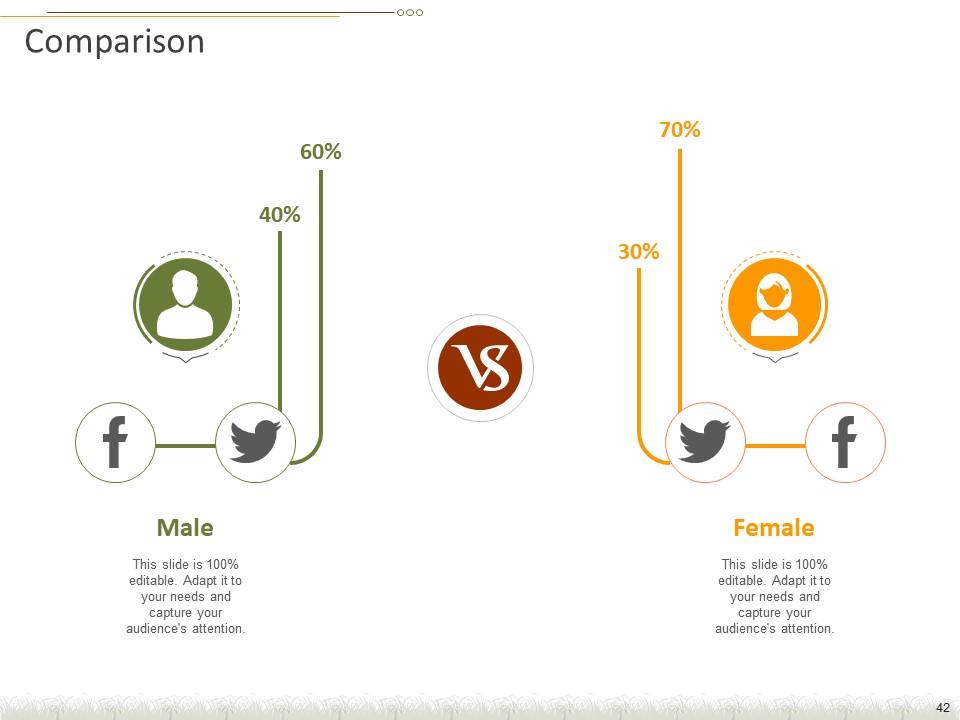
Slide 42: This is This slide to share the gender ratio between the fauna under observation.
Slide 43: This slide provides a Venn diagram that can show interconnectedness and overlap between various departments, projects, etc.
Slide 44: This is the slide to represent the key highlights of your finance pertaining to this assessment program.
Slide 45: This is a linear process slide highlighting the connectivity between the processes, departments and key variables, etc, along with their essences.
Slide 46: This is a timeline slide to share your growth and milestones creatively.
Slide 47: This is the roadmap for the process flow slide to share the framework of your project.
Slide 48: This is a Thank You slide where details such as the address, contact number, and email address are added.
Decline in the number of visitors of a theme park case competition complete deck with all 48 slides:
Use our Decline In The Number Of Visitors Of A Theme Park Case Competition Complete Deck to effectively help you save your valuable time. They are readymade to fit into any presentation structure.
-
Informative presentations that are easily editable.
-
I discovered this website through a google search, the services matched my needs perfectly and the pricing was very reasonable. I was thrilled with the product and the customer service. I will definitely use their slides again for my presentations and recommend them to other colleagues.
-
Understandable and informative presentation.
-
Great designs, really helpful.
-
Illustrative design with editable content. Exceptional value for money. Highly pleased with the product.
-
Editable templates with innovative design and color combination.
-
Amazing product with appealing content and design.


