Difference Between Visual And Data Analytics
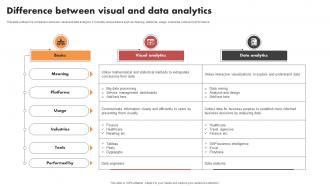
This slide outlines the comparison between visual and data analytics. It includes various basics such as meaning, platforms, usage, industries, tools and performance.
You must be logged in to download this presentation.
 Impress your
 audience
Editable
of Time
PowerPoint presentation slides
This slide outlines the comparison between visual and data analytics. It includes various basics such as meaning, platforms, usage, industries, tools and performance. Presenting our well structured Difference Between Visual And Data Analytics. The topics discussed in this slide are Service, Management, Dashboards. This is an instantly available PowerPoint presentation that can be edited conveniently. Download it right away and captivate your audience.
People who downloaded this PowerPoint presentation also viewed the following :
Difference Between Visual And Data Analytics with all 10 slides:
Use our Difference Between Visual And Data Analytics to effectively help you save your valuable time. They are readymade to fit into any presentation structure.
-
I’m not a design person, so I couldn’t make a presentation to save my life. Thankfully, they have all kinds of templates that I regularly use for my work.
-
My team has been relying on SlideTeam’s professional PPT designs for a while now. It has greatly sped up quality work at my organization. So thanks!


