


Digital Marketing Analytics For Better Business Growth Powerpoint Presentation Slides


Try Before you Buy Download Free Sample Product
 Impress Your
 Audience
Editable
of Time


Marketing analytics is an essential process that systematically analyzes marketing data to determine the effectiveness and success of marketing activities. Grab our Digital Marketing Analytics for Better Business Growth template. It is expertly crafted to provide Better Customer Insights. Our Data Analytics ppt helps you gain in depth insights into consumer behavior and preferences, which can help you to optimize your marketing campaigns and drive better results. It provides a brief overview of marketing analytics, including its benefits, elements, types, and top challenges that companies face. We have incorporated various channels for implementing marketing analytics, such as landing page website analytics, SEO analytics, email analytics, and more. Moreover, our Marketing Analytics PPT helps you achieve a higher return on investment by optimizing your marketing objectives. It highlights the key performance indicators KPIs that must be monitored while conducting marketing analytics. Lastly, the module provides a comprehensive solution for businesses seeking insights into consumer behavior and optimizing their marketing efforts. Download our 100 percentage editable presentation now to access this valuable resource.
People who downloaded this PowerPoint presentation also viewed the following :
Content of this Powerpoint Presentation
Slide 1: This slide displays the title Digital Marketing Analytics for Better Business Growth.
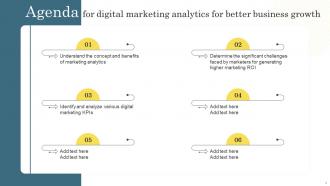
Slide 2: This slide displays the title Agenda for digital marketing analytics for better business growth.
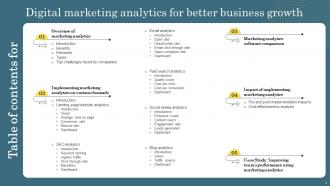
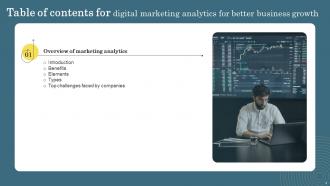
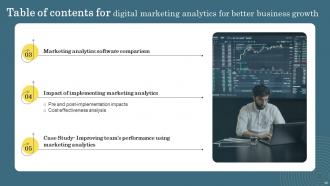
Slide 3: This slide exhibit table of content.
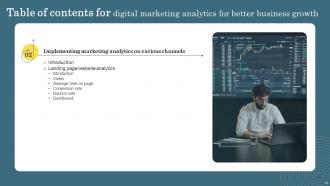
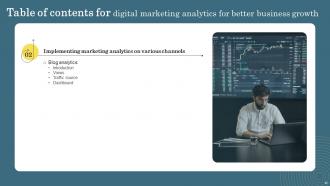
Slide 4: This slide exhibit table of content that is to be discuss further.
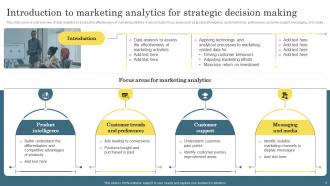
Slide 5: This slide covers a brief overview of data analytics to assess the effectiveness of marketing activities.
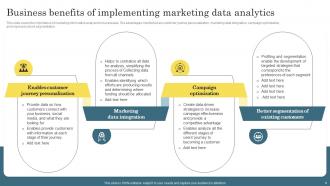
Slide 6: This slide covers the importance of marketing information analysis for businesses.
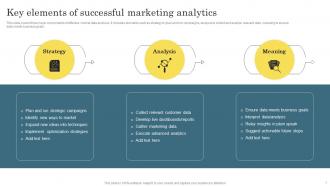
Slide 7: This slide covers three major components of effective market data analysis.
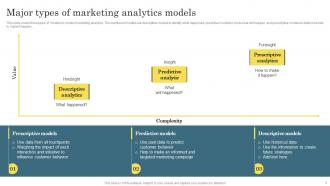
Slide 8: This slide covers three types of models to conduct marketing analytics.
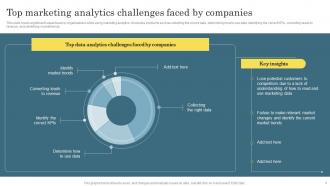
Slide 9: This slide covers significant issues faced by organizations while using marketing analytics.
Slide 10: This slide exhibit table of content that is to be discuss further.
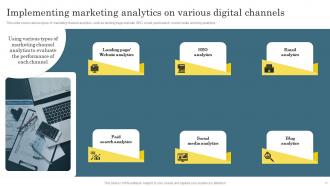
Slide 11: This slide covers various types of marketing channel analytics, such as landing page/ website, SEO, email, paid search, social media, and blog analytics.
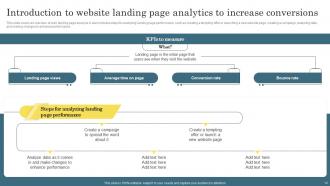
Slide 12: This slide covers an overview of web landing page analysis.
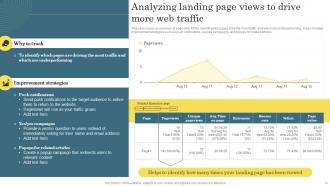
Slide 13: This slide covers an overview of page view KPI to identify which pages drive the most traffic and which are underperforming.
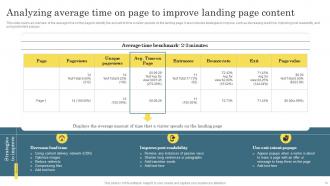
Slide 14: This slide covers an overview of the average time on the page to identify the amount of time a visitor spends on the landing page.
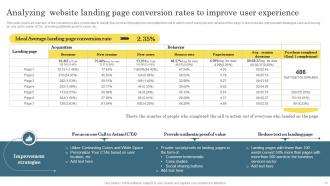
Slide 15: This slide covers an overview of the conversion rates of websites to identify the number of people who completed the call to action out of everyone.
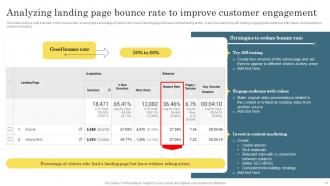
Slide 16: This slide covers a brief overview of the bounce rate, showing the percentage of visitors who load a landing page but leave without taking action.
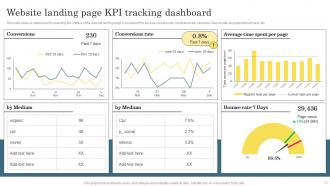
Slide 17: This slide covers a dashboard for analyzing the metrics of the website landing page.
Slide 18: This slide exhibit table of content that is to be discuss further.
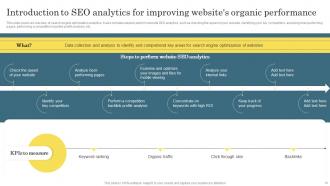
Slide 19: This slide covers an overview of search engine optimization analytics.
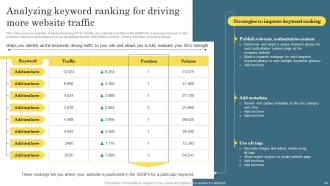
Slide 20: This slide covers an overview of keyword ranking KPI to identify your website’s position in the SERPs for a particular keyword.
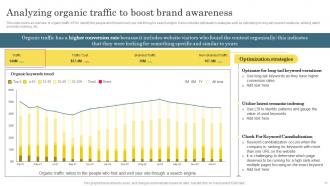
Slide 21: This slide covers an overview of organic traffic KPI to identify the people who find and visit your site through a search engine.
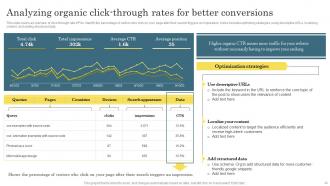
Slide 22: This slide covers an overview of click-through rate KPI to identify the percentage of visitors who click on your page after their search triggers an impression.
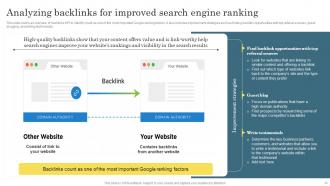
Slide 23: This slide covers an overview of backlinks KPI to identify count as one of the most important Google ranking factors.
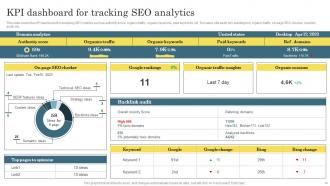
Slide 24: This slide covers the KPI dashboard for analyzing SEO metrics such as authority score, organic traffic, organic keywords, paid keywords, ref. Domains.
Slide 25: This slide exhibit table of content that is to be discuss further.
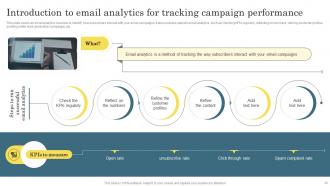
Slide 26: This slide covers an email analytics overview to identify how subscribers interact with your email campaigns.
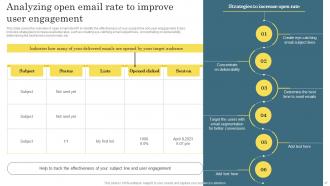
Slide 27: This slide covers the overview of open email rate KPI to identify the effectiveness of your subject line and user engagement.
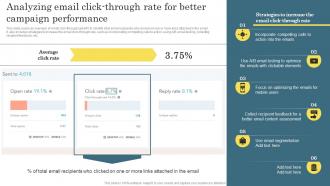
Slide 28: This slide covers an overview of email click-through rate KPI to identify total email recipients who clicked on one or more links attached in the email.
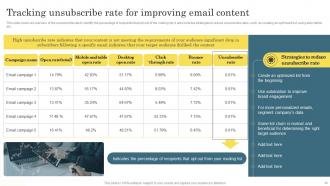
Slide 29: This slide covers an overview of the unsubscribe rate to identify the percentage of recipients that opt out of the mailing list.
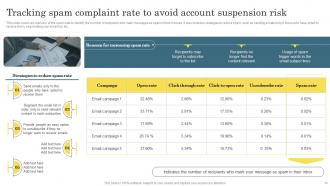
Slide 30: This slide covers an overview of the spam rate to identify the number of recipients who mark messages as spam in their inboxes.
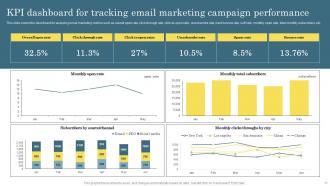
Slide 31: This slide covers the dashboard for analyzing email marketing metrics such as overall open rate, click-through rate, click-to-open ratio, unsubscribe rate.
Slide 32: This slide exhibit table of content that is to be discuss further.
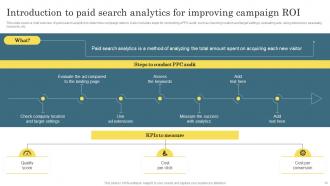
Slide 33: This slide covers a brief overview of paid search analytics to determine campaign returns.
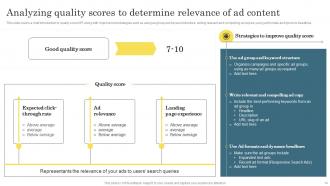
Slide 34: This slide covers a brief introduction to quality score KPI along with improvement strategies.
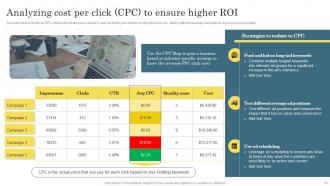
Slide 35: This slide briefly introduces CPC metrics and strategies to reduce it, such as finding and bidding on long tail keywords, testing different average ad positions.
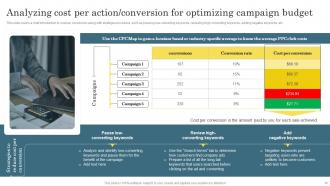
Slide 36: This slide covers a brief introduction to cost per conversion along with strategies to reduce.
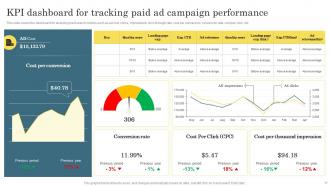
Slide 37: This slide covers the dashboard for analyzing paid search metrics such as ad cost, clicks, impressions, click-through rate, cost per conversion, conversion rate.
Slide 38: This slide exhibit table of content that is to be discuss further.
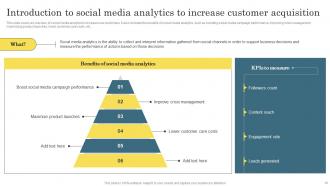
Slide 39: This slide covers an overview of social media analytics to increase new customers.
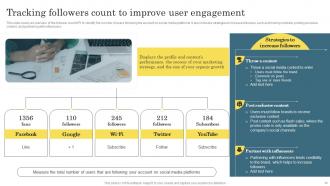
Slide 40: This slide covers an overview of the follower count KPI to identify the number of users following the account on social media platforms.
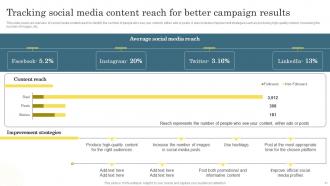
Slide 41: This slide covers an overview of social media content reach to identify the number of people who see your content, either ads or posts.
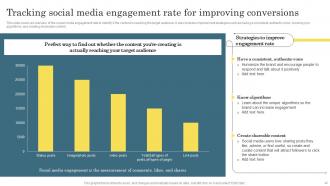
Slide 42: This slide covers an overview of the social media engagement rate to identify if the content is reaching the target audience.
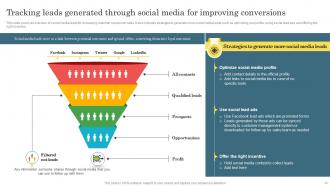
Slide 43: This slide covers an overview of social media leads for increasing customer conversion rates.
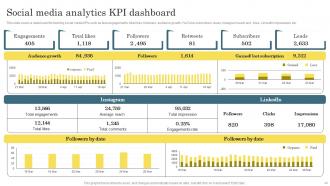
Slide 44: This slide covers a dashboard for tracking social media KPIs such as face engagements, total likes, followers, audience growth, YouTube subscribers, views.
Slide 45: This slide exhibit table of content that is to be discuss further.
Slide 46: This slide covers an overview of blog analytics to identify key factors for creating successful blogs.
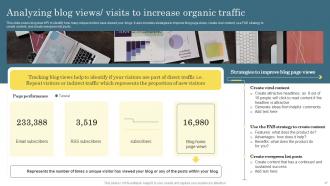
Slide 47: This slide covers blog view KPI to identify how many unique visitors have viewed your blogs.
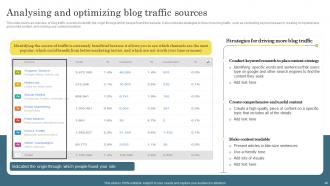
Slide 48: This slide covers an overview of blog traffic sources to identify the origin through which people found the website.
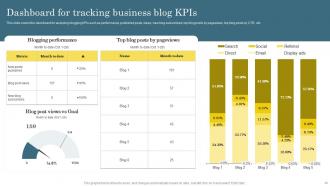
Slide 49: This slide covers the dashboard for analyzing blogging KPIs such as performance, published posts, views, new blog subscribers, top blog posts by pageviews.
Slide 50: This slide exhibit table of content that is to be discuss further.
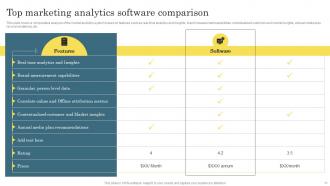
Slide 51: This slide covers a comparative analysis of the market analytics system based on features such as real-time analytics and insights, brand measurement capabilities.
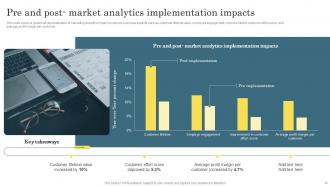
Slide 52: This slide covers a graphical representation of marketing analytics impact on various business aspects.
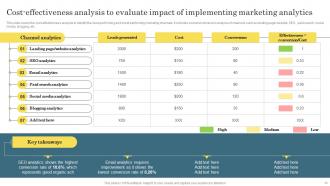
Slide 53: This slide covers the cost-effectiveness analysis to identify the best-performing and worst-performing marketing channels.
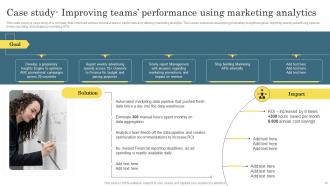
Slide 54: This slide covers a case study of a company that improved various business teams’ performance by utilizing marketing analytics.
Slide 55: This is the icons slide.
Slide 56: This slide presents title for additional slides.
Slide 57: This slide depicts 30-60-90 days plan for projects.
Slide 58: This slide display Venn diagram.
Slide 59: This slide depicts posts for past experiences of clients.
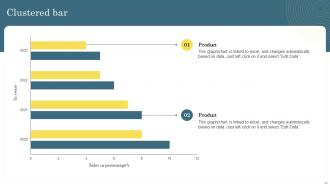
Slide 60: This slide display Clustered bar for different products.
Slide 61: This slide exhibits ideas generated.
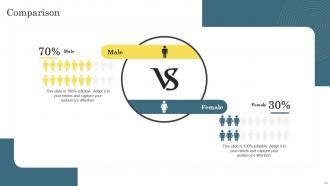
Slide 62: This slide showcase Comparison
Slide 63: This slide shows puzzle for displaying elements of company.
Slide 64: This slide display Roadmap.
Slide 65: This is thank you slide & contains contact details of company like office address, phone no., etc.
Digital Marketing Analytics For Better Business Growth Powerpoint Presentation Slides with all 70 slides:
Use our Digital Marketing Analytics For Better Business Growth Powerpoint Presentation Slides to effectively help you save your valuable time. They are readymade to fit into any presentation structure.


-
Templates are beautiful and easy to use. An amateur can also create a presentation using these slides. It is amazing.
-
The best part about SlideTeam is their meticulously prepared presentations (complete-decks and single-slides both), infused with high-quality graphics and easy to edit. All-in-all worthy products.