- Sub Categories
-
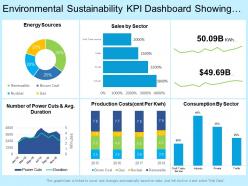 Environmental sustainability kpi dashboard showing total consumption sales energy sources
Presenting this set of slides with name - Environmental Sustainability Kpi Dashboard Showing Total Consumption Sales Energy Sources. This is a six stage process. The stages in this process are Environment Sustainability, Environment Continual, Environment Feasibility.
-
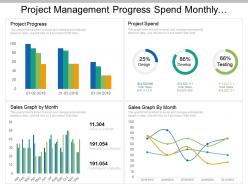 Project management progress spend monthly growth dashboard
Presentation design is easy download and can be changed into other software programs such as JPEG and PDF. Personalize the PowerPoint template with brand name, logo and image. Presentation slide is available with choice to download with different nodes and stages. Completely editable PPT slide can be edited as colors, icons, and text. Easy to present amongst large set of audience as accessible in widescreen view option. PowerPoint graphic can be merged with Google slides as fully compatible with them.
-
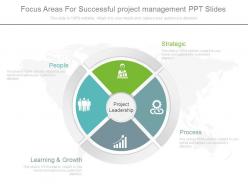 Apt focus areas for successful project management ppt slides
Presenting apt focus areas for successful project management ppt slides. This is a focus areas for successful project management ppt slides. This is four stage process. The stages in this proces are strategic, process, learning and growth, people.
-
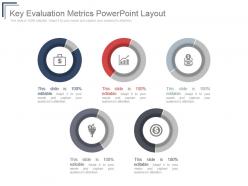 Key evaluation metrics powerpoint layout
Presenting key evaluation metrics powerpoint layout. This is a key evaluation metrics powerpoint layout. This is a five stage process. The stages in this process are icons, business, marketing, presentation, management.
-
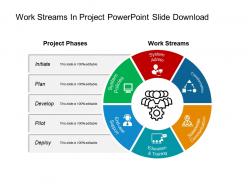 Work streams in project powerpoint slide download
Presenting work streams in project PowerPoint shape which is thoroughly editable and equipped with all that is needed by you to make an overall effective presentation. It has been designed professionally and can be edited according to the presenter’s needs and preferences. This PowerPoint shape is flexible with Google Slides, compatible with multiple softwares and format options. You can select from thousands of editable icons on each and every topic. Often used by sales managers, team head and / or business managers.
-
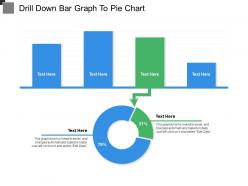 Drill down bar graph to pie chart
Presenting this set of slides with name - Drill Down Bar Graph To Pie Chart. This is a two stage process. The stages in this process are Drill Down, Hierarchy, Top Downwards.
-
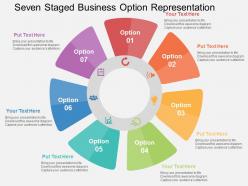 Seven staged business option representation flat powerpoint design
We are proud to present our seven staged business option representation flat powerpoint design. Seven staged business option diagram has been used to design this power point template diagram. This PPT diagram contains the concept of business option representation. Use this PPT diagram for business and finance related presentations.
-
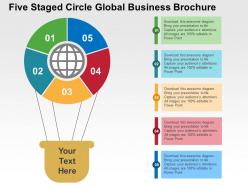 Five staged circle global business brochure flat powerpoint design
Completely editable five staged circle global business brochure PPT Slides including editable fonts, visuals, text, colors, etc. Compatible with number of software options. Excellence in picture quality. Beneficial for investors, shareholders, financiers, professors, students, marketers, sales people, etc. Presentation design can be displayed in standard and widescreen view. Personalize the presentation with individual company name and logo.
-
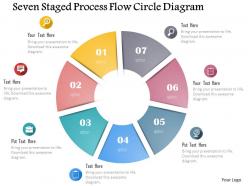 0115 seven staged process flow circle diagram powerpoint template
Wonderful quality images used in the Presentation illustration. High resolution PPT slide as can be projected on wide screen. Harmonious with maximum number of software i.e. JPG and PDF. Pleasant in usage with the available format options. Trouble free inclusion of company’s personalized content. Fully modifiable presentation vector, text, icons, graphics and image. Easy inclusion and exclusion of content as per industry requirement. PowerPoint graphic harmonized with Google slides. Beneficial for business professionals, analysts, strategists, students, teachers, etc.
-
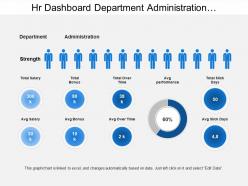 Hr dashboard department administration workforce strength
Presenting this set of slides with name - Hr Dashboard Department Administration Workforce Strength. This is a two stage process. The stages in this process are Hr Dashboard, Human Resource Dashboard, Hr Kpi.
-
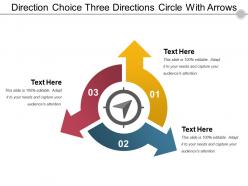 Direction choice three directions circle with arrows
Presenting direction choice three directions circle with arrows. This is a direction choice three directions circle with arrows. This is a three stage process. The stages in this process are direction choice, one to many, direction option.
-
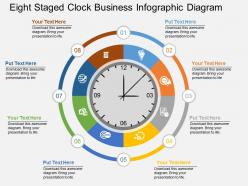 Fa eight staged clock business infographic diagram flat powerpoint design
Presenting fa eight staged clock business infographic diagram flat powerpoint design. Eight staged clock business info graphics diagram has been used to craft this power point template diagram. This PPT diagram contains the concept of time management. Use this PPT diagram for business and marketing related presentations.
-
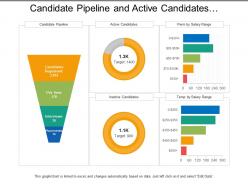 Candidate pipeline and active candidates recruitment dashboard
Presenting this set of slides with name - Candidate Pipeline And Active Candidates Recruitment Dashboard. This is a three stage process. The stages in this process are Staffing Plan, Recruitment, Staff Management.
-
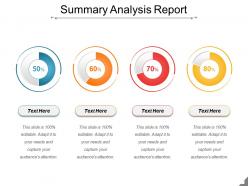 Summary analysis report presentation powerpoint example
Presenting Summary Analysis Report Presentation PowerPoint Example. It is fully editable in PowerPoint and the slide can be modified as per your requirements. Edit the fonts, colors and slide background. When you download the presentation, you get the PPT files in both widescreen (16:9) and standard screen (4:3) aspect ratio. Our presentation is compatible with Google Slides and can be saved in JPG or PDF format. Get this template with high resolution graphics and deliver presentations in no time.
-
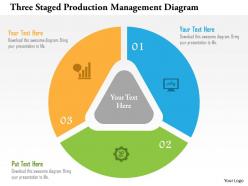 Three staged production management diagram flat powerpoint design
Runs extremely smooth and jitter-free on related software. PowerPoint images are of high resolution. Projection on widescreen doesn’t let PPT graphics to be pixelated. Fluent download of PPT slides. Further customize slide by inserting your company’s logo, trademark. Add titles and sub titles at will with no space constraints. Compatible with Google slides. Useful for startups, businesses and project management.
-
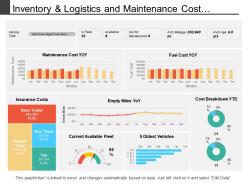 Inventory and logistics and maintenance cost dashboard
Presenting this set of slides with name - Inventory And Logistics And Maintenance Cost Dashboard. This is a three stage process. The stages in this process are Inventory And Logistics, Inventory Management, Warehousing And Inventory Management.
-
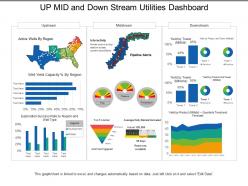 Up mid and down stream utilities dashboard
Presenting this set of slides with name - Up Mid And Down Stream Utilities Dashboard. This is a three stage process. The stages in this process are Utilities, Use, Advantage.
-
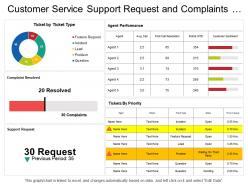 Customer service support request and complaints resolved dashboard
Presenting this set of slides with name - Customer Service Support Request And Complaints Resolved Dashboard. This is a three stage process. The stages in this process are Customer Base, Recurring Customers, Customer Services.
-
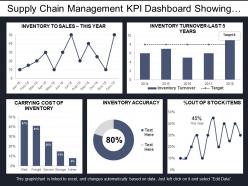 Supply chain management kpi dashboard showing inventory accuracy and turnover
Presenting this set of slides with name - Supply Chain Management Kpi Dashboard Showing Inventory Accuracy And Turnover. This is a five stage process. The stages in this process are Demand Forecasting, Predicting Future Demand, Supply Chain Management.
-
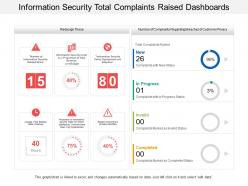 Information security total complaints raised dashboards
Presenting this set of slides with name - Information Security Total Complaints Raised Dashboards. This is a three stage process. The stages in this process are Information Security Strategy, Information Security Plan, Information Protection Strategy.
-
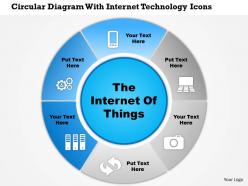 0814 Business Consulting Circular Diagram With Internet Technology Icons Powerpoint Slide Template
Presentation design can be downloaded with different nodes and stages. Entirely editable content including fonts, text, colors. Make it personalized the PowerPoint slide with company name and sign. Attuned with number of software options. Fantastic picture quality even on wide screen output. Effortless and rapid downloading. Easy option for conversion in PDF or JPEG documents.
-
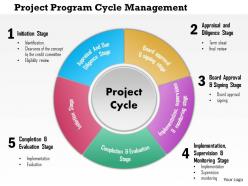 0814 project program cycle management powerpoint presentation slide template
Superlative quality images used in the presentation image. High resolution PowerPoint visual as can be projected on wide screen. Friendly with maximum number of software i.e. JPG and PDF. Stress free inclusion of content as per the industry requirement. Cordial in usage with the available format options. Totally adaptable PPT text, icons, graphics and image. Beneficial for project management leaders, executives, business management team etc.
-
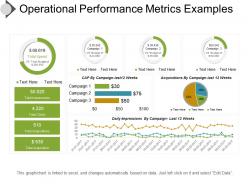 Operational performance metrics examples presentation ideas
Presenting operational performance metrics PPT image layout. This is competently constructed and readily useable PowerPoint template. Amend able subject matter, PowerPoint image, types, fonts etc. Prompt content with flexible option to insert company logo, trademark, or name. High resolution PPT template. Well served with all Google Slides. Projected on wide screen with high quality PPT graphic. Beneficial for the business managers and other professionals.
-
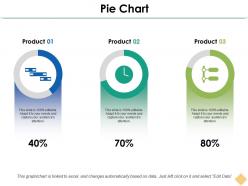 Pie chart ppt inspiration
Presenting this set of slides with name - Pie Chart Ppt Inspiration. This is a three stage process. The stages in this process are Business, Management, Strategy, Analysis, Icons.
-
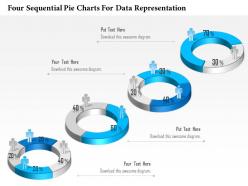 1114 four sequential pie charts for data representation presentation template
Easy proofing and editing is added on feature of presentation visual. Presentation slide is useful in business marketing, management and recourse disbursement. Basic theme yet it can modified with respect to font, color and layout. Attractive color scheme gives a professional look to PPT layout. Conversion into PDF or JPG formats is very easy and handy. PPT graphic offers font size which can be read from a distance.
-
 3d circular process templates 1
This template is skillfully designed and is completely editable to suit all the needs and requirements of the user. The color of the font, its size, style, and all other elements can be customized according to the user's desire The text in the PPT placeholder can be replaced with the desired information making this template highly flexible and adaptable as well. This template is also compatible with various Microsoft versions and formats like Google Slides, JPG, PDF, etc so the user will face no issue in saving it in the format of his choice.
-
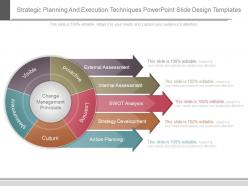 Strategic planning and execution techniques powerpoint slide design templates
Presenting strategic planning and execution techniques powerpoint slide design templates. This is a strategic planning and execution techniques powerpoint slide design templates. This is a five stage process. The stages in this process are Visible, Proactive, Learning, Culture, Management, Change Management Principals, External Assessment, Internal Assessment, Swot Analysis, Strategy Development, Action Planning.
-
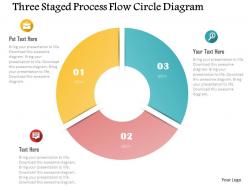 0115 three staged process flow circle diagram powerpoint template
Amazingly and innovatively created PowerPoint visual. Quick download and easy to share with large set of viewers. Convenience to modify the content as per the corporate requisite. PPT graphic accessible with different nodes and stages. Alternative to add business details such as icon, image or text. Flexible presentation design as smoothly convertible into JPG and PDF format. Slide downloadable in standard and widescreen display view.
-
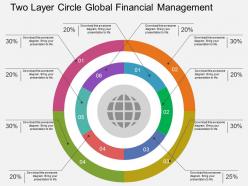 Cu two layer circle global financial management flat powerpoint design
Presenting cu two layer circle global financial management flat powerpoint design. Two layer circles have been used to craft this power point template diagram. This PPT diagram contains the concept of global financial management. Use this PPT diagram for business and finance related presentations.
-
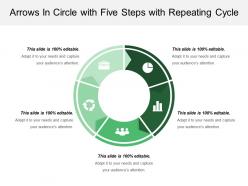 Arrows in circle with five steps with repeating cycle
Presenting this set of slides with name - Arrows In Circle With Five Steps With Repeating Cycle. This is a five stage process. The stages in this process are Arrows In Circle, Circular Arrow, Arrow In Round.
-
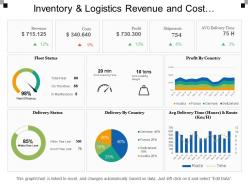 Inventory and logistics revenue and cost dashboards
Presenting this set of slides with name - Inventory And Logistics Revenue And Cost Dashboards. This is a three stage process. The stages in this process are Inventory And Logistics, Inventory Management, Warehousing And Inventory Management.
-
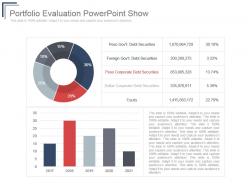 Portfolio evaluation powerpoint show
Presenting portfolio evaluation powerpoint show. This is a portfolio evaluation powerpoint show. This is a two stage process. The stages in this process are peso govt debt securities, foreign govt debt securities, peso corporate debt securities, dollar corporate debt securities, equity.
-
 Employees who leave within first 6 months powerpoint shapes
Presenting employees who leave within first 6 months powerpoint shapes. This is a employees who leave within first 6 months powerpoint shapes. This is a three stage process. The stages in this process are employees left job within the first 6 months, felt their boss was a jerk, work was different than they expected, changed their mind on work type.
-
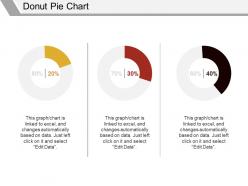 Donut pie chart powerpoint presentation
Presenting Donut Pie Chart Powerpoint Presentation PowerPoint slide. You can change the color, font size, font type and shapes of this PPT layout according to your needs. This PPT template is compatible with Google Slides and is available in both 4:3 and 16:9 aspect ratios. This ready to use PowerPoint presentation can be downloaded in various formats like PDF, JPG and PNG.
-
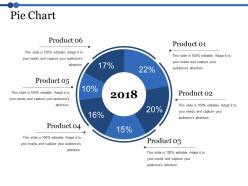 Pie chart ppt backgrounds
Pie Chart PPT Backgrounds PowerPoint template- a well-designed pie chart slide for visual presentation of data. This versatile PPT slide has both the standard as well as the wide-screen version available. You can easily choose from a variety of fonts, color schemes, images, and orientations on the PowerPoint interface to customize this PPT slide for your needs. This PPT model is compatible with Google Slides as well as Microsoft PowerPoint.
-
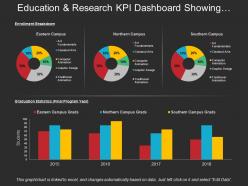 Education and research kpi dashboard snapshot showing enrolment breakdown
Presenting education and research KPI dashboard snapshot showing enrolment breakdown PPT slide. The student enrolment dashboard PowerPoint slide designed by the professional team of SlideTeam. The enrolment page KPI report template is fully editable in PowerPoint. The research enrolment KPI report PPT template is compatible with Google Slide so a user can share this enrolment dashboard slide with others. A user can make changes in the font size, font type, color as well as dimensions of the campus and college dashboard slide as per the requirement. You may edit the value in the enrollment reporting system dashboard template as the slide gets linked with the Excel sheet.
-
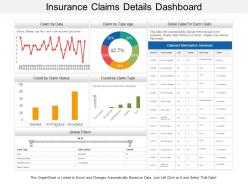 Insurance claims details dashboard
Presenting this set of slides with name - Insurance Claims Details Dashboard. This is a three stage process. The stages in this process are Assurance, Surety, Insurance.
-
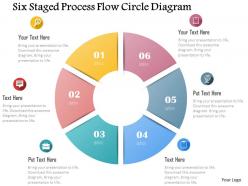 0115 six staged process flow circle diagram powerpoint template
We are proud to present our 0115 six staged process flow circle diagram powerpoint template. Six staged circle diagram has been used to craft this power point template diagram. This PPT contains the concept of process flow. Use this PPT and build an excellent presentation for business and sales process related topics.
-
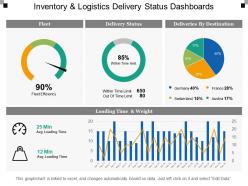 Inventory and logistics delivery status dashboards
Presenting this set of slides with name - Inventory And Logistics Delivery Status Dashboards. This is a four stage process. The stages in this process are Inventory And Logistics, Inventory Management, Warehousing And Inventory Management.
-
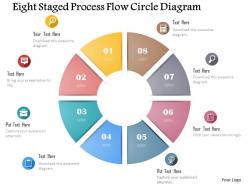 0115 eight staged process flow circle diagram powerpoint template
We are proud to present our 0115 eight staged process flow circle diagram powerpoint template. This power point template slide has been crafted with graphic of eight staged circle diagram. This PPT contains the concept of process flow. Use this PPT diagram for business and marketing related presentations.
-
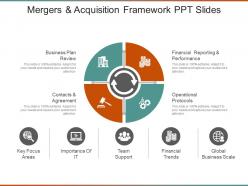 Mergers and acquisition framework ppt slides
Presenting mergers and acquisition framework ppt slides. This is a mergers and acquisition framework ppt slides. This is a four stage process. The stages in this process are business plan review, financial reporting and performance, contacts and agreement, operational protocols.
-
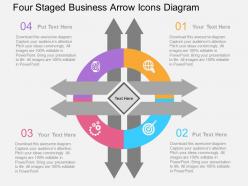 Four staged business arrow icons diagram flat powerpoint design
Proofing and editing can be done with ease in PPT design. Presentation slide is of utmost use to management professionals, big or small organizations and business startups. Smooth functioning is ensured by the presentation slide show on all software’s. When projected on the wide screen the PPT layout does not sacrifice on pixels or color resolution.
-
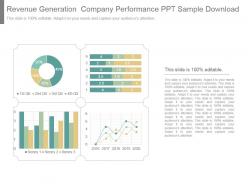 Revenue generation company performance ppt sample download
Presenting revenue generation company performance ppt sample download. This is a revenue generation company performance ppt sample download. This is a four stage process. The stages in this process are business, management, analysis, strategy, success.
-
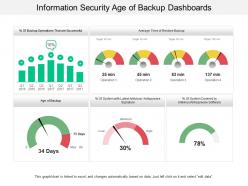 Information security age of backup dashboards
Presenting this set of slides with name - Information Security Age Of Backup Dashboards. This is a five stage process. The stages in this process are Information Security Strategy, Information Security Plan, Information Protection Strategy.
-
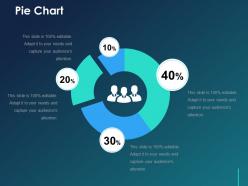 Pie chart ppt slide
Presenting our Pie Chart PPT Slide. The template is fully editable in PowerPoint and compatible with Google Slides as well. You can adapt the slideshow according to your unique business requirements. Add your text, image, or icon with ease. The template can be converted into different formats such as JPG, PDF, etc. without any hassle. High-quality graphics ensure an attention-grabbing presentation. Additionally, it is available in both 4:3 and 16:9 aspect ratios.
-
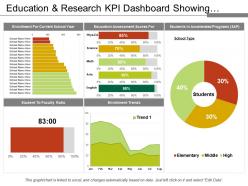 Education and research kpi dashboard snapshot showing enrolment and sap
Presenting education and research KPI dashboard snapshot showing enrolment and SAP PPT slide. The enrolment and SAP analytic KPI dashboard PowerPoint template designed by the professional team of SlideTeam. The SAP package KPI report slide is fully editable in PowerPoint. The research SAP dashboard presentation slide is compatible with Google Slide so a user can share this SAP analytic dashboard slide with others. A user can make changes in the font size, font type, color as well as dimensions of the SAP analytics cloud business content dashboard PowerPoint template as per the requirement.
-
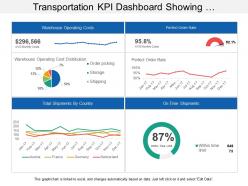 Transportation kpi dashboard showing warehouse operating costs perfect order rate
Presenting transportation KPI dashboard showing warehouse operating costs perfect order rate PPT slide. This layout is fully compatible with Google slides and data driven. User can edit the data in linked excel sheet and graphs and charts gets customized accordingly. Easy to put in company logo, trademark or name; accommodate words to support the key points. Images do no distort out even when they are projected on large screen. Adjust colors, text and fonts as per your business requirements.
-
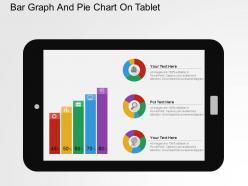 Bar graph and pie chart on tablet flat powerpoint design
Easy proofing and editing is added on feature of presentation visual. Presentation slide is useful in business marketing, management and recourse disbursement. Basic theme yet it can modified with respect to font, color and layout. Attractive color scheme gives a professional look to PPT layout. Conversion into PDF or JPG formats is very easy and handy. PPT graphic offers font size which can be read from a distance.
-
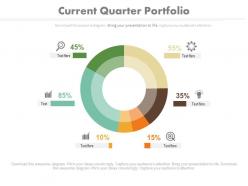 Apt current quarter portfolio for business analysis powerpoint slides
Other than providing you with an excellent experience this PPT slide can be used by professionals for discussing financial and business matters using a flow chart. You can easily ungroup the elements shown in the diagram and according to your liking. Download this slide and insert your company's logo for a professional look and experience it in full screen version.
-
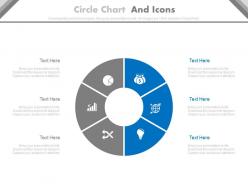 Six staged circle chart and icons powerpoint slides
Perfect with various organization alternatives like JPEG or PDF. Simplicity of adjusting PowerPoint hues, shades and introduction. Flexibility to redo it with organization name and logo. Access to incorporation and avoidance of substance according to particular needs of any business. High determination with stunning picture quality. Zero issue of obscure picture, when anticipated on wide screen. Good with various programming choices.
-
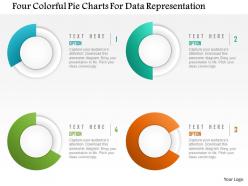 0115 four colorful pie charts for data representation powerpoint template
The template is stuffed with innumerable features of easy customization, high-resolution image quality, easy download facility in various file formats etc. Play the template in Google Slides for a convenient showcase. Experience the absolute ease in alteration with its user-friendly interface. No space constraints involved in writing the content section.
-
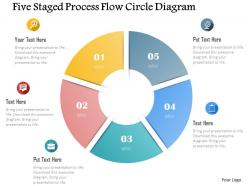 0115 five staged process flow circle diagram powerpoint template
We are proud to present our 0115 five staged process flow circle diagram powerpoint template. Five staged process flow diagram has been used to craft this power point template. This PPT diagram contains the concept of data and process flow .Use this PPT for business and data related presentations.
-
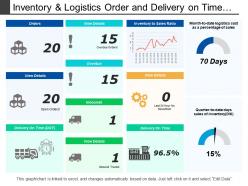 Inventory and logistics order and delivery on time dashboards
Presenting this set of slides with name - Inventory And Logistics Order And Delivery On Time Dashboards. This is a four stage process. The stages in this process are Inventory And Logistics, Inventory Management, Warehousing And Inventory Management.
-
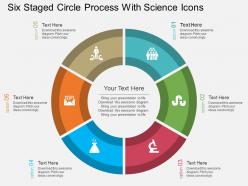 Bn six staged circle process with science icons flat powerpoint design
Presenting bn six staged circle process with science icons flat powerpoint design. Six staged circle process diagram and icons has been used to craft this power point template diagram. This PPT diagram contains the concept of scientific process flow representation. Use this PPT diagram for business and science related presentations.
-
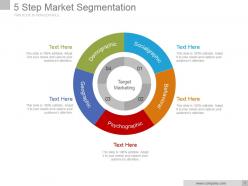 5 step market segmentation powerpoint presentation examples
Presenting 5 step market segmentation powerpoint presentation examples. This is a 5 step market segmentation powerpoint presentation examples. This is a five stage process. The stages in this process are demographic, socialgraphic, behavioral, psychographic, geographic.
-
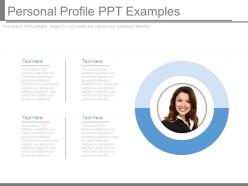 Personal profile ppt examples
Presenting personal profile ppt examples. This is a personal profile ppt examples. This is a one stage process. The stages in this process are business, marketing, people, success, strategy.
-
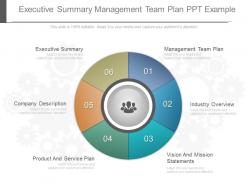 Executive summary management team plan ppt example
Presenting executive summary management team plan ppt example. This is a executive summary management team plan ppt example. This is a six stage process. The stages in this process are executive summary, management team plan, industry overview, vision and mission statements, product and service plan, company description.
-
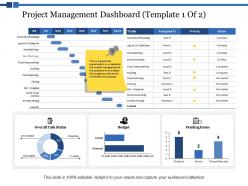 Project management dashboard final resource plan ppt powerpoint presentation styles objects
This is a three stages process. The stages in this process are Finance, Marketing, Management, Investment, Analysis.
-
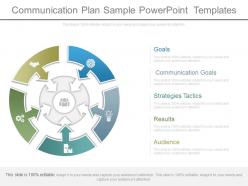 Communication plan sample powerpoint templates
Presenting communication plan sample powerpoint templates. This is a communication plan sample powerpoint templates. This is a five stage process. The stages in this process are goals, communication goals, strategies tactics, results, audience.
-
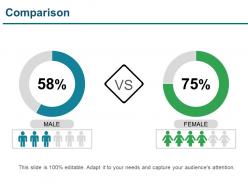 Comparison presentation powerpoint templates
Presenting our Comparison Presentation PowerPoint Templates. This PPT theme is available in both 4:3 and 16:9 aspect ratios. Choose this PPT graphic to display apt and suitable comparative graphs, charts, and images. This PPT layout is 100% adaptable allowing you to modify the font, color, font size, and shapes. This PPT presentation is also Google Slides compatible making it easily accessible. Without further ado, click the download button!


