Drill down report powerpoint show

Rating:
90%
Drill down report powerpoint show
Slide 1 of 5
Favourites Favourites

Try Before you Buy Download Free Sample Product

Audience Impress Your
Audience
Editable 100%
Editable
Time Save Hours
of Time
The Biggest Sale is ending soon in
0
0
:
0
0
:
0
0
Rating:
90%
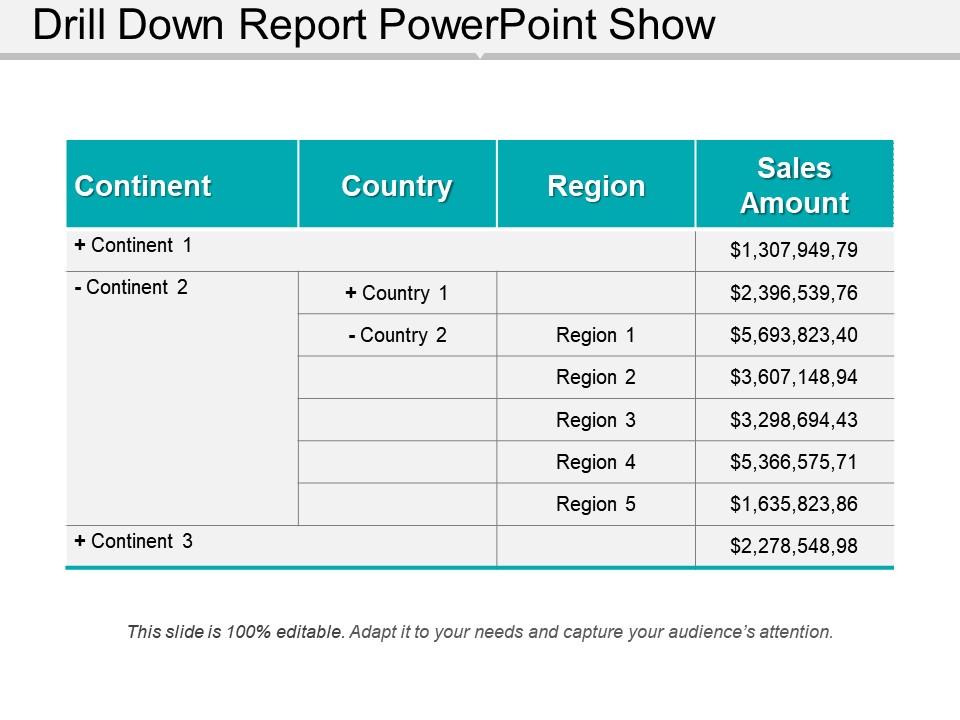
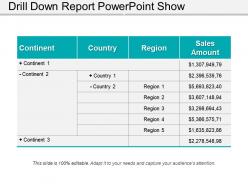
Presenting Drill Down Report PowerPoint Show. This slide is 100% editable and designed professionally for your benefit. You can alter the color, font, font size and font types as per your needs. Modify the shape and color of your diagram to make your presentation more engaging. It is easily compatible with the Google Slides. Can be converted into various formats like PDF, JPG and PNG.

People who downloaded this PowerPoint presentation also viewed the following :

FAQs for Drill down

A drill down report is an interactive reporting system that allows users to navigate from high-level summary data to increasingly detailed information by clicking on specific data points or categories. Unlike standard reports that present fixed, static information at one level of detail, drill down reports enable dynamic exploration, letting users seamlessly transition from executive dashboards to granular transactional data, ultimately delivering enhanced analytical flexibility and faster decision-making capabilities.

Drill down reports are most beneficial when businesses need to investigate performance anomalies, analyze revenue patterns across different segments, track operational metrics by department, and understand customer behavior trends. These reports enable managers to identify root causes of issues, optimize resource allocation, and make data-driven decisions, with many organizations finding that detailed analysis ultimately delivers faster problem resolution and improved strategic planning.

Drill down reports enhance decision-making by providing layered data analysis, enabling executives to explore summary metrics and investigate underlying details, root causes, and performance drivers. Through interactive navigation from high-level dashboards to granular transactions, organizations streamline problem identification, accelerate response times, and improve strategic planning, with many financial services and retail companies finding that detailed visibility ultimately delivers faster, more informed business decisions.

Key components include executive summary, hierarchical data structure, interactive navigation elements, detailed metrics breakdowns, and supporting visualizations. These elements work together by providing stakeholders with comprehensive overview capabilities while enabling granular analysis, with many organizations finding that structured drill-down functionality enhances decision-making speed, improves data transparency, and ultimately delivers more targeted strategic insights across departments.

Visualization tools enhance drill down reports by transforming complex data into interactive charts, graphs, and dashboards that enable intuitive navigation between summary and detailed views. These visual elements streamline data interpretation, reduce analysis time, and improve decision-making accuracy, with many organizations finding that employees can identify trends and anomalies significantly faster than traditional text-based reports.

**INPUT**: What types of data can be effectively represented in a drill down report? **OUTPUT**: Drill down reports effectively represent sales performance data, financial metrics, customer analytics, operational KPIs, and project management statistics. These hierarchical data structures enable organizations to examine high-level trends, then progressively explore specific regions, departments, or time periods, with many businesses finding that layered analysis delivers faster decision-making and enhanced strategic insights. [Word count: 56 words]

Drill down reporting enhances data analysis by enabling users to navigate from high-level summaries to granular details, uncovering root causes, identifying trends, and exploring specific data segments. This hierarchical approach streamlines decision-making processes by providing contextual depth, with organizations in retail, finance, and healthcare finding that detailed exploration ultimately delivers faster problem resolution and more strategic insights.

Financial services, healthcare, retail, manufacturing, and telecommunications most commonly utilize drill down reports for their complex, multi-layered data structures requiring detailed analysis. These industries benefit from examining high-level metrics before investigating underlying causes, with banks using them for risk assessment, hospitals for patient outcomes, and retailers for sales performance, ultimately enabling faster decision-making and operational efficiency.

Creating interactive drill down reports involves designing hierarchical data structures, implementing clickable navigation elements, establishing parent-child relationships between data levels, and configuring dynamic filtering capabilities. Through business intelligence tools like Tableau or Power BI, organizations streamline complex data analysis by enabling users to click from summary metrics to detailed transactions, ultimately delivering faster insights and enhanced decision-making capabilities across departments.

Common pitfalls include creating overly complex navigation paths, failing to maintain consistent design elements across drill levels, lacking clear breadcrumb trails, and overwhelming users with too much granular data. These design flaws can significantly reduce user adoption and analytical effectiveness, with many organizations finding that streamlined navigation, consistent visual hierarchies, and strategic data filtering ultimately deliver better insights and enhanced user experiences across departments.

User experience drives drill down report design through intuitive navigation structures, clear visual hierarchies, and responsive interface elements that minimize cognitive load. These reports enhance usability by providing seamless transitions between summary and detailed views, logical data progression, and consistent formatting patterns, with many organizations finding that well-designed interfaces significantly improve decision-making speed and user adoption rates.

**INPUT**: What software or tools are best suited for creating detailed drill down reports? **OUTPUT**: Leading drill down reporting tools include Tableau, Power BI, QlikView, Looker, and IBM Cognos Analytics, each offering interactive data exploration capabilities. These platforms streamline analytical workflows by enabling hierarchical navigation, dynamic filtering, and multi-dimensional analysis, with many organizations finding that strategic tool selection ultimately delivers faster insights, enhanced decision-making, and significant competitive advantage across departments. [Word count: 58 words]

Drill down reporting enhances financial analysis by enabling users to navigate from high-level summaries to granular transaction details, identifying variances, trends, and anomalies across revenue streams, expense categories, and cost centers. This capability streamlines forecasting accuracy through detailed historical data examination, with many financial institutions and corporate finance teams finding that interactive exploration of budget-to-actual comparisons ultimately delivers more precise predictions and strategic insights.

Drill down reports enable sales and marketing teams to identify high-performing segments, optimize resource allocation, track campaign effectiveness, and uncover customer behavior patterns across different demographics. Through interactive data exploration, organizations can pinpoint which products, regions, or customer segments drive the highest ROI, while streamlining decision-making processes and ultimately delivering more targeted strategies and improved conversion rates.

Training teams to effectively interpret drill down reports involves structured education on data navigation, pattern recognition, and analytical thinking, combined with hands-on practice using real organizational data. Through interactive workshops, scenario-based exercises, and mentorship programs, teams develop skills to identify key trends, ask relevant questions, and translate insights into actionable strategies, ultimately enabling faster decision-making and improved business outcomes.

Ratings and Reviews

90% of 100
Review Form
Write a review
Most Relevant Reviews
  1. 100%

    by Dante Wells

    The content is very helpful from business point of view.
  2. 80%

    by Byrne Cruz

    Innovative and attractive designs.

2 Item(s)

per page: