

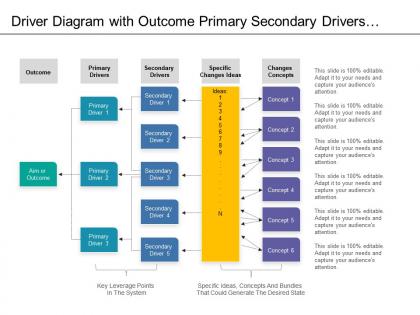
Driver diagram with outcome primary secondary drivers change ideas and concepts


Try Before you Buy Download Free Sample Product
 Impress Your
 Audience
Editable
of Time


Get it done in a better fashion with our Driver Diagram With Outcome Primary Secondary Drivers Change Ideas And Concepts. Be able to influence the implementation.
People who downloaded this PowerPoint presentation also viewed the following :
Driver diagram with outcome primary secondary drivers change ideas and concepts with all 5 slides:
Everything you do contributes to your professional image. Upgrade your presentations with high quality Driver Diagram With Outcome Primary Secondary Drivers Change Ideas And Concepts.

FAQs for Driver diagram with outcome primary secondary drivers change
A driver diagram is a visual tool that maps the relationship between a primary outcome, key drivers that influence that outcome, and specific change ideas or interventions. In project management and improvement processes, it helps teams identify root causes, prioritize initiatives, and track progress systematically, with many organizations in healthcare, manufacturing, and financial services finding that driver diagrams streamline strategic planning and enhance project success rates.
Driver diagrams help identify cause-and-effect relationships by visually mapping primary drivers, secondary drivers, and outcome measures in hierarchical structures that reveal interconnections between system components. Through systematic decomposition of complex processes, organizations in healthcare, manufacturing, and financial services can trace root causes, anticipate downstream impacts, and optimize interventions, ultimately enabling more strategic decision-making and improved system performance.
Driver diagrams include primary drivers, secondary drivers, change ideas, and outcome measures, all connected through logical cause-and-effect relationships. These components work together by linking strategic aims to specific interventions, enabling organizations across healthcare, manufacturing, and financial services to visualize improvement pathways, prioritize initiatives, and ultimately deliver measurable results while maintaining clear accountability throughout transformation processes.
Driver diagrams prove most beneficial when tackling complex, multi-faceted challenges requiring clear cause-and-effect relationships, such as reducing hospital readmission rates, improving customer satisfaction scores, or enhancing operational efficiency across departments. While traditional project planning tools focus on tasks and timelines, driver diagrams enable teams to visualize interconnected factors and strategic interventions, ultimately delivering targeted solutions with measurable outcomes.
Driver diagrams integrate seamlessly into PDSA cycles by providing structured frameworks that identify root causes, key interventions, and measurable outcomes before testing begins. During the Plan phase, teams use driver diagrams to select specific change ideas for testing, while Study phases evaluate which drivers most effectively move primary outcomes, ultimately enabling healthcare organizations, manufacturing facilities, and service companies to accelerate improvement cycles and achieve sustainable results.
Stakeholder engagement ensures driver diagrams reflect diverse perspectives, accurate problem understanding, and comprehensive solution pathways through collaborative input from frontline staff, management, and subject matter experts. This inclusive approach enhances buy-in, identifies overlooked drivers, and validates cause-effect relationships, with many organizations finding that engaged stakeholders ultimately deliver more actionable insights and sustainable improvement outcomes.
Driver diagrams assist teams in prioritizing by visually mapping the relationship between primary drivers, secondary drivers, and specific interventions, creating a clear hierarchy of impact and effort required. Through this structured approach, teams can focus resources on high-impact changes first, align stakeholders around shared priorities, and systematically address root causes, with many organizations finding that this methodology streamlines decision-making and accelerates improvement outcomes.
Common pitfalls include creating overly complex diagrams with too many drivers, failing to establish clear causal relationships between primary and secondary drivers, and neglecting to involve key stakeholders in the development process. Organizations often struggle with making drivers too vague or unmeasurable, while successful implementations focus on specific, actionable drivers that directly connect to measurable outcomes and strategic objectives.
Visualization techniques enhance driver diagrams by incorporating color coding to prioritize key drivers, flowcharts to illustrate causal relationships, and interactive dashboards for real-time monitoring. These visual elements streamline complex data interpretation, enable faster strategic decision-making, and improve stakeholder engagement across departments, with many organizations finding that enhanced visual clarity ultimately accelerates performance improvement initiatives and drives measurable business outcomes.
Healthcare driver diagrams include reducing hospital-acquired infections, decreasing readmission rates, improving medication adherence, enhancing patient satisfaction scores, and streamlining emergency department wait times. These frameworks enable healthcare organizations by connecting specific interventions to measurable outcomes, facilitating systematic improvement processes, and ultimately delivering enhanced patient care while reducing operational costs across hospitals, clinics, and healthcare systems.
Driver diagrams facilitate stakeholder alignment by providing a visual framework that maps shared objectives to specific interventions, creating common understanding across diverse perspectives and expertise levels. Teams use these structured tools to encourage collaborative dialogue, identify interdependencies between different functional areas, and ensure all stakeholders contribute insights toward unified strategic outcomes, ultimately streamlining decision-making processes.
**INPUT**: What software tools or templates are available to help create and share driver diagrams? **OUTPUT**: Driver diagram creation tools include Microsoft Visio, Lucidchart, Miro, SmartDraw, and specialized improvement platforms like Minitab Engage. These platforms streamline diagram development by offering pre-built templates, real-time collaboration features, and integration capabilities, with many healthcare systems and manufacturing organizations finding that cloud-based solutions enhance team alignment and accelerate improvement initiatives.
Driver diagram effectiveness can be measured through outcome metrics aligned with your primary aim, process measures tracking intermediate drivers, and balancing measures monitoring unintended consequences. Organizations typically assess progress using statistical process control charts, before-and-after comparisons, and stakeholder feedback, with many finding that regular measurement cycles enhance continuous improvement efforts while demonstrating tangible operational improvements.
Driver diagrams evolve through continuous refinement of primary drivers based on performance data, addition of new secondary drivers as teams identify previously overlooked factors, and adjustment of measurement strategies as projects reveal more effective indicators. Through regular review cycles, organizations in healthcare, manufacturing, and service sectors enhance their driver relationships, strengthen causal linkages, and ultimately deliver more targeted improvement outcomes, with many finding that iterative updates significantly improve project success rates.
Organizations can train personnel on driver diagrams through structured workshops covering diagram construction principles, facilitation techniques, and data interpretation methods, combined with hands-on practice sessions and mentoring programs. Many companies find success implementing pilot projects where teams apply driver diagrams to real operational challenges, enabling staff to develop proficiency while delivering measurable improvements in project outcomes and strategic alignment.
-
Innovative and Colorful designs.
-
Out of the box and creative design.