Efficient Social Media Dashboard Analysis For Social Media Marketing Campaigns
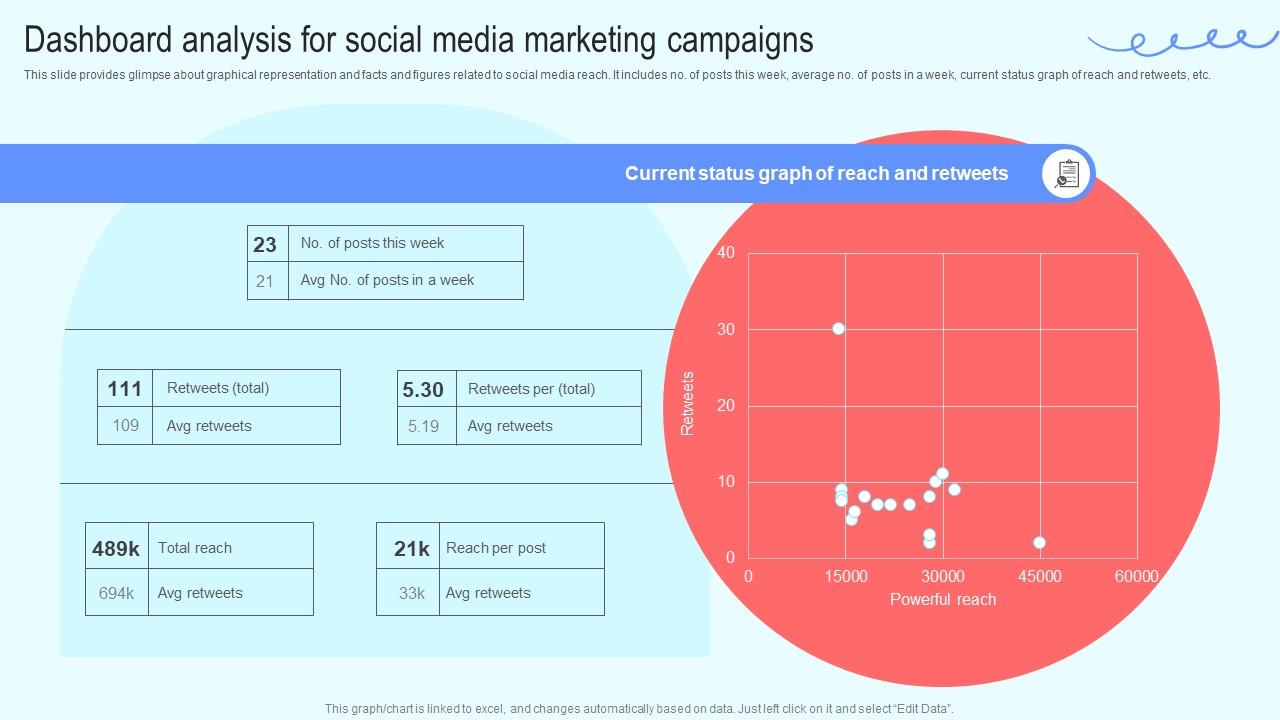
This slide provides glimpse about graphical representation and facts and figures related to social media reach.It includes no.of posts this week, average no.of posts in a week, current status graph of reach and retweets, etc.
This slide provides glimpse about graphical representation and facts and figures related to social media reach.It includes ..
- Google Slides is a new FREE Presentation software from Google.
- All our content is 100% compatible with Google Slides.
- Just download our designs, and upload them to Google Slides and they will work automatically.
- Amaze your audience with SlideTeam and Google Slides.
-
Want Changes to This PPT Slide? Check out our Presentation Design Services
- WideScreen Aspect ratio is becoming a very popular format. When you download this product, the downloaded ZIP will contain this product in both standard and widescreen format.
-

- Some older products that we have may only be in standard format, but they can easily be converted to widescreen.
- To do this, please open the SlideTeam product in Powerpoint, and go to
- Design ( On the top bar) -> Page Setup -> and select "On-screen Show (16:9)” in the drop down for "Slides Sized for".
- The slide or theme will change to widescreen, and all graphics will adjust automatically. You can similarly convert our content to any other desired screen aspect ratio.
Compatible With Google Slides

Get This In WideScreen
You must be logged in to download this presentation.
PowerPoint presentation slides
This slide provides glimpse about graphical representation and facts and figures related to social media reach. It includes no. of posts this week, average no. of posts in a week, current status graph of reach and retweets, etc. Present the topic in a bit more detail with this Efficient Social Media Dashboard Analysis For Social Media Marketing Campaigns. Use it as a tool for discussion and navigation on Avg Retweets, Posts In A Week. This template is free to edit as deemed fit for your organization. Therefore download it now.
People who downloaded this PowerPoint presentation also viewed the following :
Efficient Social Media Dashboard Analysis For Social Media Marketing Campaigns with all 11 slides:
Use our Efficient Social Media Dashboard Analysis For Social Media Marketing Campaigns to effectively help you save your valuable time. They are readymade to fit into any presentation structure.
-
Graphics are very appealing to eyes.
-
“Detailed and great to save your time.”


