


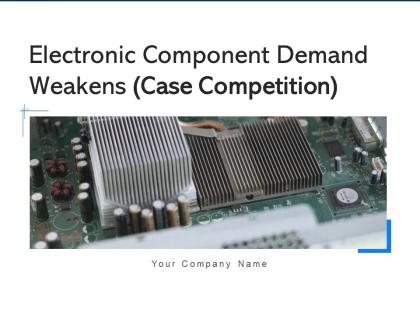
Electronic component demand weakens case competition powerpoint presentation slides


Try Before you Buy Download Free Sample Product
 Impress Your
 Audience
Editable
of Time


Our Electronic Component Demand Weakens Case Competition Powerpoint Presentation Slides are topically designed to provide an attractive backdrop to any subject. Use them to look like a presentation pro.
People who downloaded this PowerPoint presentation also viewed the following :
Content of this Powerpoint Presentation
Slide 1: This slide displays title i.e. 'Electronic Component Demand Weakens (Case Competition)' and your Company Name.
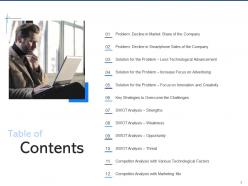
Slide 2: This slide presents table of contents.
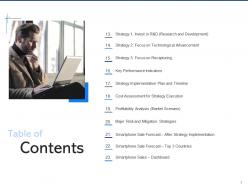
Slide 3: This slide also shows table of contents.
Slide 4: This slide shows the market share of the company which is continuously decline from the years 2014 to 2020 (till Feb.).
Slide 5: This slide shows the smartphone sales of the company (in Global market and in developing countries).
Slide 6: The slide shows the company’s problem (less technological advancement) and solution to mitigate the risk associated with the problem.
Slide 7: The slide shows the company’s problem (Decline in the sales of the company from six years) and solution to mitigate the risk.
Slide 8: The slide shows the company’s problem (Lack of Innovation) and solution to mitigate the risk associated with the problem.
Slide 9: This slide shows the key strategies to overcome the challenges which includes spend more on R&D Activities, etc.
Slide 10: The slide shows the key strong points of the company which includes Brand Name, etc.
Slide 11: The slide shows the weakness of the company which includes Low Product quality, etc.
Slide 12: The slide shows the key Opportunities of the company which includes Increase in Customer Spending, etc.
Slide 13: The slide shows the threat of the company which includes Competitive Market, Low cost threat, Laws and Regulations etc.
Slide 14: The slide shows the competitor’s analysis which includes different factors i.e. CPU, Display, RAM, etc.
Slide 15: The slide shows the competitor analysis on the basis of marketing mix (Product, Price, Place and Promotion) with other competitors.
Slide 16: The slide explains the investment in Research and Development strategy of the company.
Slide 17: The slide explains the strategy to focus on technological advancement by the company.
Slide 18: The slide explains the ‘Focus on Recapturing’ strategy of the company.
Slide 19: The slide shows the key Performance Indicator (KPI)s which will help the company to track the success rate of implemented strategies.
Slide 20: The slide shows the timeline of strategy implementation in the next five years.
Slide 21: The slide shows the estimation of major cost involved in the next five years (2019-2023) for implementing the strategies.
Slide 22: The slide shows the profitability analysis of the company (after implementing the strategy).
Slide 23: The slide shows the Anticipated risk face by the company with their level of risk (Low, Medium and High).
Slide 24: The slide shows the forecasted number of smartphone sale by the company ABC in next six years (2020-2025).
Slide 25: The slide shows the forecasted smartphone sale of company ABC in top three countries (United States, China, India).
Slide 26: This slide shows the dashboard related to smartphone market overview, revenue and sales of the company with top smartphones with their details.
Slide 27: This is the icons slide.
Slide 28: This slide presents title for additional slides.
Slide 29: This slide exhibits yearly line charts for different products. The charts are linked to Excel.
Slide 30: This slide displays yearly expenditure column charts for different products. The charts are linked to Excel.
Slide 31: This slide shows about your company, target audience and its client's values.
Slide 32: This slide presents goals.
Slide 33: This slide showcases financials.
Slide 34: This slide depicts posts for past experiences of clients.
Slide 35: This slide exhibits yearly timeline.
Slide 36: This slide shows details of team members like name, designation, etc.
Slide 37: This slide displays puzzle.
Slide 38: This slide highlights comparison of products based on selects.
Slide 39: This slide displays Venn.
Slide 40: This is thank you slide & contains contact details of company like office address, phone no., etc.
Electronic component demand weakens case competition powerpoint presentation slides with all 40 slides:
Use our Electronic Component Demand Weakens Case Competition Powerpoint Presentation Slides to effectively help you save your valuable time. They are readymade to fit into any presentation structure.
-

Electronic Component Demand Weakens Case Competition
-
Electronic Component Demand Weakens Case Competition
-
Electronic Component Demand Weakens Case Competition
-
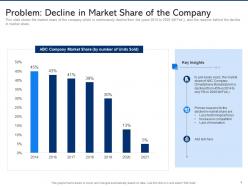
Decline in Market Share of the Company
-
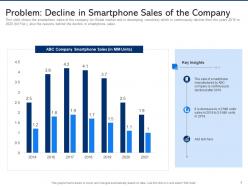
Decline in Smartphone Sales of the Company
-
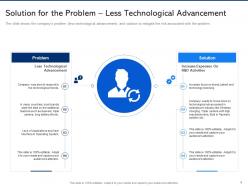
Solution for the Problem Less Technological Advancement
-
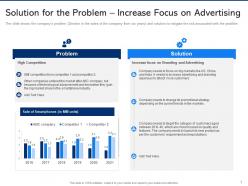
Solution for the Problem Increase Focus on Advertising
-
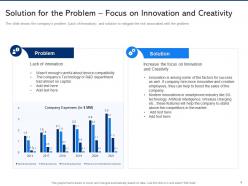
Solution for the Problem Focus on Innovation and Creativity
-
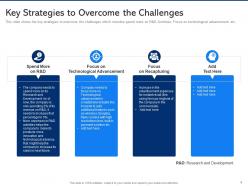
Key Strategies to Overcome the Challenges
-
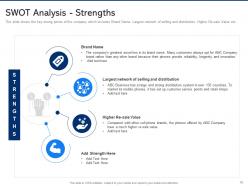
SWOT Analysis Strengths
-
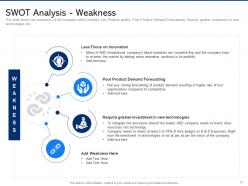
SWOT Analysis Weakness
-
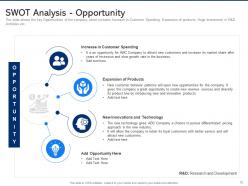
SWOT Analysis Opportunity
-

SWOT Analysis Threat
-
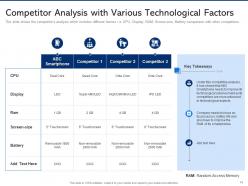
Competitor Analysis with Various Technological Factors
-
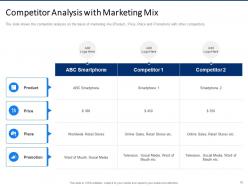
Competitor Analysis with Marketing Mix
-
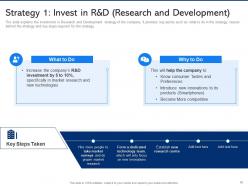
Strategy 1 Invest in R D Research and Development
-
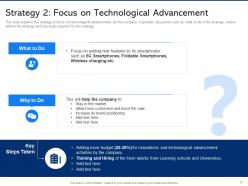
Strategy 2 Focus on Technological Advancement
-
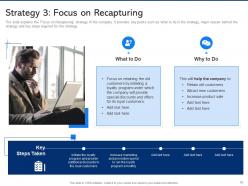
Focus on Recapturing Strategy Slide
-
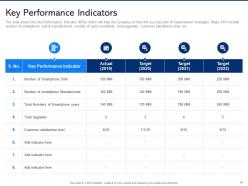
Key Performance Indicators
-
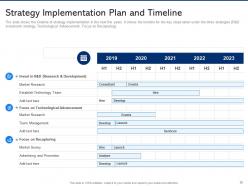
Strategy Implementation Plan and Timeline
-
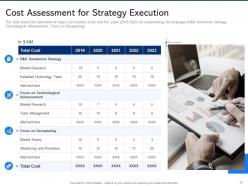
Cost Assessment for Strategy Execution
-
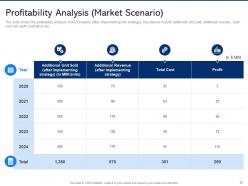
Profitability Analysis Market Scenario
-
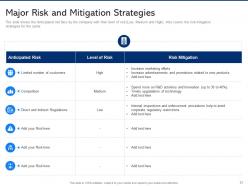
Major Risk and Mitigation Strategies
-
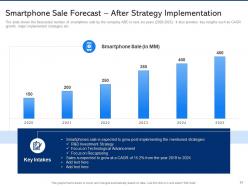
Smartphone Sale Forecast After Strategy Implementation
-
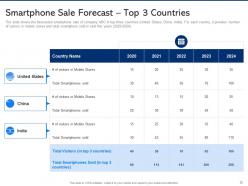
Smartphone Sale Forecast Top 3 Countries
-
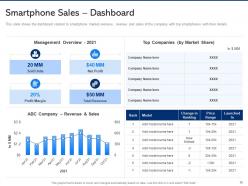
Smartphone Sales Dashboard
-
Electronic Component Demand Weakens Case Competition Icons Slide
-
Additional Slides
-
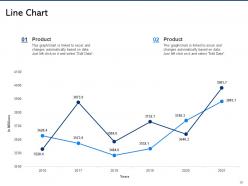
Line Chart
-
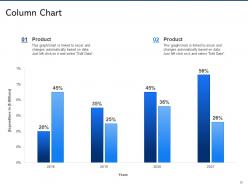
Column Chart
-
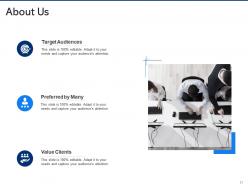
About Us
-
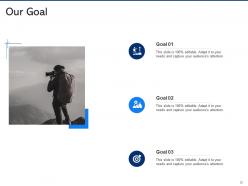
Our Goal
-
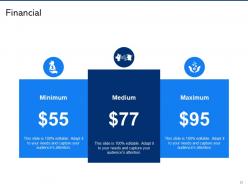
Financial
-
Post It Notes
-
Timeline
-

Our Team
-
Puzzle
-
Comparison
-
Venn
-

Thank You
-
Content of slide is easy to understand and edit.
-
Amazing product with appealing content and design.
-
Understandable and informative presentation.
-
Easily Editable.