Enterprise Quarterly Income And Expenditure Bar Graph
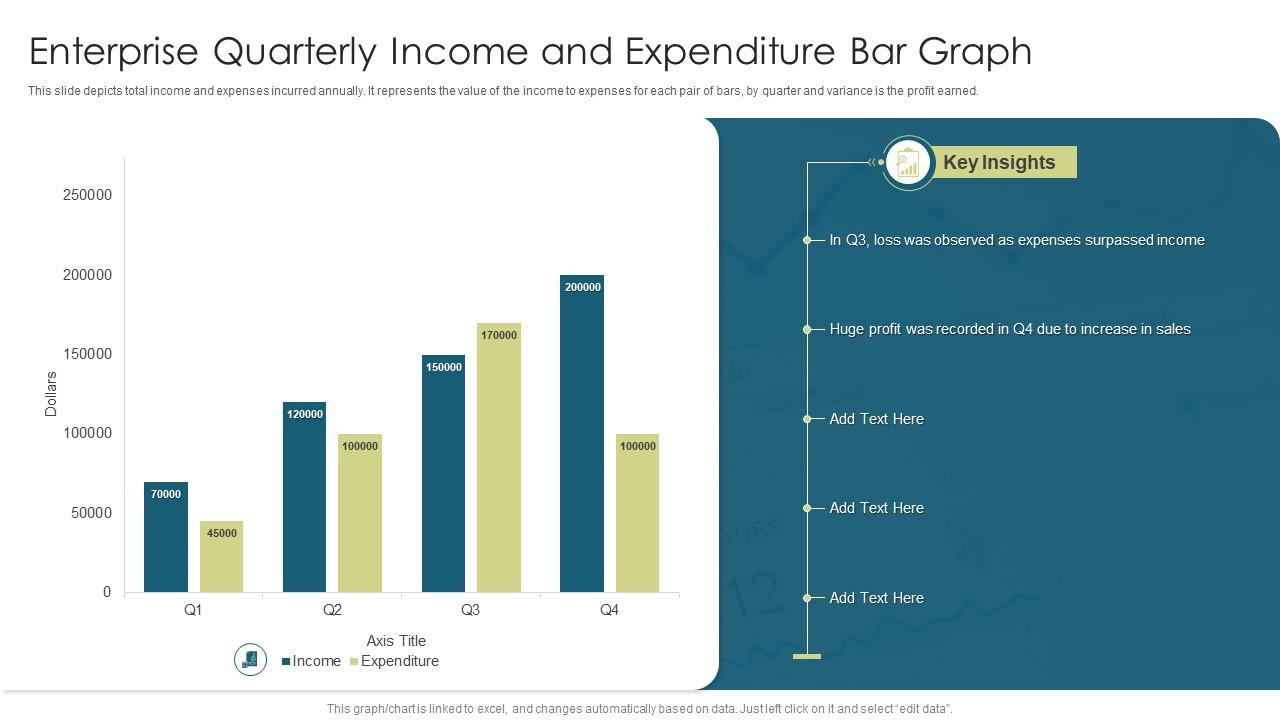
This slide depicts total income and expenses incurred annually. It represents the value of the income to expenses for each pair of bars, by quarter and variance is the profit earned.
This slide depicts total income and expenses incurred annually. It represents the value of the income to expenses for each ..
- Google Slides is a new FREE Presentation software from Google.
- All our content is 100% compatible with Google Slides.
- Just download our designs, and upload them to Google Slides and they will work automatically.
- Amaze your audience with SlideTeam and Google Slides.
-
Want Changes to This PPT Slide? Check out our Presentation Design Services
- WideScreen Aspect ratio is becoming a very popular format. When you download this product, the downloaded ZIP will contain this product in both standard and widescreen format.
-

- Some older products that we have may only be in standard format, but they can easily be converted to widescreen.
- To do this, please open the SlideTeam product in Powerpoint, and go to
- Design ( On the top bar) -> Page Setup -> and select "On-screen Show (16:9)” in the drop down for "Slides Sized for".
- The slide or theme will change to widescreen, and all graphics will adjust automatically. You can similarly convert our content to any other desired screen aspect ratio.
Compatible With Google Slides

Get This In WideScreen
You must be logged in to download this presentation.
PowerPoint presentation slides
This slide depicts total income and expenses incurred annually. It represents the value of the income to expenses for each pair of bars, by quarter and variance is the profit earned. Presenting our well structured Enterprise Quarterly Income And Expenditure Bar Graph. The topics discussed in this slide are Enterprise Quarterly, Income And Expenditure, Bar Graph. This is an instantly available PowerPoint presentation that can be edited conveniently. Download it right away and captivate your audience.
People who downloaded this PowerPoint presentation also viewed the following :
Enterprise Quarterly Income And Expenditure Bar Graph with all 7 slides:
Use our Enterprise Quarterly Income And Expenditure Bar Graph to effectively help you save your valuable time. They are readymade to fit into any presentation structure.
-
This PowerPoint layout is very helpful from a business point of view, and it's visually stunning too! I'm so happy with this product because it has helped me understand and deliver great presentations.
-
Innovative and Colorful designs.


