Financial forecast after process improve business efficiency optimizing business process ppt slides
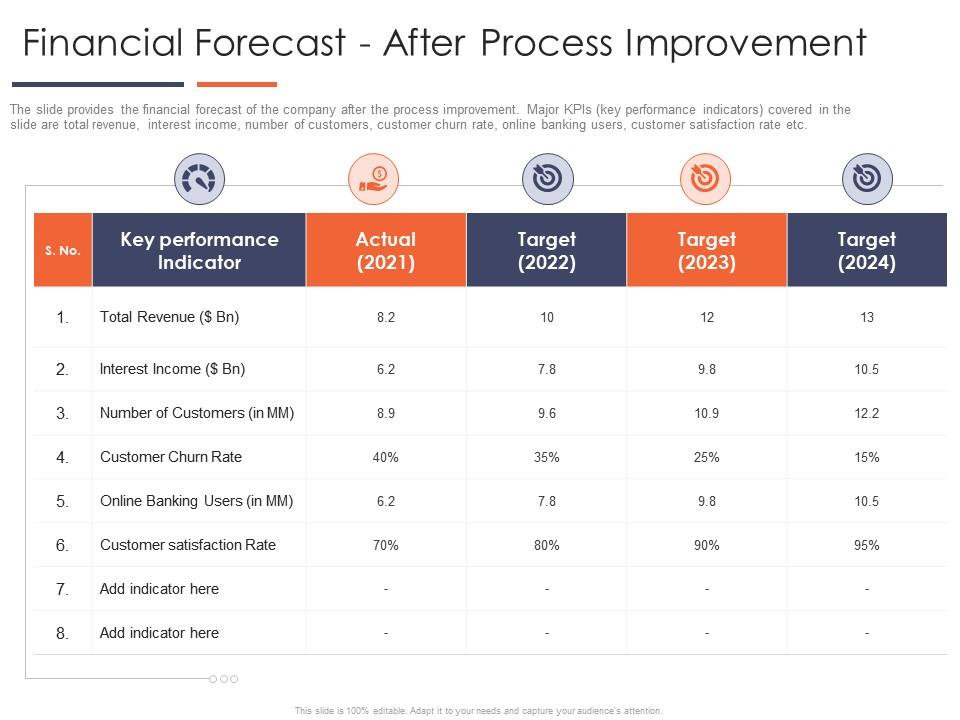
The slide provides the financial forecast of the company after the process improvement. Major KPIs key performance indicators covered in the slide are total revenue, interest income, number of customers, customer churn rate, online banking users, customer satisfaction rate etc.
The slide provides the financial forecast of the company after the process improvement. Major KPIs key performance indicato..
- Google Slides is a new FREE Presentation software from Google.
- All our content is 100% compatible with Google Slides.
- Just download our designs, and upload them to Google Slides and they will work automatically.
- Amaze your audience with SlideTeam and Google Slides.
-
Want Changes to This PPT Slide? Check out our Presentation Design Services
- WideScreen Aspect ratio is becoming a very popular format. When you download this product, the downloaded ZIP will contain this product in both standard and widescreen format.
-

- Some older products that we have may only be in standard format, but they can easily be converted to widescreen.
- To do this, please open the SlideTeam product in Powerpoint, and go to
- Design ( On the top bar) -> Page Setup -> and select "On-screen Show (16:9)” in the drop down for "Slides Sized for".
- The slide or theme will change to widescreen, and all graphics will adjust automatically. You can similarly convert our content to any other desired screen aspect ratio.
Compatible With Google Slides

Get This In WideScreen
You must be logged in to download this presentation.
PowerPoint presentation slides
The slide provides the financial forecast of the company after the process improvement. Major KPIs key performance indicators covered in the slide are total revenue, interest income, number of customers, customer churn rate, online banking users, customer satisfaction rate etc. Deliver an outstanding presentation on the topic using this Financial Forecast After Process Improve Business Efficiency Optimizing Business Process Ppt Slides. Dispense information and present a thorough explanation of Revenue, Income, Interest, Performance, Target using the slides given. This template can be altered and personalized to fit your needs. It is also available for immediate download. So grab it now.
People who downloaded this PowerPoint presentation also viewed the following :
Financial forecast after process improve business efficiency optimizing business process ppt slides with all 2 slides:
Use our Financial Forecast After Process Improve Business Efficiency Optimizing Business Process Ppt Slides to effectively help you save your valuable time. They are readymade to fit into any presentation structure.
-
Unique and attractive product design.
-
Editable templates with innovative design and color combination.
-
Use of different colors is good. It's simple and attractive.
-
Topic best represented with attractive design.


