Financial Performance KPI Dashboard With Working Capital And Cash Conversion Ratios
Try Before you Buy Download Free Sample Product
Audience
Editable
of Time
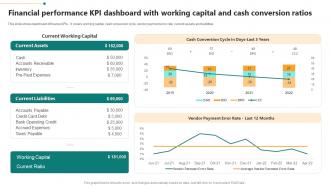
This slide shows dashboard of finance KPIs. It covers working capital, cash conversion cycle, vendor payment error rate, current assets and liabilities.
People who downloaded this PowerPoint presentation also viewed the following :
Financial Performance KPI Dashboard With Working Capital And Cash Conversion Ratios with all 7 slides:
Use our Financial Performance KPI Dashboard With Working Capital And Cash Conversion Ratios to effectively help you save your valuable time. They are readymade to fit into any presentation structure.
FAQs for Financial Performance KPI Dashboard With Working Capital And
Essential KPIs for financial performance dashboards include revenue growth, profit margins, cash flow, return on investment, and expense ratios. These metrics enable organizations to streamline decision-making by tracking operational efficiency, identifying cost reduction opportunities, and measuring strategic initiatives, with many companies finding that comprehensive dashboards ultimately deliver faster financial insights and enhanced competitive advantage.
Organizations can customize financial performance dashboards by selecting relevant KPIs, configuring industry-specific metrics, adjusting visualization formats, and integrating real-time data sources aligned with their strategic objectives. Through customizable templates and flexible reporting modules, companies streamline decision-making processes, enhance stakeholder communication, and ultimately deliver targeted insights that drive competitive advantage in their specific market landscape.
Best practices for visualizing financial data include using clear hierarchical layouts, consistent color coding, interactive drill-down capabilities, real-time data integration, and strategic use of charts like waterfall and variance analysis. These approaches streamline decision-making by highlighting key metrics, trends, and exceptions at a glance, with many financial institutions finding that well-designed dashboards reduce reporting time while enhancing strategic insights.
Real-time data integrations enhance financial performance dashboards by providing instant visibility into cash flows, revenue streams, and operational metrics, enabling faster decision-making and proactive risk management. Through automated data feeds, organizations can identify trends, address variances immediately, and optimize resource allocation, with many financial institutions finding that real-time insights deliver significant competitive advantages and improved forecasting accuracy.
Data accuracy serves as the foundation for reliable financial performance dashboards, directly impacting decision-making quality, regulatory compliance, and strategic planning effectiveness. Inaccurate data can lead to misguided investment decisions, flawed budget allocations, and compromised stakeholder trust, with many organizations finding that implementing robust data validation processes and real-time verification systems ultimately delivers enhanced operational efficiency and competitive advantage.
Small businesses benefit from financial performance dashboards through faster decision-making, simplified financial oversight, and cost-effective resource allocation, while larger enterprises leverage them for complex multi-departmental analysis and strategic planning. Small businesses often find these dashboards deliver immediate visibility into cash flow, profitability, and operational efficiency, ultimately enabling competitive agility that larger organizations may struggle to achieve quickly.
**INPUT**: What software tools are recommended for creating an efficient financial performance dashboard? **OUTPUT**: Recommended software tools include Tableau, Power BI, Qlik Sense, Excel with Power Query, and specialized platforms like Adaptive Insights or Anaplan. These solutions streamline financial reporting by automating data integration, enabling real-time visualization, and delivering customizable analytics, with many organizations finding that strategic dashboard implementation enhances decision-making speed and operational transparency. [Word count: 54 words]
A financial performance dashboard helps forecast future financial trends by analyzing historical data patterns, tracking key performance indicators, and identifying revenue cycles across different business segments. Through predictive analytics and real-time data visualization, organizations can anticipate market shifts, budget more accurately, and make strategic decisions proactively, ultimately enabling better resource allocation and competitive positioning in increasingly dynamic markets.
Common challenges include data integration from multiple sources, ensuring data accuracy and consistency, selecting relevant KPIs, managing user adoption across departments, and maintaining real-time updates. These implementation hurdles often stem from legacy system incompatibilities, organizational resistance to change, and inadequate training, with many companies finding that phased rollouts and stakeholder engagement significantly streamline the transition process.
User engagement with financial performance dashboards improves through intuitive design, interactive visualizations, personalized metrics, real-time data updates, and mobile accessibility. These enhancements streamline decision-making by enabling executives to quickly identify trends, drill down into specific performance areas, and access critical insights on-demand, with many organizations finding that user-friendly interfaces ultimately deliver faster strategic responses and improved financial outcomes.
Non-profit financial dashboards should prioritize program expense ratios, fundraising efficiency, donor retention rates, cash flow projections, and administrative cost percentages. These metrics enable organizations to demonstrate fiscal responsibility to stakeholders while optimizing resource allocation, with many non-profits finding that transparent financial reporting enhances donor trust and ultimately delivers improved funding opportunities and operational sustainability.
Financial performance dashboards should be updated in real-time or daily for operational metrics, weekly for departmental reviews, and monthly for executive summaries, depending on business needs and data complexity. Many organizations find that automated daily updates for key performance indicators, combined with comprehensive monthly strategic reviews, deliver optimal balance between current insights and meaningful trend analysis, ultimately enabling faster decision-making.
Benchmarking against industry standards in financial performance dashboards enables organizations to contextualize their metrics, identify competitive gaps, and establish realistic improvement targets based on peer performance data. This strategic comparison helps companies assess their market position, validate their financial strategies, and discover optimization opportunities, ultimately delivering enhanced decision-making capabilities and sustainable competitive advantage.
A financial performance dashboard assists in risk identification by providing real-time monitoring of key metrics, automated alerts for anomalies, trend analysis, and predictive indicators across cash flow, debt ratios, and market exposures. Through centralized visibility and data integration, organizations can detect early warning signs, implement preventive measures, and make informed decisions faster, ultimately reducing financial vulnerabilities while enhancing strategic planning capabilities.
Training strategies include hands-on workshops with real data scenarios, role-specific tutorials focusing on relevant metrics, interactive simulations, and peer mentoring programs. Organizations increasingly find success through progressive learning modules that start with basic navigation and advance to complex analytics, with finance teams, sales managers, and executives requiring tailored approaches that emphasize actionable insights over technical features.
-
Been using SlideTeam for some time now…can’t imagine why I wasted all that time in front of the screen trying to make the perfect presentation.
-
Great experience, I would definitely use your services further.