


Financial Proposal Powerpoint Presentation Slides






Try Before you Buy Download Free Sample Product
 Impress Your
 Audience
 100%
100% Editable
 Save Hours
 of Time


Create a financial proposal using content-ready Financial Proposal PowerPoint Presentation Slides. Add all the relevant templates related to a budget setting with the help of financial proposal PowerPoint slideshow. Set up a budget limit for your next project and include estimation cost, cost factors and assignment, directs costs, etc by adding financial proposal PPT template. This ready-to-use financial proposal PowerPoint slideshow covers topics like proposal outline, executive summary, business performance, business highlights, financial summary, and more. Explain to your sales manager regarding revenue split, competitive landscape, top creditors using financial proposal PPT slides. Not just this, discuss at length about cash flow statement, income statement, balance sheet, key financial ratios, and financial projects. This deck is your one stop solution for financial and budget proposal. Grab this content-ready financial proposal complete PowerPoint presentation now and get start with budget setting using these important PPT templates. Instill faith in your ability to deliver with our Financial Proposal Powerpoint Presentation Slides. Be able to hold the job down.
People who downloaded this PowerPoint presentation also viewed the following :
Content of this Powerpoint Presentation
Slide 1: This slide introduces Financial Proposal. State your company name and get started.
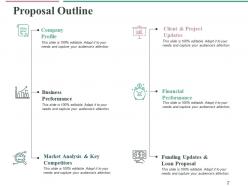
Slide 2: This slide presents Proposal Outline showing the following aspects- Client & Project Updates, Financial Performance, Funding Updates & Loan Proposal, Company Profile, Business Performance, Market Analysis & Key Competitors.
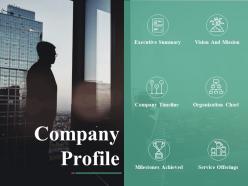
Slide 3: This slide shows your Company Profile along with- Service Offerings, Milestones Achieved, Organization Chart, Company Timeline, Vision And Mission, Executive Summary, Company Profile.
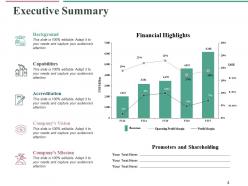
Slide 4: This is an Executive Summary slide presenting mainly the Financial Highlights in a graphical form. It also shows- Background, Capabilities, Accreditation, Company’s Vision, Company’s Mission, Promoters and Shareholding.
Slide 5: This is Our Vision And Mission slide. You can showcase your company's vision, mission goals etc. here and make use of this slide.
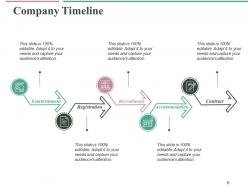
Slide 6: This slide shows a creative Company Timeline with the following steps- Contract, Accommodation, Recruitment, Establishment, Registration.
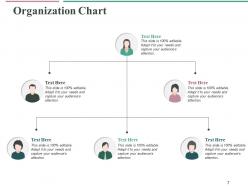
Slide 7: This slide shows an Organization Chart with text boxes to fill in the name, designation etc. of your team members.
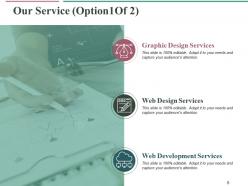
Slide 8: This is Our Service (Option1Of 2) slide describing three main types of services- Graphic Design Services, Web Design Services, Web Development Services. You can use these services as a reference guide to add in your own services.
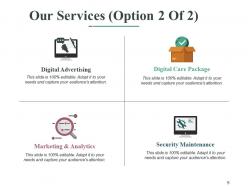
Slide 9: This slide also shows Our Services (Option 2 Of 2) divided into- Marketing & Analytics, Security Maintenance, Digital Advertising, Digital Care Package. Add your own services as per your business necessity.
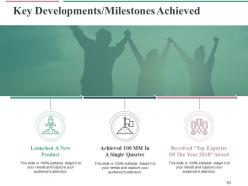
Slide 10: This slide shows Key Developments/Milestones Achieved such as- Launched A New Product, Achieved 100 MM In A Single Quarter, Received “Top Exporter Of The Year 2018” Award. These are just few examples that we have provided, which can be altered as per your business need.
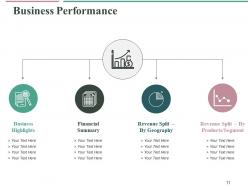
Slide 11: This slide shows Business Performance. Various attributes of business performance have been added which you can use as per your business requirements.
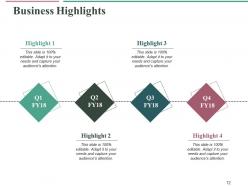
Slide 12: This slide shows the first attribute of business performance- Business Highlights. Add your highlights in the given text boxes.
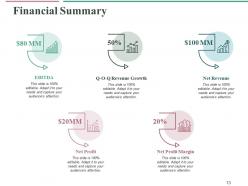
Slide 13: This slide shows the second attribute of business performance- Financial Summary with following points- Net Profit, Net Profit Margin, EBITDA, Q-O-Q Revenue Growth, Net Revenue.
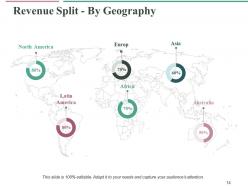
Slide 14: This slide shows the third attribute of business performance- Revenue Split - By Geography in a world map image form.
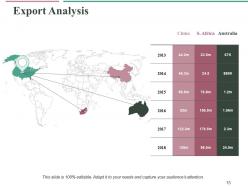
Slide 15: This slide shows global representation of Export Analysis with world map imagery.
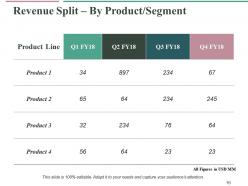
Slide 16: This slide shows the fourth attribute of business performance- Revenue Split – By Product/Segment. You can add your products here.
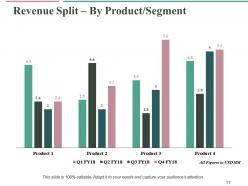
Slide 17: This slide also shows Revenue Split – By Product/Segment graphically. Add in your product stats in this graph for analysis, comparison etc.
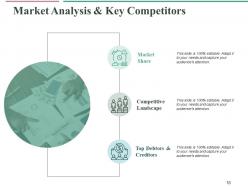
Slide 18: This slide shows Market Analysis & Key Competitors which includes- Market Share, Competitive Landscape, Top Debtors & Creditors.
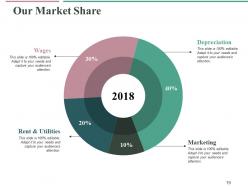
Slide 19: This slide shows Our Market Share consisting of- Wages, Rent & Utilities, Marketing and Depreciation in a pie chart/ graph form.
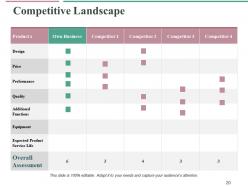
Slide 20: This slide shows Competitive Landscape table showing all the aspects related to Product as well as Competitors.
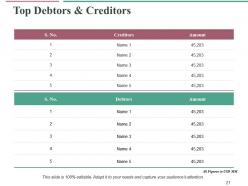
Slide 21: This slide shows Top Debtors & Creditors. Add in their names along with the amount in the given table.
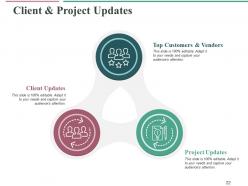
Slide 22: This slide presents Client & Project Updates which includes- Top Customers & Vendors, Project Updates, Client Updates.
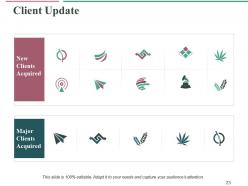
Slide 23: This slide shows Client Update with reference to- New Clients Acquired, Major Clients Acquired.
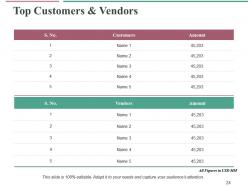
Slide 24: This slide shows Top Customers & Vendors. Add in their names along with the amount in the given table.
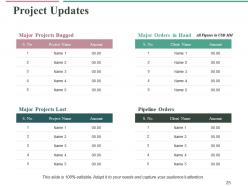
Slide 25: This slide presents Project Updates which shows- Major Projects Bagged, Major Orders in Hand, Major Projects Lost, Pipeline Orders.
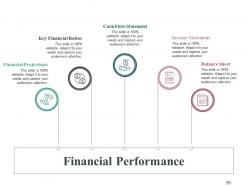
Slide 26: This slide shows Financial Performance as per the Income Statement, Balance Sheet, Cash Flow Statement, Key Financial Ratios, Financial Projections.
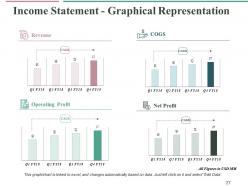
Slide 27: This slide shows Income Statement - Graphical Representation of the following aspects- Revenue, COGS, Operating Profit, Net Profit.
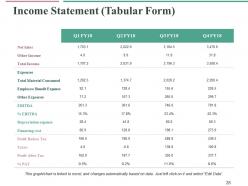
Slide 28: This slide shows a tabular representation of Income Statement.
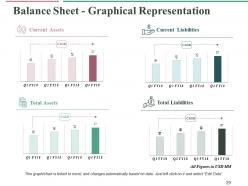
Slide 29: This slide shows Balance Sheet - Graphical Representation of the following aspects- Total Assets, Total Liabilities, Current Assets, Current Liabilities.
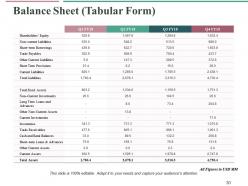
Slide 30: This slide shows a tabular representation of Balance Sheet.
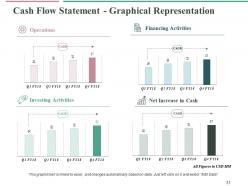
Slide 31: This slide shows Cash Flow Statement - Graphical Representation of the following aspects- Financing Activities, Operations, Investing Activities, Net Increase in Cash.
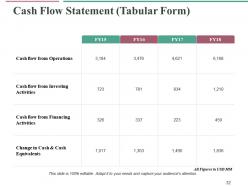
Slide 32: This slide shows a tabular representation of the Cash Flow Statement.
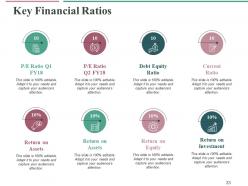
Slide 33: This slide describes some of the Key Financial Ratios like- Return on Assets, Return on Investment, Return on Equity, P/E Ratio Q1 FY18, Debt Equity Ratio, Current Ratio, P/E Ratio Q2 FY18.
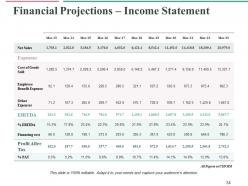
Slide 34: This slide shows Financial Projections – Income Statement.
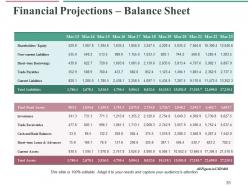
Slide 35: This slide shows Financial Projections – Balance Sheet with Total Liabilities, Total Assets.
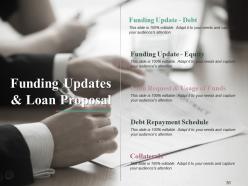
Slide 36: This slide presents Funding Updates & Loan Proposal which contains- Funding Update - Debt, Funding Update - Equity, Loan Request & Usage of Funds, Debt Repayment Schedule, Collaterals.
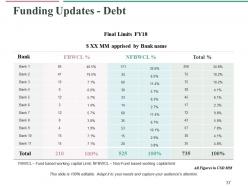
Slide 37: This slide presents Funding Updates - Debt with the sub heading- Final Limits FY18 $ XX MM apprised by Bank name.
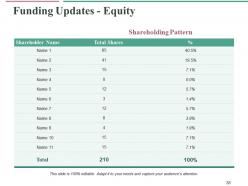
Slide 38: This slide presents Funding Updates - Equity showing the Shareholding Pattern which includes- Shareholder Name, Total Shares, %.
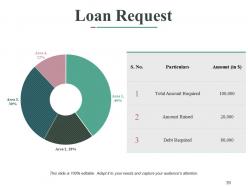
Slide 39: This slide shows Loan Request as per different areas which you can add.
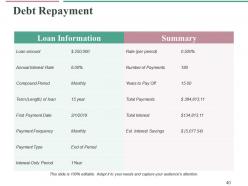
Slide 40: This slide shows Debt Repayment table with- Loan Information, Summary.
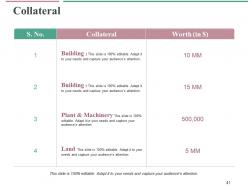
Slide 41: This slide shows Collateral with Worth (in $).
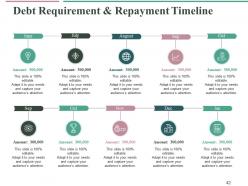
Slide 42: This slide shows Debt Requirement & Repayment Timeline. Add in your own amounts in this timeline and use it as per your need.
Slide 43: This is Financial Proposal Icons Slide. Alter icons as per your need.
Slide 44: This slide shows Coffee Break image as a reminder for you to take a break. You can alter the content as per need.
Slide 45: This slide is titled Charts & Graphs to move forward to the slides containing charts and graphs. You can also alter the slide content as per your need.
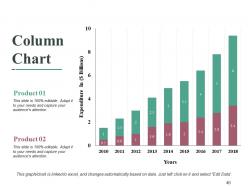
Slide 46: This slide presents a Column Chart showing two product comparison.
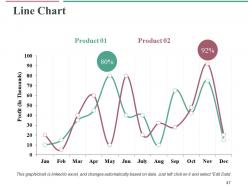
Slide 47: This slide presents a Line Chart for showcasing product/ company growth, comparison etc.
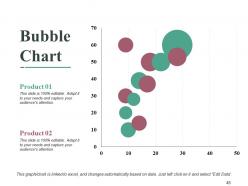
Slide 48: This slide presents a Bubble Chart for showcasing product/ company growth, comparison etc.
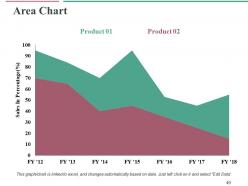
Slide 49: This is an Area Chart slide for product/ entity comparison.
Slide 50: This slide is titled Additional Slides to move forward. You can change the slide content as per need.
Slide 51: This slide showcases Our Mission. Show your company mission and goals here.
Slide 52: This slide showcases Our Team with Name and Designation to fill.
Slide 53: This is an About Us slide. State team/ company specifications here.
Slide 54: This is Our Goal slide. State your goals here.
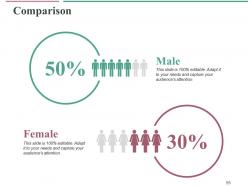
Slide 55: This is a Comparison slide. You can compare the male and female ratio in it.
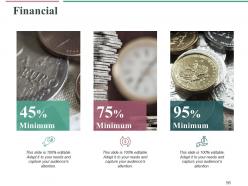
Slide 56: This slide shows Financial score. State financial aspects here.
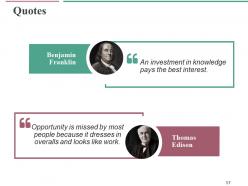
Slide 57: This is a Quotes slide. Put a quote or anything you want to highlight here.
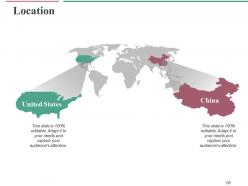
Slide 58: This is a Location slide to show global growth, presence etc. on a world map image.
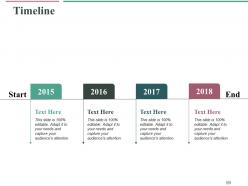
Slide 59: This is a Timeline slide to present important dates, journey, evolution, milestones etc.
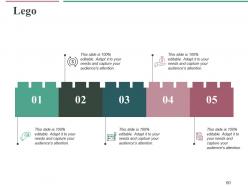
Slide 60: This is a Lego image slide to show information, specifications etc.
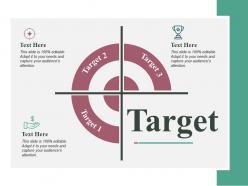
Slide 61: This is a Target image slide to show targets, goals, information, specifications etc.
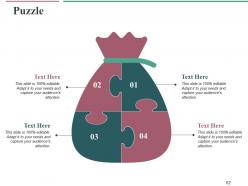
Slide 62: This is a Puzzle image slide to show information, specifications etc.
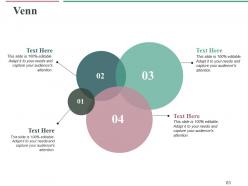
Slide 63: This is a Venn diagram image slide to show information, specifications etc.
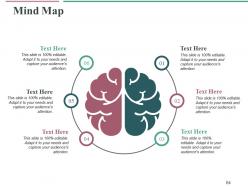
Slide 64: This is a Mind Map image slide to show information, segregation, specifications etc.
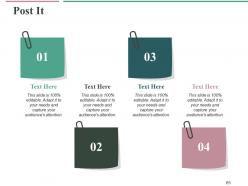
Slide 65: This is a Post it slide to mark reminders, events etc.
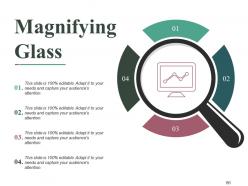
Slide 66: This is a Magnifying Glass image slide to show information, specification etc.
Slide 67: This is a Silhouettes slide to show people specific information etc.
Slide 68: This is a Bulb or Idea slide to state a new idea or highlight specifications/ information etc.
Slide 69: This is a Thank You slide with Address# street number, city, state, Contact Number, Email Address.
Financial Proposal Powerpoint Presentation Slides with all 69 slides:
Doubts don't get a chance to emerge due to our Financial Proposal Powerpoint Presentation Slides. It ensures folks don't interrupt.










FAQs for Financial Proposal
So you'll need an executive summary up front - that's what the bosses actually read. Budget breakdown is obvious, but make sure it lines up perfectly with your timeline or finance will bounce it back to you immediately. Include ROI projections and your methodology for how you got those numbers. Risk assessment is huge - most people skip it but it makes you look way more prepared. Oh, and don't forget success metrics and clear deliverables. Honestly, the appendix with all your supporting data might seem boring but it covers your ass later. Timeline with milestones pulls everything together.
So market analysis is basically how you prove you're not just making stuff up. Including real data about competitors and industry trends shows stakeholders your projections aren't wishful thinking. Way more convincing than just saying "trust me, bro." You'll look like you actually did your homework on potential risks too. Honestly, I've seen too many pitches fall flat because someone skipped this part. Always grab at least 2-3 solid sources to back up your main assumptions - makes a huge difference in how seriously people take your numbers.
Don't just throw numbers at people - walk them through your thinking first. Show your key assumptions and explain how you got each figure. Trust me, investors can smell BS projections from a mile away. Charts and graphs are your friend here, they make trends way easier to spot. Always do three scenarios: best case, realistic, and conservative (honestly the conservative one might be most important). You need to defend every single line if someone asks. Oh and tie everything back to your actual business strategy - people want to understand why these numbers make sense for what you're trying to build.
Look, different people care about totally different stuff when it comes to money proposals. CFOs? They want ROI numbers and risk stuff. Department heads are thinking about how it'll mess with their daily operations. Investors just want to know if they're gonna make bank. I learned this the hard way honestly - sent the same boring proposal to everyone once and crickets. Nobody cared. You gotta figure out what each person actually values first. Then hit them with those specific benefits right up front. Use their language, their metrics. Makes all the difference.
Honestly, charts and graphs are a game-changer for financial presentations. People's eyes just glaze over when you throw spreadsheets at them - nobody has time to decode rows of numbers. With visuals, they can actually see what's happening with your data. Trends jump out immediately. Bar charts are perfect when you're comparing different things, line graphs show how stuff changes over time. Pie charts work well for breaking down budgets, though some people hate them for whatever reason. Your audience will actually pay attention instead of checking their phones. Just don't forget to add a quick explanation for each chart so people know what they're looking at.
Ugh, the worst thing you can do is be vague with money stuff - give actual numbers and real dates, not "around $50k" or "by end of quarter." Hidden costs will absolutely kill you too. Taxes, random fees, setup expenses... I swear half the proposals I've seen tank because they forgot something obvious and suddenly looked sketchy. Oh, and spell out your assumptions! Don't make people guess how you got your numbers. Risk planning is huge - what happens if things go sideways? Always pad your budget a bit because something unexpected will definitely pop up.
So basically, add a risk section after your main numbers - list out stuff like market shifts, budget overruns, delays, whatever could go wrong. Assign each risk a percentage chance and dollar impact. Then show how you'll handle each one plus build contingency money into your budget. Honestly, stakeholders actually love seeing this because it proves you're not just throwing around wishful thinking. Oh, and when you're talking ROI, make sure you mention these risks too. It sounds counterintuitive but acknowledging what could tank your project actually makes your whole proposal way more credible.
Hey! So the exec summary is like your proposal's first impression - decision-makers might only read that part, honestly. Pack your best financial highlights and projected returns into 1-2 pages tops. Write it last though, so you can cherry-pick the strongest stuff from your full proposal. Think movie trailer but for spreadsheets (way less fun, I know). You need to hook them fast enough that they either want the full pitch or can quickly pass. Make your value prop super clear upfront - don't bury it.
Look, you've gotta connect every dollar to actual results and prove your ROI with real data. Use past results, market research, whatever you have that shows this thing actually works. Break down costs with context - I hate seeing random budget lists with no explanation! Map out exactly what measurable results you expect and when. Include backup plans and different scenarios so they know you've thought it through. Honestly, the whole point is making them feel like you're investing their money smart, not just spending it. Oh and definitely add a timeline showing when they'll see returns.
So you'll definitely want to track ROI and payback period - those are your bread and butter metrics. NPV matters too since it factors in time value of money (boring but necessary). Cash flow projections will show if you're actually making financial sense. Honestly, I'd run sensitivity analysis because projects never go as planned - ever. Check your actual numbers against projections every quarter so you can pivot if things go sideways. Don't sleep on the qualitative stuff either like stakeholder satisfaction. Sometimes those "soft" wins end up mattering more than you'd think for long-term success.
Yeah, you really gotta tailor your proposal to whatever industry you're pitching. Tech companies want to see burn rates and how you'll scale - that's their obsession. Manufacturing? They care about equipment costs and supply chain stuff. Healthcare proposals need all these boring compliance sections (trust me, don't skip those). Financial firms are all about risk management, but if you're talking to a creative agency, focus on campaign ROI and talent expenses. Honestly, the best thing you can do is research their specific pain points first. Then just copy how they talk about money and metrics. Makes a huge difference when you speak their language.
Definitely put an executive summary upfront with your key numbers - finance people want the big picture first. Then break everything else up with lots of white space because walls of text are horrible to scan through. Tables are your friend for budget stuff, way better than trying to explain it all in paragraphs. I always color-code different expense categories too, makes it super easy to follow. Don't forget readable fonts (seriously, why do people use tiny text?) and throw in bullet points everywhere. Oh, and page numbers are clutch since everyone references sections during meetings. If you squint and it looks messy, you need more formatting.
Get ahead of the pushback by baking responses right into your presentation. Show ROI numbers upfront for cost concerns. Finance people hate surprises, so give them worst-case scenarios too - they'll actually appreciate the honesty. Build in moments where you straight-up ask "what worries you about this?" Don't wait for them to attack. Keep backup slides ready with more data or different options. Oh, and here's the thing - always acknowledge their concerns first before you counter. Makes a huge difference. They need to feel heard, not steamrolled.
Okay so you'll want to hit compliance stuff, contract terms, and liability protection. Securities laws matter if you're dealing with investments, banking regs for loans - that whole mess. Payment schedules and default conditions need to be crystal clear, plus how you'll handle disputes. The regulatory paperwork is honestly such a pain but you can't skip it. Oh and don't forget risk disclosures upfront - people hate surprises with fees later. Definitely get legal to look it over first, especially if it's complicated or involves weird financial stuff. Trust me on that one.
You gotta follow up or your proposal will just sit there collecting digital dust. Send a quick email after a week, then check in every 10-14 days with something useful - market data, answers to random questions they had. I swear, so many solid proposals get forgotten because people are drowning in emails. Don't be annoying about it though. Just helpful reminders that show you actually care about landing this thing. Stay visible but not clingy - there's definitely a fine line there. Think persistent friend, not that ex who won't stop calling.
-
Easily Understandable slides.
-
Best Representation of topics, really appreciable.