


Financial Statement Analysis For Improving Business Decisions Fin CD





Try Before you Buy Download Free Sample Product
 Impress Your
 Audience
 100%
100% Editable
 Save Hours
 of Time


Unlock the power of informed decision-making with our comprehensive presentation deck on Financial Statement Analysis for Improving Business Decisions. In todays dynamic business landscape, the need for insightful financial statement analysis has never been more critical. Dive into the fundamentals with an introduction elucidating the overview and techniques of financial statement analysis, followed by a detailed exploration of balance sheets, income statements, cash flow statements, and common ratio metrics. Unveil the step-by-step process of preparing and analyzing financial statements. Learn to evaluate financial performance by scrutinizing critical factors and implementing strategic measures to improve business performance. Understand the methodologies of conducting a comprehensive financial statement review, selecting analysis tools, and implementing trend and ratio analyses to extract invaluable insights. Grasp the outcomes, best practices, and impactful outcomes of financial statement analysis, identifying business growth opportunities. Harness the potential of this analysis to drive growth and success. Elevate your business acumen download our presentation deck now and harness the transformative potential of financial statement analysis.
People who downloaded this PowerPoint presentation also viewed the following :
Content of this Powerpoint Presentation
Slide 1: This slide showcase title Financial Statement Analysis for Improving Business Decisions. State Your Company Name.
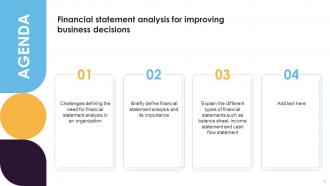
Slide 2: This slide showcase title AGENDA.
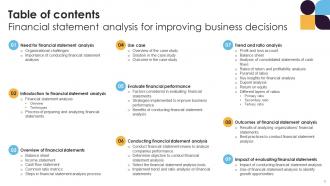
Slide 3: This slide exhibit Table of Content.
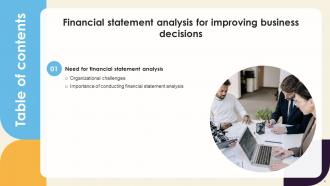
Slide 4: This slide exhibit Table of Content: Organizational challenges.
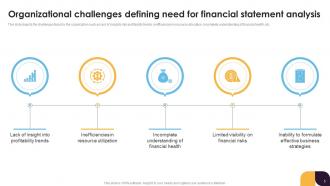
Slide 5: This slide depicts the challenges faced by the organization such as lack of insights into profitability trends, inefficiencies in resource allocation.
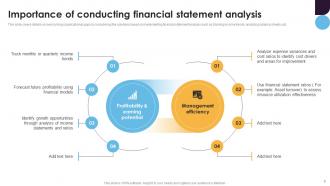
Slide 6: This slide covers details on overcoming organizational gaps by considering the solutions based on implementing financial statement analysis.
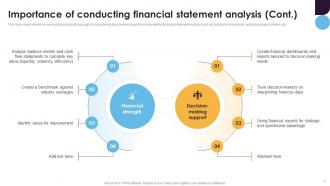
Slide 7: This slide covers details on overcoming organizational gaps by considering the solutions based on implementing financial statement analysis.
Slide 8: This slide exhibit Table of Content: Financial statement analysis.
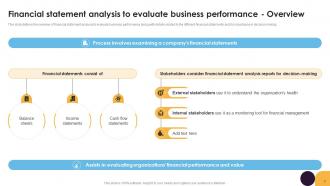
Slide 9: This slide defines the overview of financial statement analysis to evaluate business performance along with details related to the different financial statements.
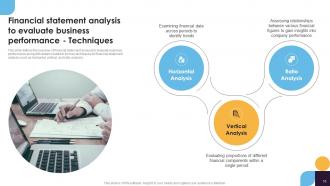
Slide 10: This slide defines the overview of financial statement analysis to evaluate business performance along with details related to primary techniques.
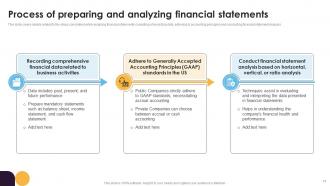
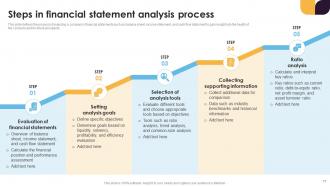
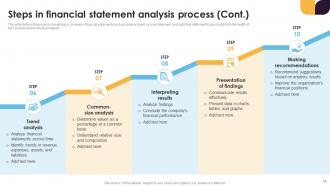
Slide 11: This slide covers details related to the steps considered while analyzing financial statements.
Slide 12: This slide exhibit Table of Content: Overview of financial statements.
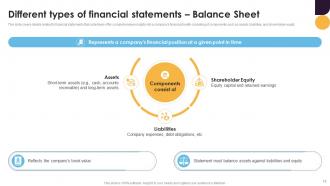
Slide 13: This slide covers details related to financial statements that collectively offer comprehensive insights into a company's financial health.
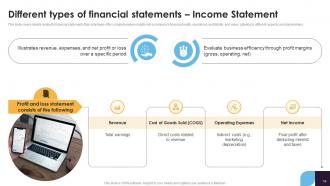
Slide 14: This slide covers details related to financial statements that collectively offer comprehensive insights into a company's financial health.
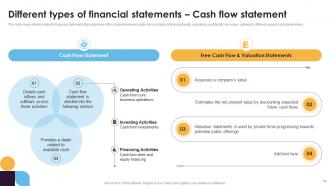
Slide 15: This slide covers details related to financial statements that collectively offer comprehensive insights into a company's financial health.
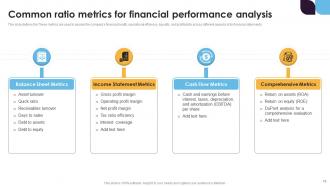
Slide 16: This slide defines the These metrics are used to assess the company's financial health, operational efficiency, liquidity, and profitability.
Slide 17: This slide defines the process of analyzing a company's financial statements.
Slide 18: This slide defines the process of analyzing a company's financial statements such as balance sheet, income statement, and cash flow statement.
Slide 19: This slide exhibit Table of Content: Use case.
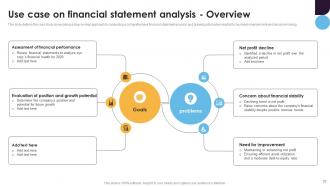
Slide 20: This slide defines the case study showcasing a step-by-step approach to conducting a comprehensive financial statement analysis.
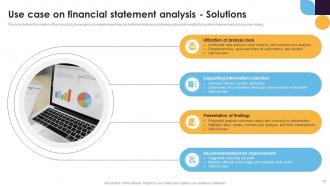
Slide 21: This slide defines the solution of the case study showcasing a comprehensive financial statement analysis and drawing actionable insights.
Slide 22: This slide defines the results of the case study showcasing a comprehensive financial statement analysis and drawing actionable insights for business improvement.
Slide 23: This slide exhibit Table of Content: Factors considered in evaluating financial statements.
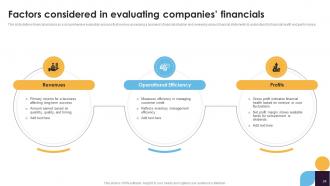
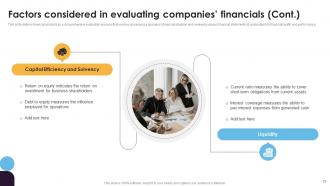
Slide 24: This slide defines financial analysis as a comprehensive evaluation process that involves assessing a business’s financial situation.
Slide 25: This slide defines financial analysis as a comprehensive evaluation process that involves assessing a business’s financial situation.
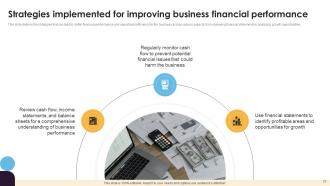
Slide 26: This slide defines the strategies that can lead to better financial performance and operational efficiency for the business.
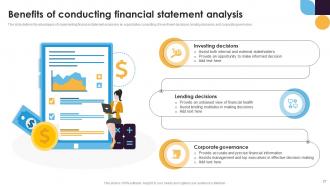
Slide 27: This slide defines the advantages of implementing financial statement analysis in an organization consisting of investment decisions, lending decisions.
Slide 28: This slide exhibit Table of Content: Conducting financial statement analysis
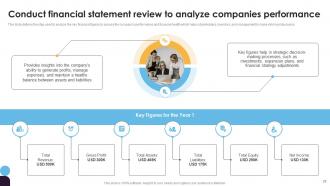
Slide 29: This slide defines the step used to analyze the key financial figures to assess the company's performance and financial health.
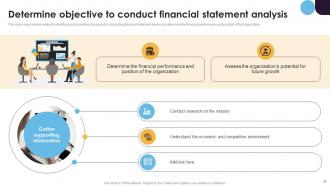
Slide 30: This slide covers details related to identifying and specifying the goals for conducting financial statement analysis to determine the financial performance and position of the organization.
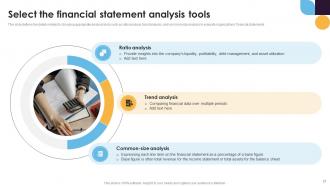
Slide 31: This slide defines the details related to choosing appropriate analysis tools.
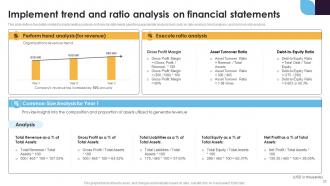
Slide 32: This slide defines the details related to implementing analysis on financial statements specifying appropriate analysis tools.
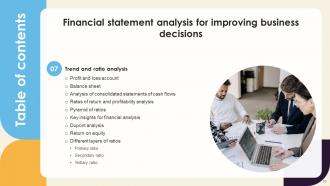
Slide 33: This slide exhibit Table of Content: Trend and ratio analysis
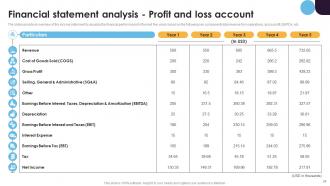
Slide 34: The slides provide an overview of the income statement to visualize the financial performance for the next five years.
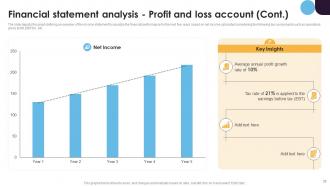
Slide 35: The slide depicts the graph defining an overview of the income statement to visualize the financial performance for the next five years based on net income.
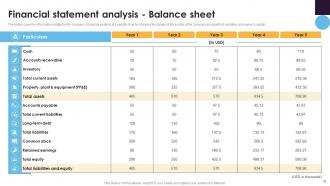
Slide 36: The slides cover the information related to the company's financial position at a specific time by showing the details of the assets of the company.
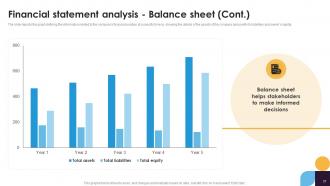
Slide 37: The slide depicts the graph defining the information related to the company's financial position at a specific time.
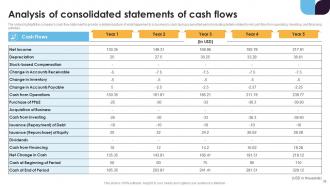
Slide 38: The slides highlight the company's cash flow statement to provide a detailed picture of what happened to a business's cash during a specified period.
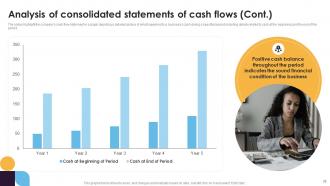
Slide 39: The slides highlight the company's cash flow statement in a graph depicting a detailed picture of what happened to a business's cash during a specified period.
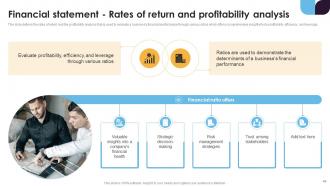
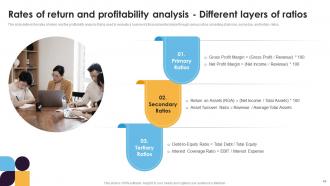
Slide 40: This slide defines the rates of return and the profitability analysis that is used to evaluate a business's financial performance through various ratios.
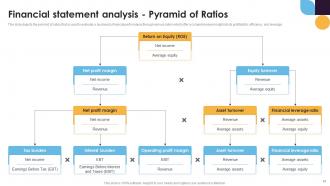
Slide 41: This slide depicts the pyramid of ratios that is used to evaluate a business's financial performance through various ratios.
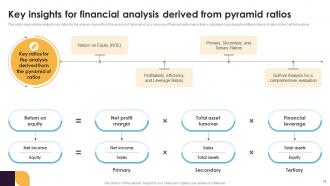
Slide 42: This slide covers details related to key ratios for the analysis derived from the pyramid of ratios.
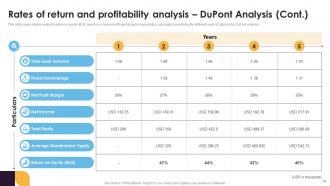
Slide 43: This slide covers details related to DuPont analysis which is a measure of financial performance that is calculated by dividing net income by shareholders.
Slide 44: This slide covers details related to return on equity (ROE) which is a measure of financial performance that is calculated considering.
Slide 45: This slide depicts a graph representing return on equity (ROE) which is a measure of financial performance.
Slide 46: This slide defines the rates of return and the profitability analysis that is used to evaluate a business's financial performance.
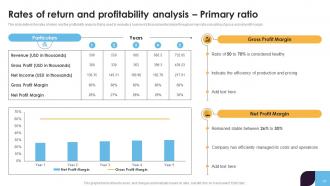
Slide 47: This slide defines the rates of return and the profitability analysis that is used to evaluate a business's financial performance through primary ratio.
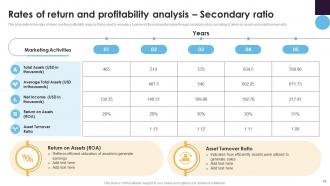
Slide 48: This slide defines the rates of return and the profitability analysis that is used to evaluate a business's financial performance through secondary ratios.
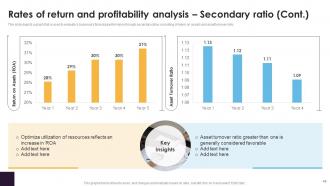
Slide 49: This slide depicts a graph to evaluate a business's financial performance through secondary ratios consisting of return on assets and asset turnover ratio.
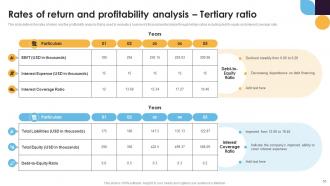
Slide 50: This slide defines the rates of return and the profitability analysis that is used to evaluate a business's financial performance through tertiary ratios.
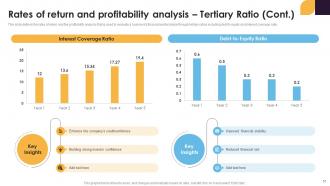
Slide 51: This slide defines the rates of return and the profitability analysis that is used to evaluate a business's financial performance through tertiary ratios.
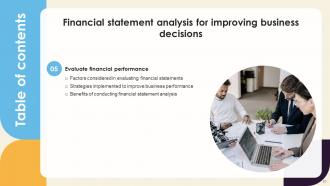
Slide 52: This slide exhibit Table of Content: Results of analyzing organizations’ financial statements.
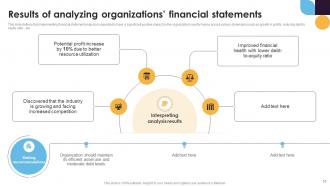
Slide 53: This slide defines that implementing financial statement analysis is expected to have a significant positive impact on the organization's performance.
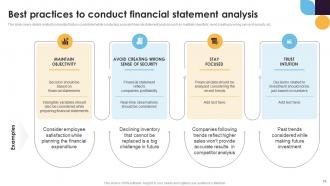
Slide 54: This slide covers details related to important factors considered while conducting accurate financial statement analysis.
Slide 55: This slide exhibit Table of Content: Impact of evaluating financial statements.
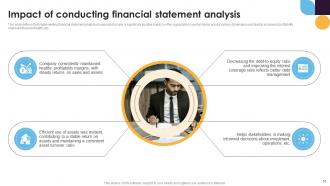
Slide 56: This slide defines that implementing financial statement analysis is expected to have a significant positive impact on the organization's performance.
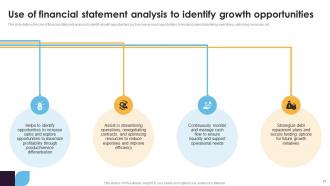
Slide 57: This slide defines the Use of financial statement analysis to identify growth opportunities.
Slide 58: This slide shows all the icons included in the presentation.
Slide 59: This slide is titled as Additional Slides for moving forward.
Slide 60: This slide depicts Venn diagram with text boxes.
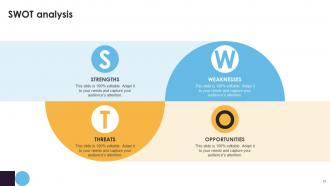
Slide 61: This slide shows SWOT analysis describing- Strength, Weakness, Opportunity, and Threat.
Slide 62: This slide showcases Magnifying Glass to highlight, minute details, information, specifications etc.
Slide 63: This is a Timeline slide. Show data related to time intervals here.
Slide 64: This is a Thank You slide with address, contact numbers and email address.
Financial Statement Analysis For Improving Business Decisions Fin CD with all 72 slides:
Use our Financial Statement Analysis For Improving Business Decisions Fin CD to effectively help you save your valuable time. They are readymade to fit into any presentation structure.













FAQs for Financial Statement Analysis For Improving Business
So there's basically four things to look at when you're digging into financial statements. Income statement shows you profit and revenue trends - pretty straightforward. Balance sheet breaks down assets, liabilities, and equity. Cash flow is honestly where the real action is though - it cuts through all the accounting BS and shows actual money moving around. Then there's the equity statement that tracks ownership changes over time. Oh and definitely look at multiple periods together, not just one quarter or whatever. The whole picture matters way more than individual pieces.
So ratio analysis takes those boring financial numbers and actually makes them useful. Like instead of just seeing "$2M in debt" you can figure out if that's normal for their size or if they're totally screwed. Honestly, the context changes everything. You'll spot red flags way quicker and can compare them to competitors without doing math all day. I'd start with liquidity and profitability ratios first - debt ratios are good too but those two give you the clearest picture of what's really going on.
Think of a balance sheet like a financial photo - it captures what a company owns and owes at one moment. I usually check this first because it tells you if they can pay their bills and how much debt they're drowning in. You can spot red flags pretty quickly. Calculate ratios like debt-to-equity to see how risky things are. Oh, and here's a basic check - assets should equal liabilities plus equity. If those numbers don't match up, someone messed up the math. It's honestly the best starting point for understanding any company's financial situation.
Look, income statements can totally fool you with accounting BS - companies show massive profits while secretly hemorrhaging cash. Maybe they're giving customers forever to pay or stockpiling tons of inventory. Cash flow cuts through that crap and shows what's actually happening. Is the business genuinely making money from operations? How much are they spending on growth? Are they borrowing or paying out dividends? I always compare reported earnings to actual cash - that's where you'll catch companies fudging their numbers.
So here's the thing - financial ratios mean nothing without context. You could have a 5% profit margin and think you're doing okay, but then find out everyone else in your industry averages 15%. Ouch. Benchmarks basically tell you if your numbers are decent or if you're getting crushed by competitors. Different industries play by totally different rules too - like, a grocery store's margins will look pathetic compared to a tech company's, but that's just how it works. Compare yourself to similar businesses first, then figure out why you're different.
So there are two main ways to analyze financial statements that'll actually help you spot problems. Horizontal analysis tracks changes over time - like is that revenue growth real or just a fluke? Vertical analysis shows each line item as a percentage of something bigger (usually revenue). That way you can see what's killing your margins or where costs are getting crazy. I honestly lean way more toward horizontal analysis day-to-day. Both help you get past just staring at numbers and figure out what's actually happening with the business. Oh and start with horizontal first, then use vertical to dig deeper into the weird stuff you find.
Honestly, you gotta look at the actual numbers before throwing money at any company. Stock prices don't tell the whole story - I've seen way too many people get burned by that. Check if their revenue is growing or tanking, how much debt they're carrying, and whether they're actually making cash. Debt-to-equity ratios are huge red flags if they're out of whack. Compare similar companies too because sometimes you'll find gems that are way undervalued. Think of it like... idk, checking reviews before buying something expensive? Start with profitability trends and cash flow - those basics will save you from most disasters.
Numbers can be super misleading without context, so always compare across time periods and industry benchmarks. Those footnotes are a pain but honestly that's where companies bury the juicy stuff. One-time charges or gains will mess with your analysis big time. Different accounting methods between companies make direct comparisons harder than they should be. Plus these statements only show what already happened - they won't predict the future. I always cross-check with several ratios and look at qualitative factors too before making any calls.
Look, earnings quality is basically whether you can actually trust those numbers or not. Good earnings come from real business operations that'll keep happening. Bad ones? They're pumped up with one-time stuff or sketchy accounting moves. It's kinda like someone who's genuinely in shape vs. just good at angles in photos, if that makes sense. Poor quality throws off your entire analysis since you're working with garbage data. I always check the cash flow statement first - way harder to fake than the income statement. Watch for weird revenue timing or expenses that seem off. Trust me, this step saves you from looking like an idiot later.
So off-balance-sheet financing is basically companies hiding their debt from the main financial statements. Pretty sneaky, right? It makes their debt ratios look way better than they actually are. You might think a company can handle more borrowing when they're actually maxed out. This stuff usually gets buried in the footnotes - honestly, it's like they're trying to hide it on purpose. Look for operating leases, joint ventures, or those weird special purpose entities. Your whole analysis gets thrown off if you don't catch this. Always check the notes section, even though it's boring as hell.
So basically when companies switch up their accounting methods, it screws with your ability to compare years against each other. You'll see numbers that look crazy good or terrible, but it's just the policy change messing things up. Companies have to tell you about these changes - though honestly, good luck finding it buried in those footnotes. Here's what I do: hunt for the restated numbers or pro forma stuff that shows what last year would've looked like with the new method. Makes the trend analysis actually useful instead of garbage. Otherwise you're comparing apples to oranges and wondering why nothing makes sense.
So first thing - currency swaps are gonna mess with your numbers big time. Strip out those FX effects and look at constant currency growth instead. Transfer pricing between subsidiaries is another headache that'll make margins look weird. Different accounting standards are honestly such a pain - try to normalize the GAAP vs IFRS stuff if you can. Tax rates vary by country too, which throws off comparisons. I'd create a clean view that focuses on actual operational performance. That's really the only way to see what's actually happening with the business underneath all this noise.
Honestly, just dig into their financial statements before you lend anything. The cash flow statement is where the real truth lives - way better than income statements that can be fluffed up with accounting nonsense. Calculate their debt-to-equity and current ratios first, those are dead giveaways. Look at 3-5 years of data too, not just last year's numbers. Working capital tells you tons about day-to-day operations. Interest coverage ratio shows if they can actually handle their debt payments. Pull their last three annual reports and start crunching those liquidity ratios - it's boring but you'll thank yourself later.
Dude, quarterly analysis for seasonal businesses is basically pointless unless you're smart about it. Rolling 12-month averages are your friend - they smooth out all that crazy seasonal noise. Compare the same quarters year-over-year instead of quarter-to-quarter, which makes way more sense. You can also create seasonal indices for each quarter, then measure current performance against those historical patterns. I learned this the hard way analyzing a ski resort once. Bottom line: always think in full annual cycles so you're actually comparing similar periods, not summer to winter madness.
Dude, the difference in financial analysis tools now vs like 5 years ago is crazy. AI can pull data straight from PDFs automatically, and you'll get ratio analysis done in seconds instead of hours. Excel's still solid obviously, but Tableau and Power BI are game-changers for spotting patterns - stuff just pops out at you visually. There's even ML that catches red flags you'd totally miss doing it by hand. Honestly? Pick one new tool and mess around with it this quarter. Even basic automation will free up so much time from the boring stuff.
-
Superb! The innovative and inspiring template designs provide an edge to the presentation.
-
The slides come with appealing color schemes and relevant content that helped me deliver a stunning presentation without any hassle!