Fixed investment analysis powerpoint presentation slides
Showcase measures of financial performance with our visually appealing Fixed Investment Analysis PowerPoint Presentation Slides. The fixed capital evaluation PowerPoint complete deck comprises of content ready templates such as capital budgeting table, analysis of the compositions of assets & liabilities, fixed capital analysis table, current cost analysis of fixed assets, ratio analysis, cash flow at end of the year, fixed assets annual report, fixed capital analysis balance sheet, capital budget evaluation in two different projects, payback period analysis of future cash flow, marketing return on investment, ROI for different projects, cost summary ROI analysis example, four stages of return investment model, ROI calculations table, payback table, net present value with years, NPV analysis table, internal rate of return example, net present value of cash flow to name a few. Incorporate fixed asset turnover PPT slides to demonstrate management plan for acquiring and selling fixed assets. Download the fixed capital analysis presentation deck now and engage your audience. Compete confidently with our investment ppt Slides. Put your best foot forward in any contest.
You must be logged in to download this presentation.
PowerPoint presentation slides
Presenting this set of slides with name - Fixed Investment Analysis Powerpoint Presentation Slides. Putting forth our PPT deck comprises of thirty-nine slides. Our tailor-made Fixed Investment Analysis Powerpoint Presentation Slides editable presentation deck assists planners in the segment and expounds the topic with brevity. The advantageous slides on Fixed Investment Analysis Powerpoint Presentation Slides are braced with multiple charts and graphs, overviews, analysis templates agenda slides, etc. to help boost important aspects of your presentation. Download PowerPoint templates in both widescreen and standard screen. The presentation is fully supported by Google Slides. It can be easily converted into JPG or PDF format.
People who downloaded this PowerPoint presentation also viewed the following :
Content of this Powerpoint Presentation
Slide 1: This slide introduces Fixed Investment Analysis. State Your Company Name and begin.
Slide 2: This slide shows Content of the presentation.
Slide 3: This slide presents Capital Budgeting in tabular form.
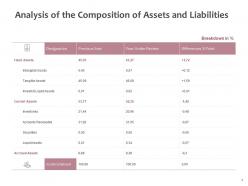
Slide 4: This slide displays Analysis of the Composition of Assets and Liabilities.
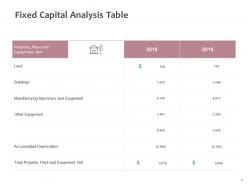
Slide 5: This slide represents Fixed Capital Analysis Table with previous and curent year.
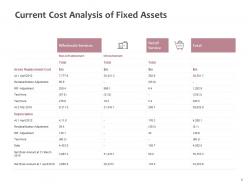
Slide 6: This slide showcases Current Cost Analysis of Fixed Assets including wholesale and retail services.
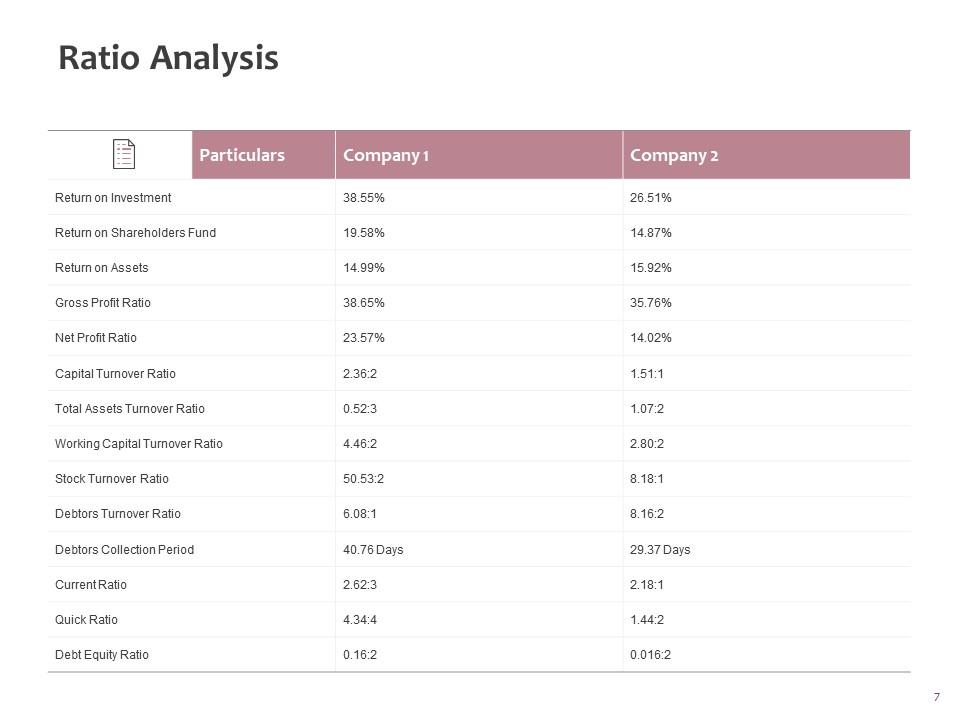
Slide 7: This slide shows Ratio Analysis in tabular form.
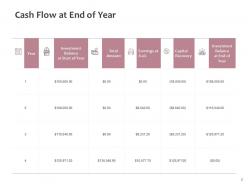
Slide 8: This slide presents Cash Flow at End of Year with investment balance, earning rate and capital recovery.
Slide 9: This slide displays Fixed Assets Annual Report with depriciation included.
Slide 10: This is another slide continuing Fixed Assets Annual Report.
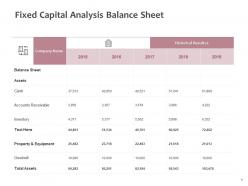
Slide 11: This slide represents Fixed Capital Analysis Balance Sheet.
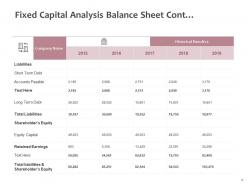
Slide 12: This is another slide continuing Fixed Capital Analysis Balance Sheet.
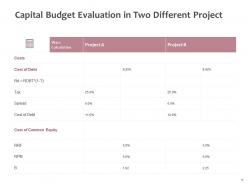
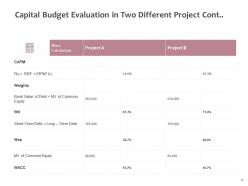
Slide 13: This slide showcases Capital Budget Evaluation in Two Different Project.
Slide 14: This is another slide continuing Capital Budget Evaluation in Two Different Project.
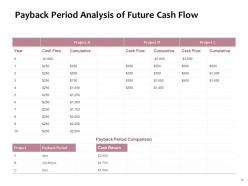
Slide 15: This slide shows Payback Period Analysis of Future Cash Flow.
Slide 16: This slide presents Marketing Return on Investment (ROI).
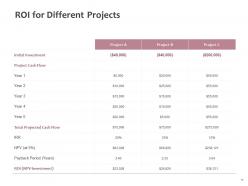
Slide 17: This slide displays ROI for Different Projects.
Slide 18: This slide represents Cost Summary Roi Analysis Example.
Slide 19: This slide showcases Four Stages of Return Investment Model as- Exposure, Engagement, Influence, Action.
Slide 20: This slide shows ROI Calculation Tables on yearly basis.
Slide 21: This slide presents Payback Table with working capital, cash profit, loss of income, net cash flow etc.
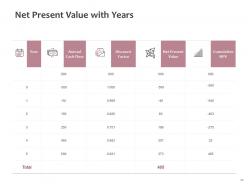
Slide 22: This slide displays Net Present Value with Years.
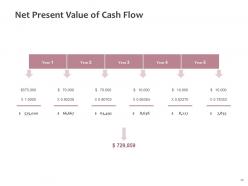
Slide 23: This slide represents Net Present Value of Cash Flow.
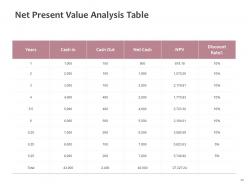
Slide 24: This slide showcases Net Present Value Analysis Table.
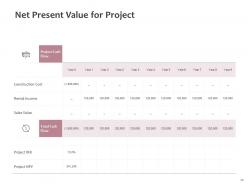
Slide 25: This slide shows Net Present Value for Project.
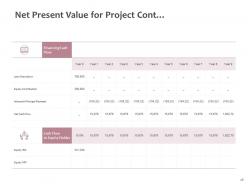
Slide 26: This is another slide continuing Net Present Value for Project.
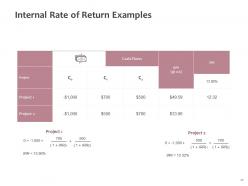
Slide 27: This slide presents Internal Rate of Return Examples.
Slide 28: This slide reminds about 15 minutes Coffee Break.
Slide 29: This slide displays Fixed Investment Analysis Icons.
Slide 30: This slide is titled as Additional Slides for moving forward.
Slide 31: This is About Us slide to show company specifications etc.
Slide 32: This is Meet Our Team slide with names and designation.
Slide 33: This is Our Mission slide with related imagery and text.
Slide 34: This is an Idea Generation slide to state a new idea or highlight information, specifications etc.
Slide 35: This is Meet Our Team slide with names and designation.
Slide 36: This is a Comparison slide to state comparison between commodities, entities etc.
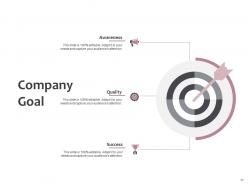
Slide 37: This slide shows Company Goal. State your main goals here.
Slide 38: This is a Puzzle slide with text boxes.
Slide 39: This is a Thank You slide with address, contact numbers and email address.
Fixed investment analysis powerpoint presentation slides with all 39 slides:
Use our Fixed Investment Analysis Powerpoint Presentation Slides to effectively help you save your valuable time. They are readymade to fit into any presentation structure.
-
The Designed Graphic are very professional and classic.
-
Unique and attractive product design.
-
Appreciate the research and its presentable format.
-
Qualitative and comprehensive slides.
-
Enough space for editing and adding your own content.


