Bell curve showing iq test score range
Our Bell Curve Showing IQ Test Score Range are topically designed to provide an attractive backdrop to any subject. Use them to look like a presentation pro.
- Google Slides is a new FREE Presentation software from Google.
- All our content is 100% compatible with Google Slides.
- Just download our designs, and upload them to Google Slides and they will work automatically.
- Amaze your audience with SlideTeam and Google Slides.
-
Want Changes to This PPT Slide? Check out our Presentation Design Services
- WideScreen Aspect ratio is becoming a very popular format. When you download this product, the downloaded ZIP will contain this product in both standard and widescreen format.
-

- Some older products that we have may only be in standard format, but they can easily be converted to widescreen.
- To do this, please open the SlideTeam product in Powerpoint, and go to
- Design ( On the top bar) -> Page Setup -> and select "On-screen Show (16:9)” in the drop down for "Slides Sized for".
- The slide or theme will change to widescreen, and all graphics will adjust automatically. You can similarly convert our content to any other desired screen aspect ratio.
Compatible With Google Slides

Get This In WideScreen
You must be logged in to download this presentation.
PowerPoint presentation slides
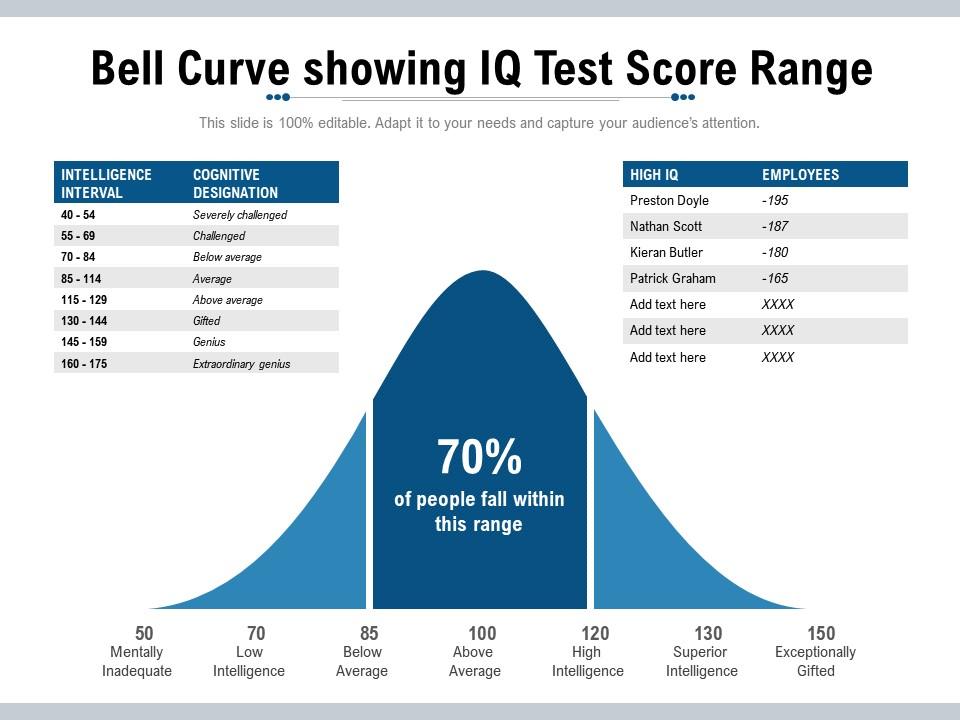
Presenting this set of slides with name Bell Curve Showing IQ Test Score Range. This is a one stage process. The stages in this process are Mentally Inadequate, Low Intelligence, Superior Intelligence. This is a completely editable PowerPoint presentation and is available for immediate download. Download now and impress your audience.
People who downloaded this PowerPoint presentation also viewed the following :
Content of this Powerpoint Presentation
Subject-matter expertise is secondary to a person's validity of their capability to do things and make their way in the world. It has always always been the IQ assessment that has mattered foremost. Be it the corporate, or government examinations, candidates are subjected to aptitude and reasoning tests to assess their cognitive abilities, abstract thinking, and problem-solving skills and attention to detail. Based on such IQ assessments, hirings, promotions, and even, dismissals are announced. However, as a pool of candidates are evaluated, a range of IQ results are filtered out because of individual capabilities and intellects. There'll be two extremes and many categories in between.
This spectrum forms the basis of varied levels of appreciation that contestants will receive.
To study and depict the ranges of IQs that identify gradings that your organization recognizes, our presentation experts have curated this bell-curve PPT Design to show those grading levels. The PPT Slide also illustrates scores of applicants who have undergone evaluation to rate their mental and cognitive faculties. Let's explore the purpose and use of this PPT Layout below:
Template 1: Bell Curve Showing IQ Test Score Range PPT Template

Use this PowerPoint Diagram to measure and estimate the IQ level of your interviewees. It features an Excel-linked bell curve to categorize candidates on a scale between mentally inadequate and exceptionally gifted. Other categories in between are shown as low intelligence, below average, above average, high intelligence, and superior intelligence. This intricate-spectrum will help you locate 7 categories and candidates that fall under the intervals created. Using this PPT Guide, you can further grade subjects to understand their mental views and processes.
Here's another PPT Design to examine the intellect diversity of your interviewees.
Know the Pool of Brain Power Being Examined
Grab this powerful PPT Diagram to differentiate the exceptionally gifted from the mentally inadequate and to know the ranges of brain power and competence that is linked to each.
PS: Get creative with human IQ evaluation using this bell diagram PPT Layout featuring infographics from tests and interviews of a lot of people.
Bell curve showing iq test score range with all 2 slides:
Use our Bell Curve Showing IQ Test Score Range to effectively help you save your valuable time. They are readymade to fit into any presentation structure.
-
Understandable and informative presentation.


