FMEA To Identify Potential Failure Modes Powerpoint Presentation Slides
FMEA is a technique that various companies use to detect product failures or defects. It is a qualitative and highly structured process used by analysts looking to reduce the chances of faults by detecting problems and their possible repercussions. Here is a professionally designed template on FMEA to Identify Potential Failure Modes that is useful for the corporates specifically production companies that want to identify potential risks regarding occupational and health hazards and environmental hazards. This can also be used by the companies that have just initiated a new process and want to identify the potential threats failure in the process. The deck covered the details related to sections such as FMEA process overview, team structure and responsibilities, possible effects and cause of the failure, Severity, Occurrence, and Detection SOD ranking, risk assessment, action steps to eliminate the failure, RPN Risk priority number calculations, etc. The presentation covers critical steps involved in the process, analysis of the process, fundamental failure modes, potential effects of failure mode, FMEA scoring regarding SOD, etc. Customize this 100 percent editable template now.
FMEA is a technique that various companies use to detect product failures or defects. It is a qualitative and highly struct..
- Google Slides is a new FREE Presentation software from Google.
- All our content is 100% compatible with Google Slides.
- Just download our designs, and upload them to Google Slides and they will work automatically.
- Amaze your audience with SlideTeam and Google Slides.
-
Want Changes to This PPT Slide? Check out our Presentation Design Services
- WideScreen Aspect ratio is becoming a very popular format. When you download this product, the downloaded ZIP will contain this product in both standard and widescreen format.
-

- Some older products that we have may only be in standard format, but they can easily be converted to widescreen.
- To do this, please open the SlideTeam product in Powerpoint, and go to
- Design ( On the top bar) -> Page Setup -> and select "On-screen Show (16:9)” in the drop down for "Slides Sized for".
- The slide or theme will change to widescreen, and all graphics will adjust automatically. You can similarly convert our content to any other desired screen aspect ratio.
Compatible With Google Slides

Get This In WideScreen
You must be logged in to download this presentation.
PowerPoint presentation slides
Deliver an informational PPT on various topics by using this FMEA To Identify Potential Failure Modes Powerpoint Presentation Slides. This deck focuses and implements best industry practices, thus providing a birds eye view of the topic. Encompassed with fifty four slides, designed using high quality visuals and graphics, this deck is a complete package to use and download. All the slides offered in this deck are subjective to innumerable alterations, thus making you a pro at delivering and educating. You can modify the color of the graphics, background, or anything else as per your needs and requirements. It suits every business vertical because of its adaptable layout
People who downloaded this PowerPoint presentation also viewed the following :
Content of this Powerpoint Presentation
Slide 1: This slide introduces FMEA to Identify Potential Failure Modes. State Your Company Name and begin.
Slide 2: This slide states Agenda of the presentation.
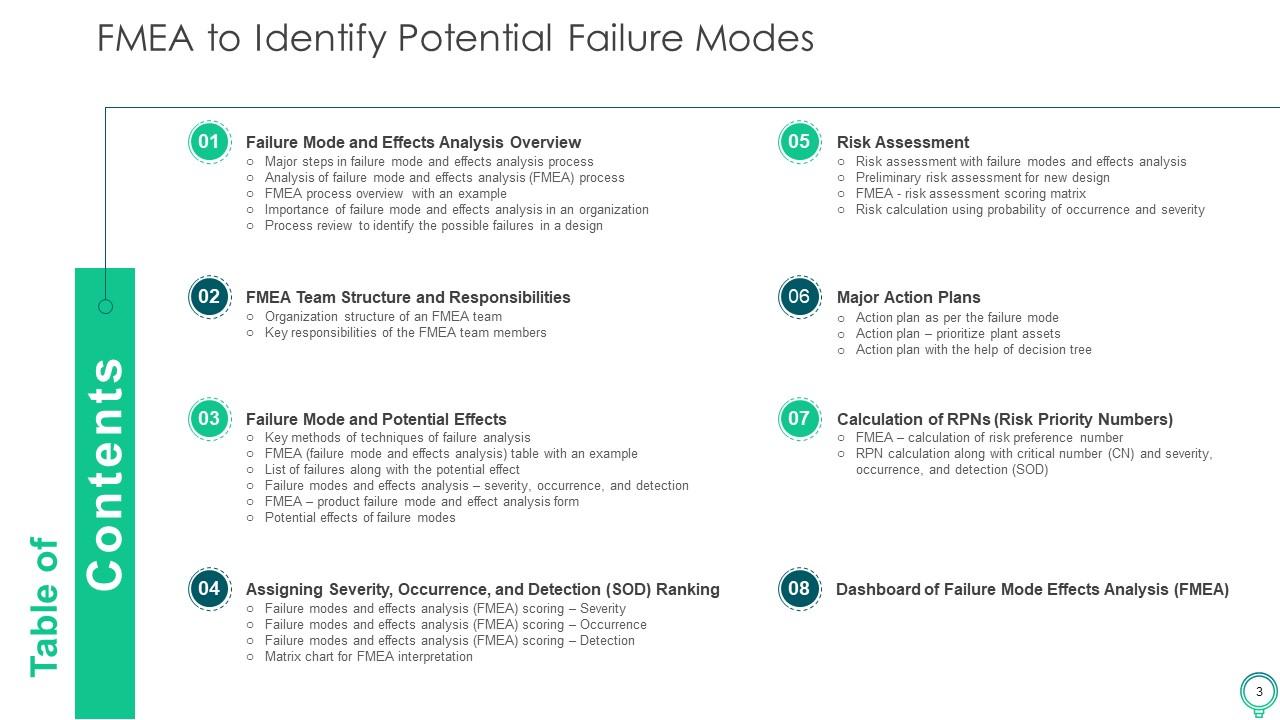
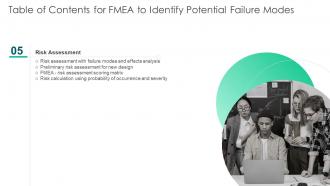
Slide 3: This slide presents Table of Content for the presentation.
Slide 4: This slide depicts title for five topics that are to be covered next in the template.
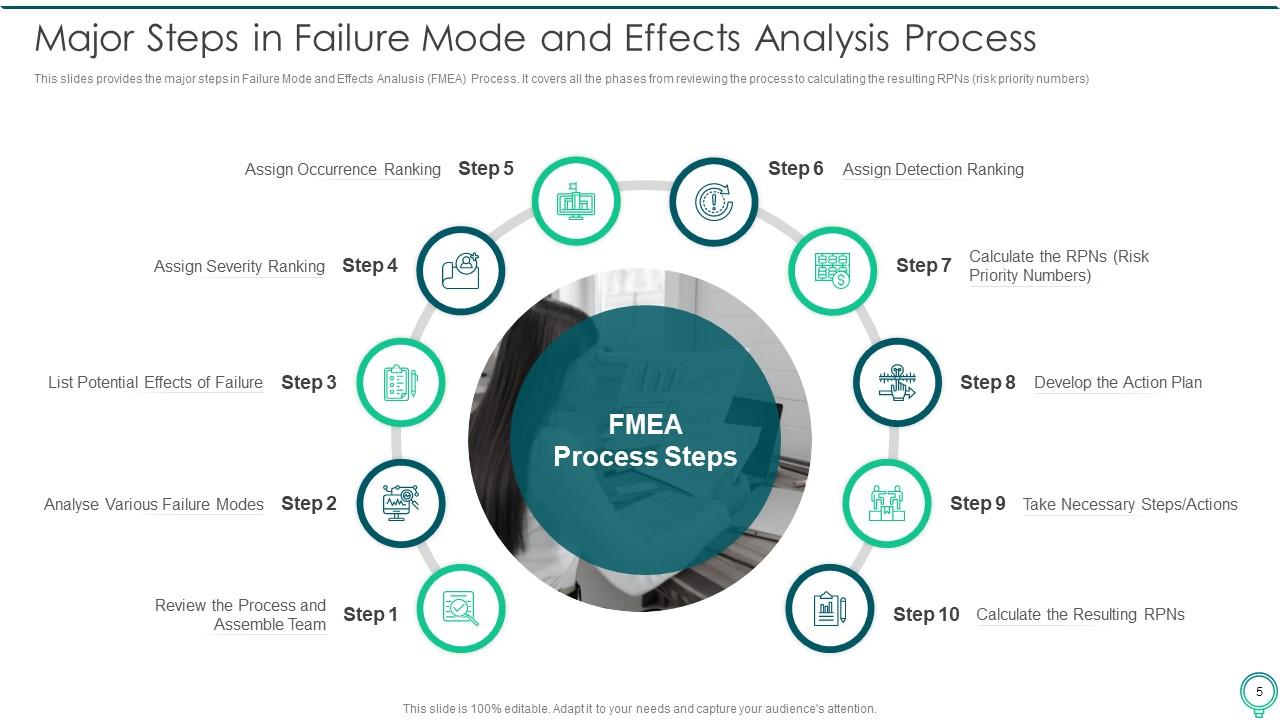
Slide 5: This slide provides the major steps in Failure Mode and Effects Analysis (FMEA) Process.
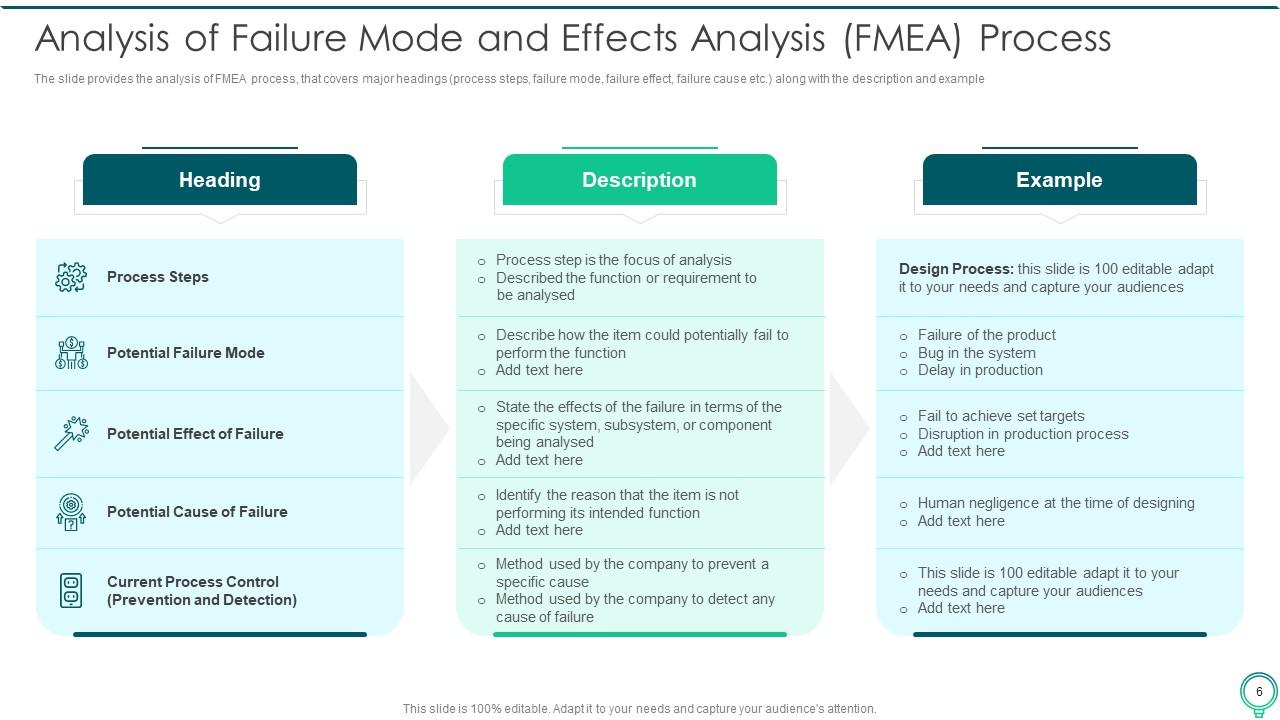
Slide 6: The slide provides the analysis of FMEA process, that covers major headings (process steps, failure mode, failure effect, failure cause etc.).
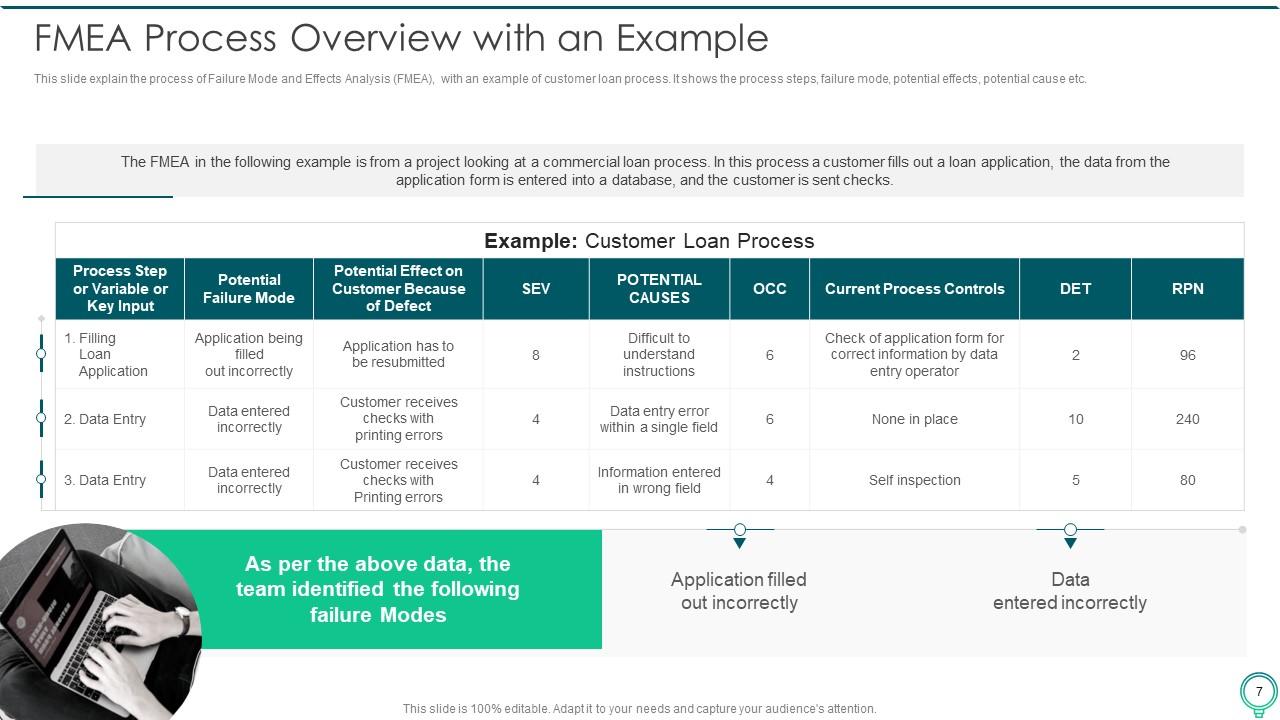
Slide 7: This slide explain the process of Failure Mode and Effects Analysis (FMEA), with an example of customer loan process.
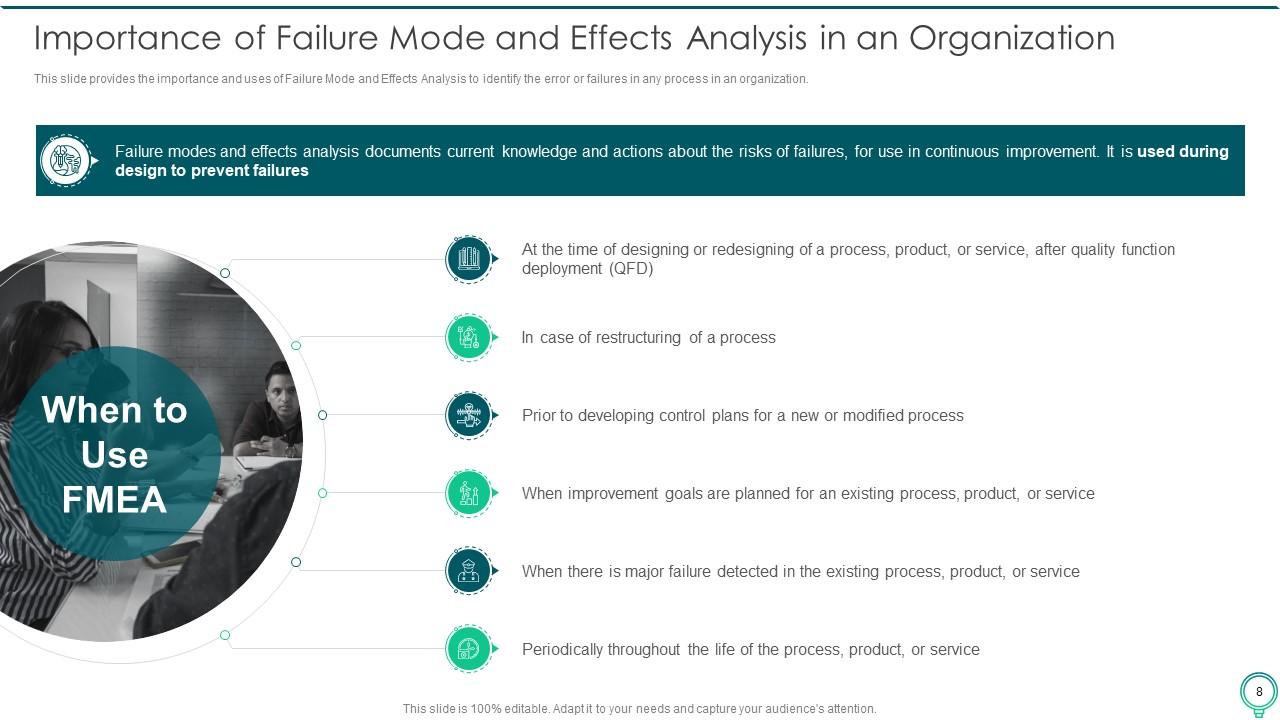
Slide 8: This slide provides the importance and uses of Failure Mode and Effects Analysis to identify the error or failures in any process in an organization.
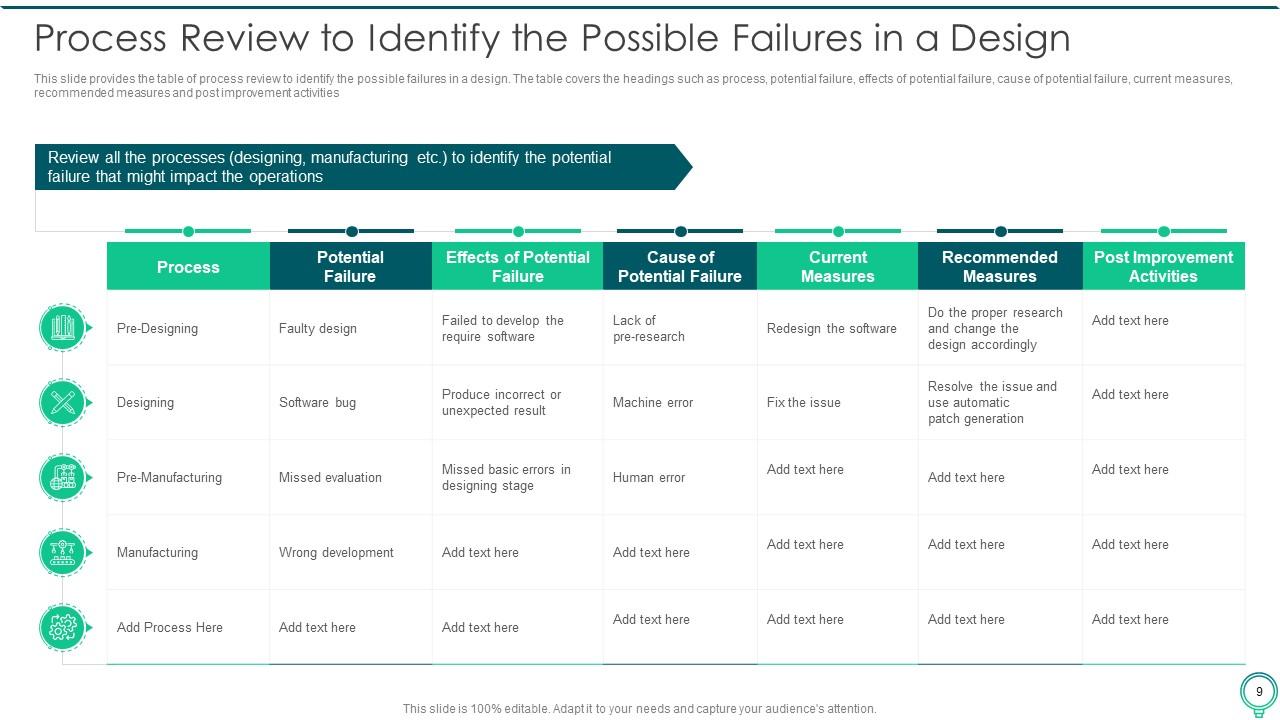
Slide 9: This slide provides the table of process review to identify the possible failures in a design.
Slide 10: This slide depicts title for two topics that are to be covered next in the template.
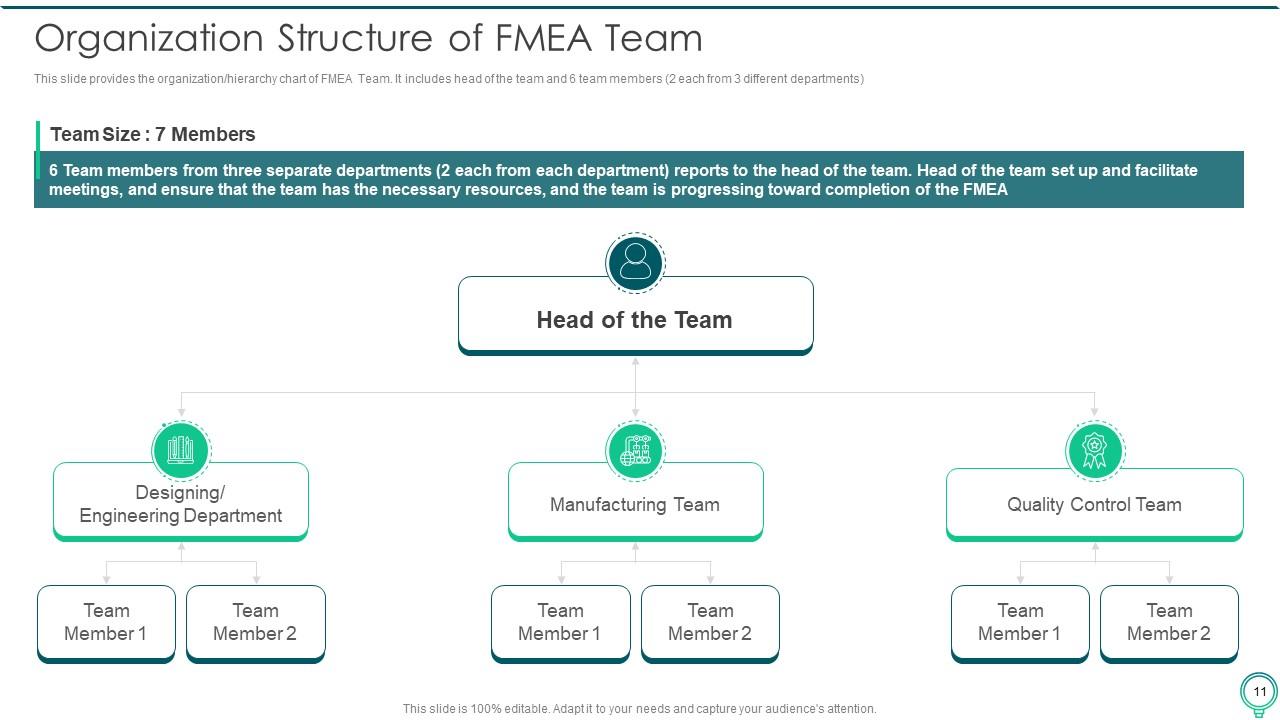
Slide 11: This slide provides the organization/hierarchy chart of FMEA Team.
Slide 12: This slide provides the image, name, designation, and key roles and responsibilities of the team members of FMEA team.
Slide 13: This slide depicts title for six topics that are to be covered next in the template.
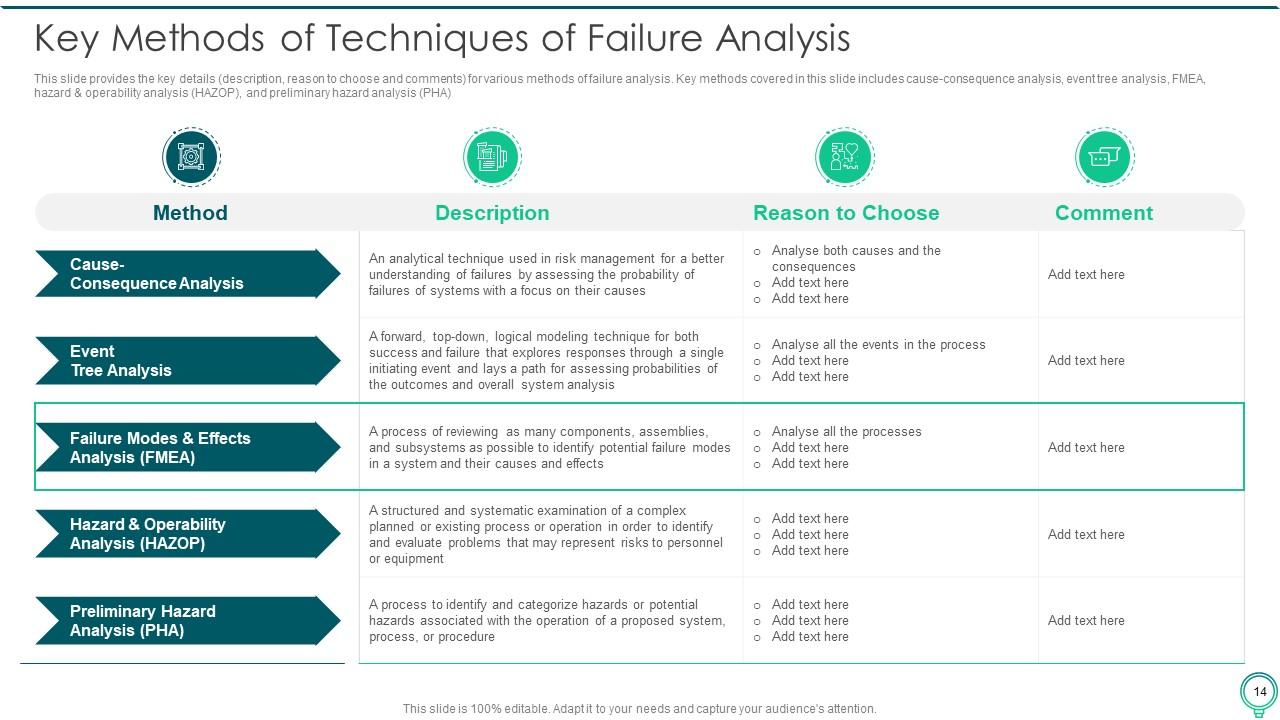
Slide 14: This slide provides the key details (description, reason to choose and comments) for various methods of failure analysis.
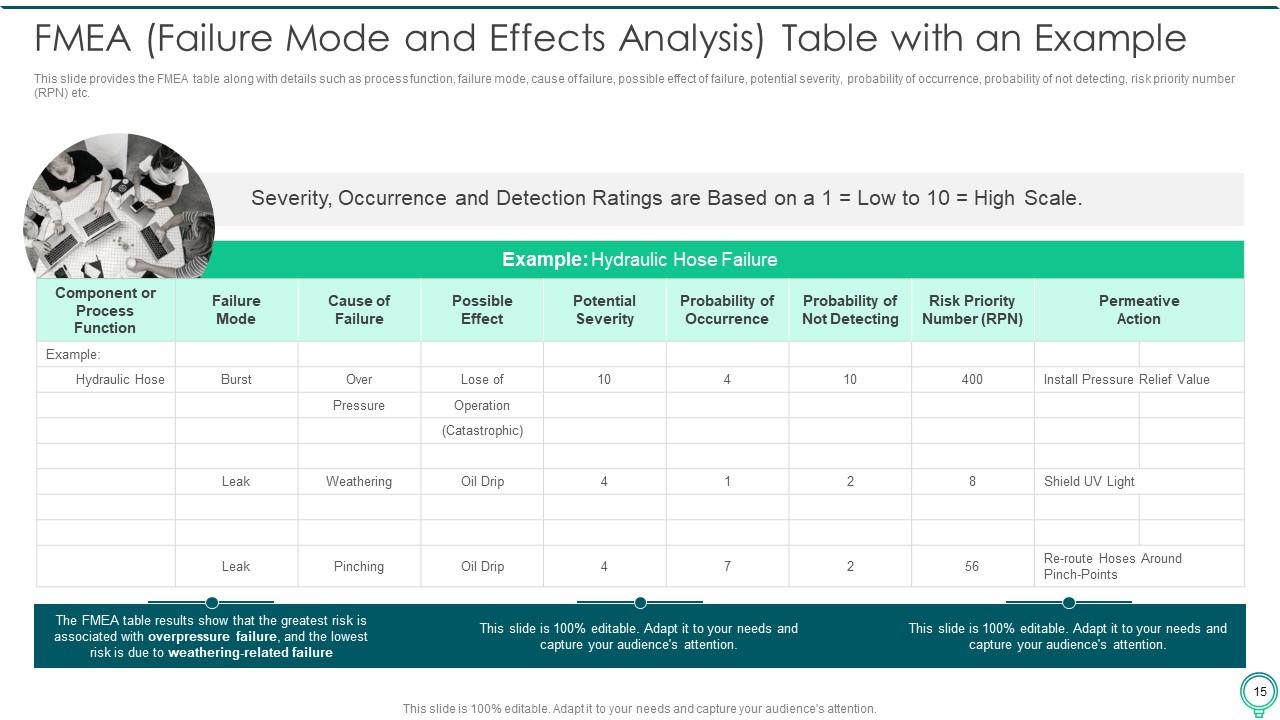
Slide 15: This slide provides the FMEA table along with details such as process function, failure mode, cause of failure, etc.
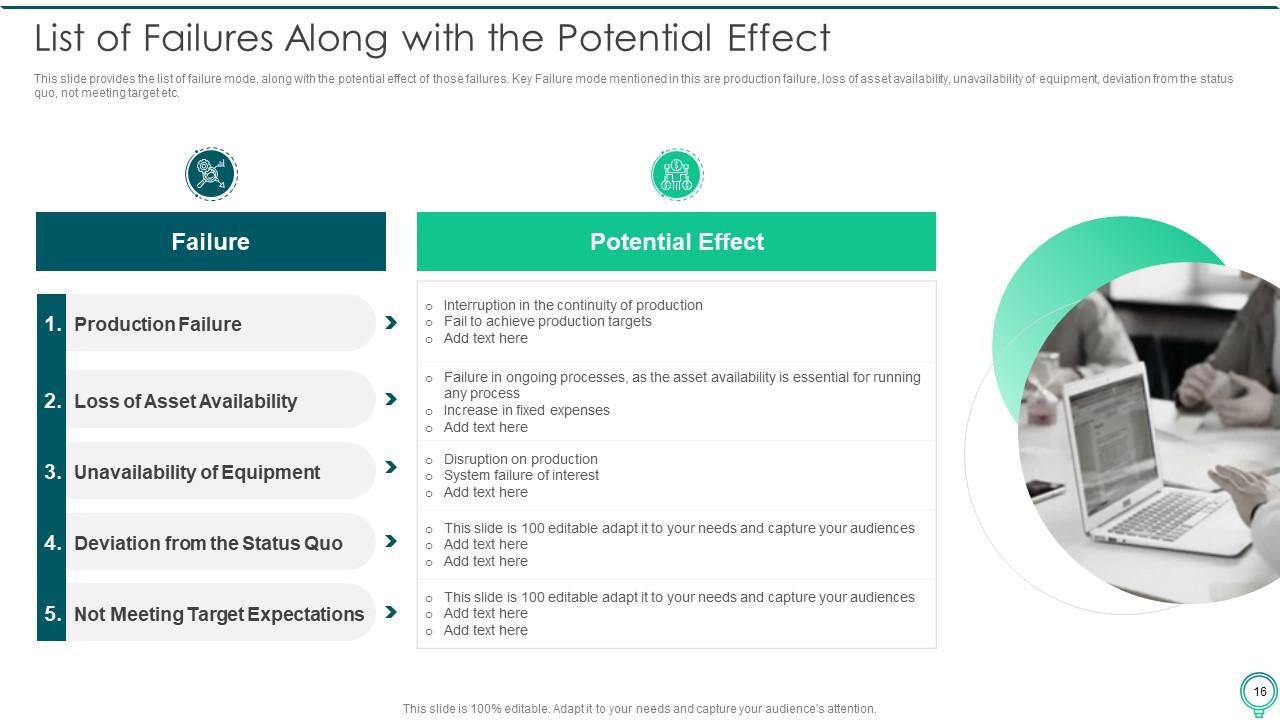
Slide 16: This slide provides the list of failure mode, along with the potential effect of those failures.
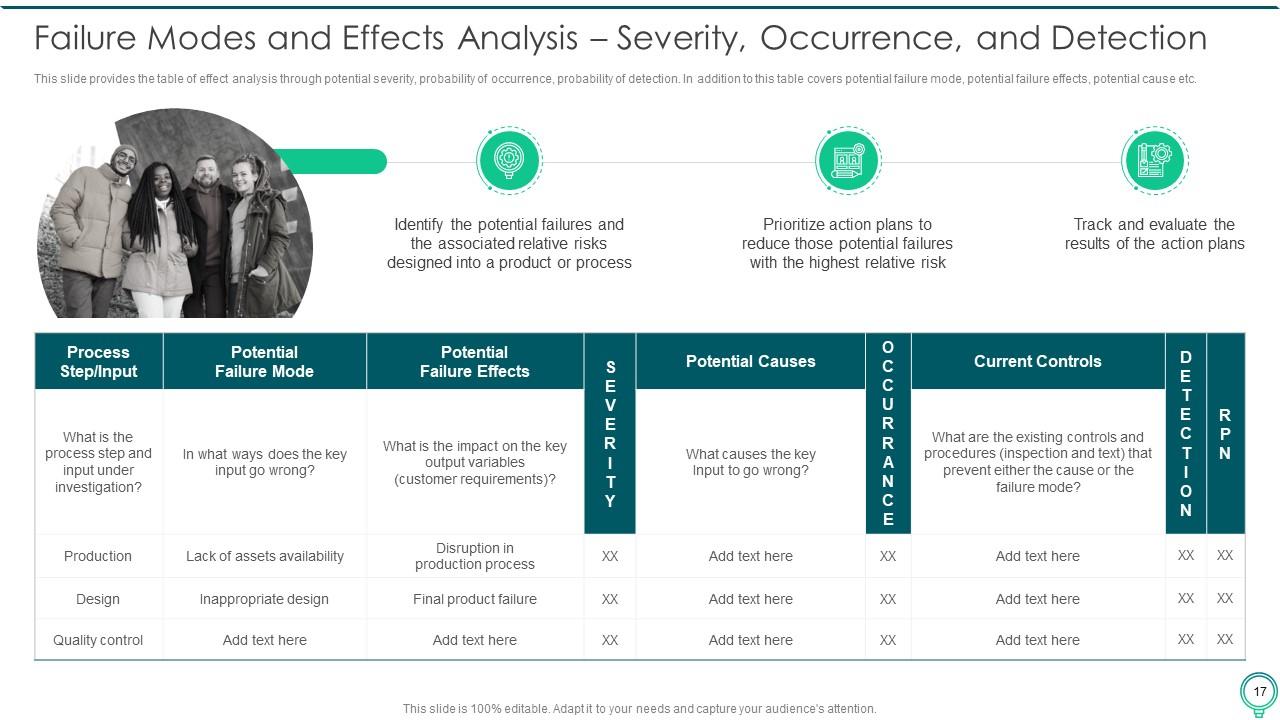
Slide 17: This slide provides the table of effect analysis through potential severity, probability of occurrence, probability of detection.
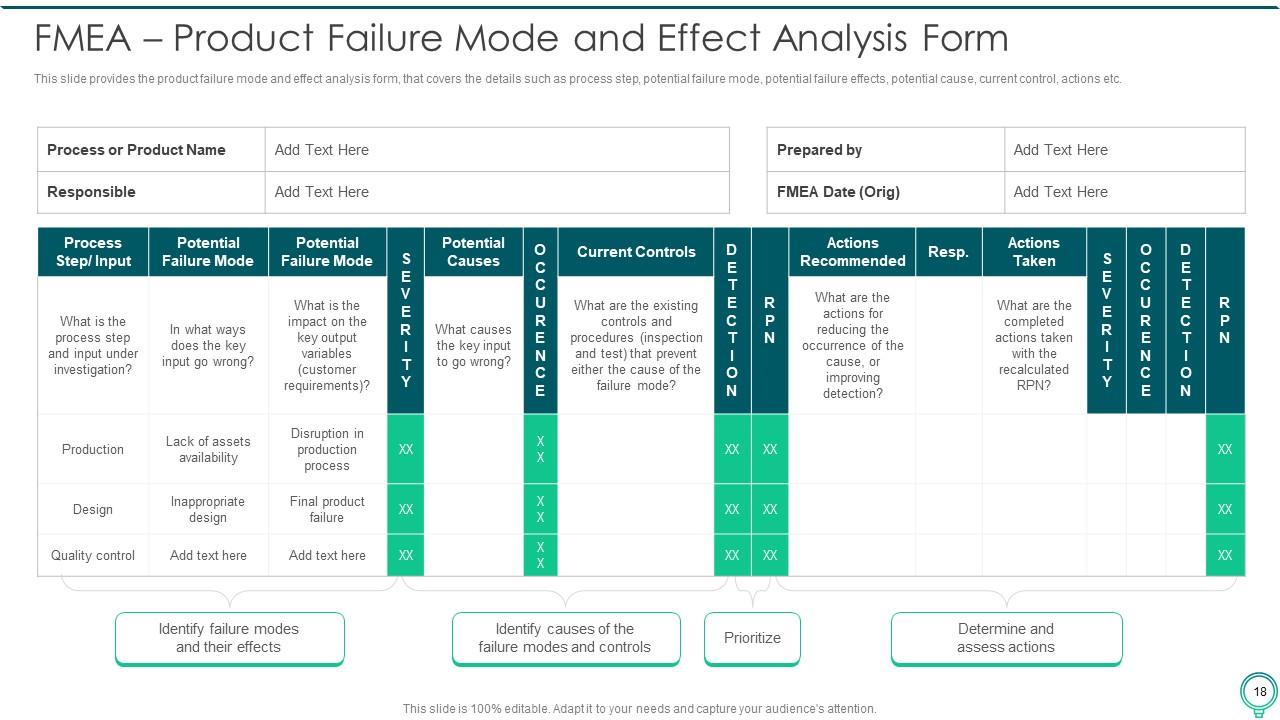
Slide 18: This slide provides the product failure mode and effect analysis form, that covers the details such as process step, potential failure mode, etc.
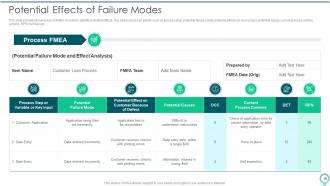
Slide 19: This slide provides the process of FMEA in order to identify potential effects.
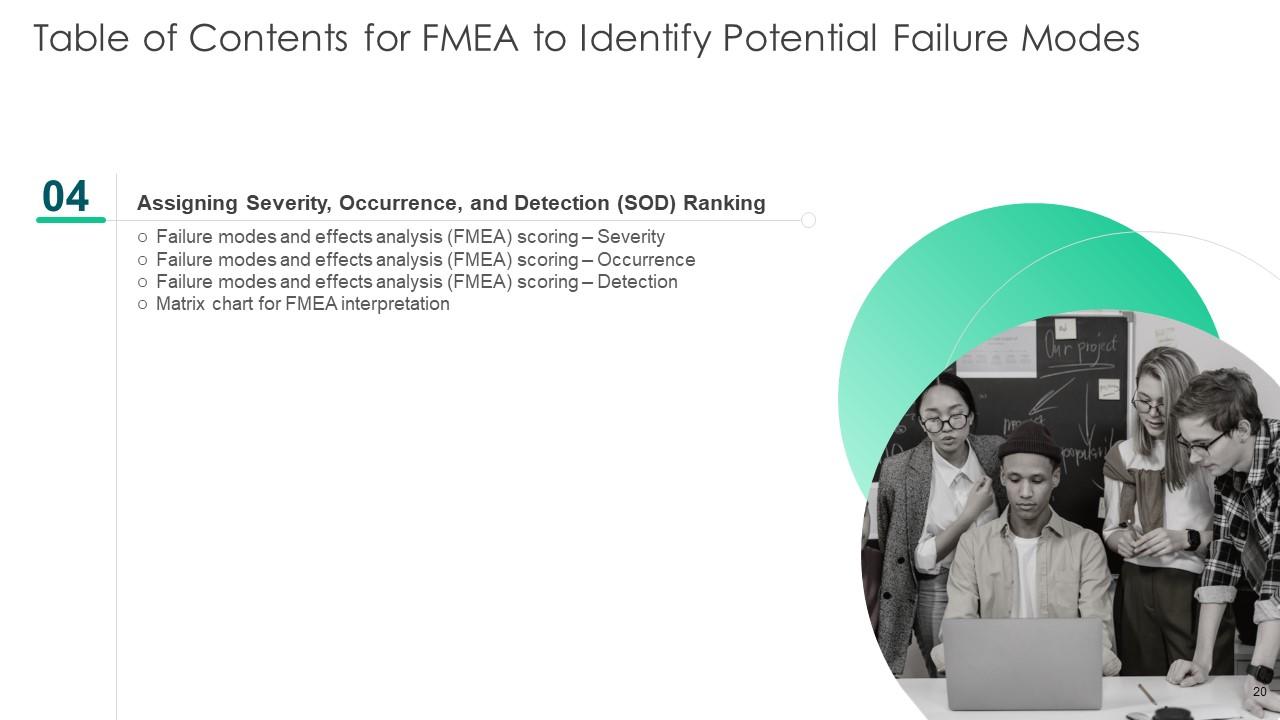
Slide 20: This slide depicts title for four topics that are to be covered next in the template.
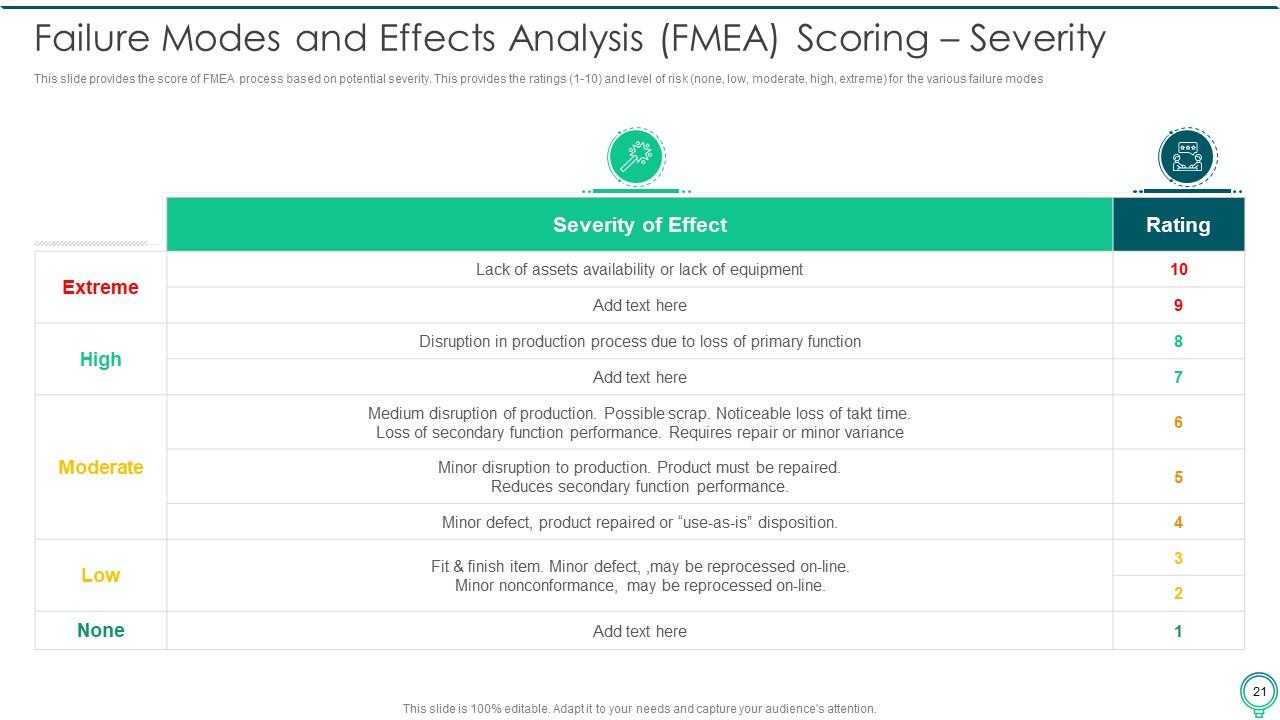
Slide 21: This slide provides the score of FMEA process based on potential severity.
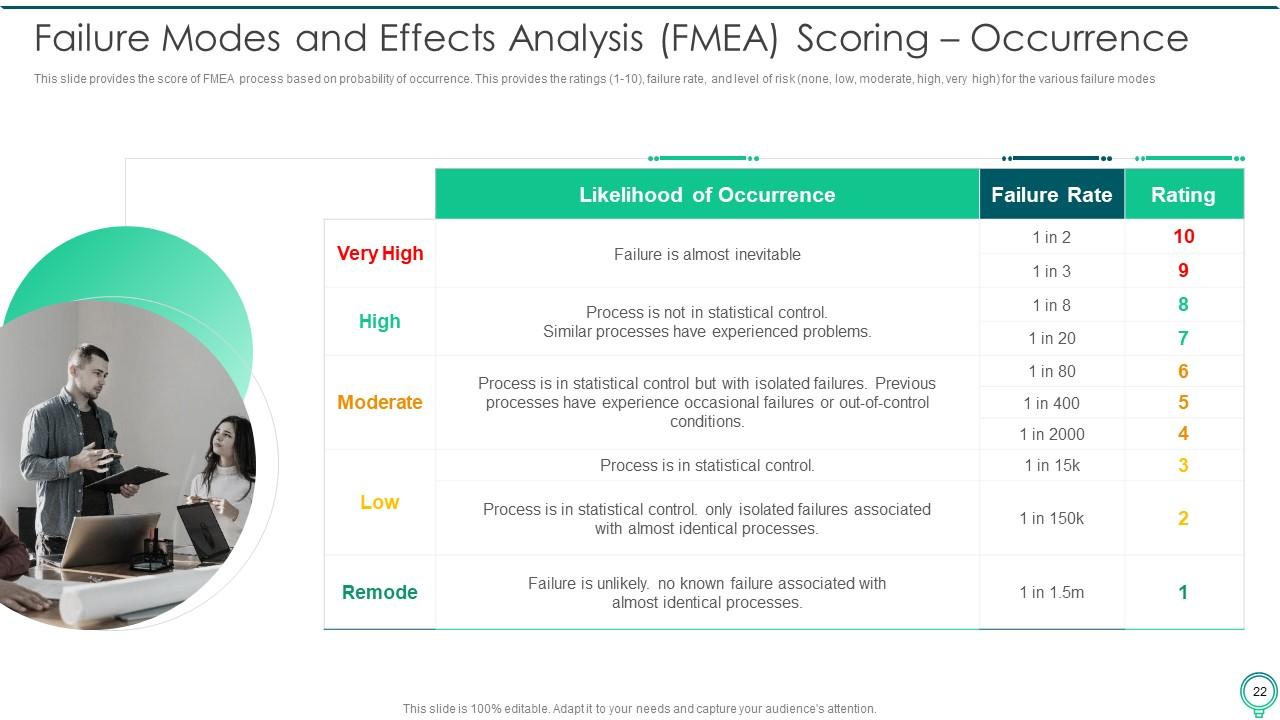
Slide 22: This slide provides the score of FMEA process based on probability of occurrence.
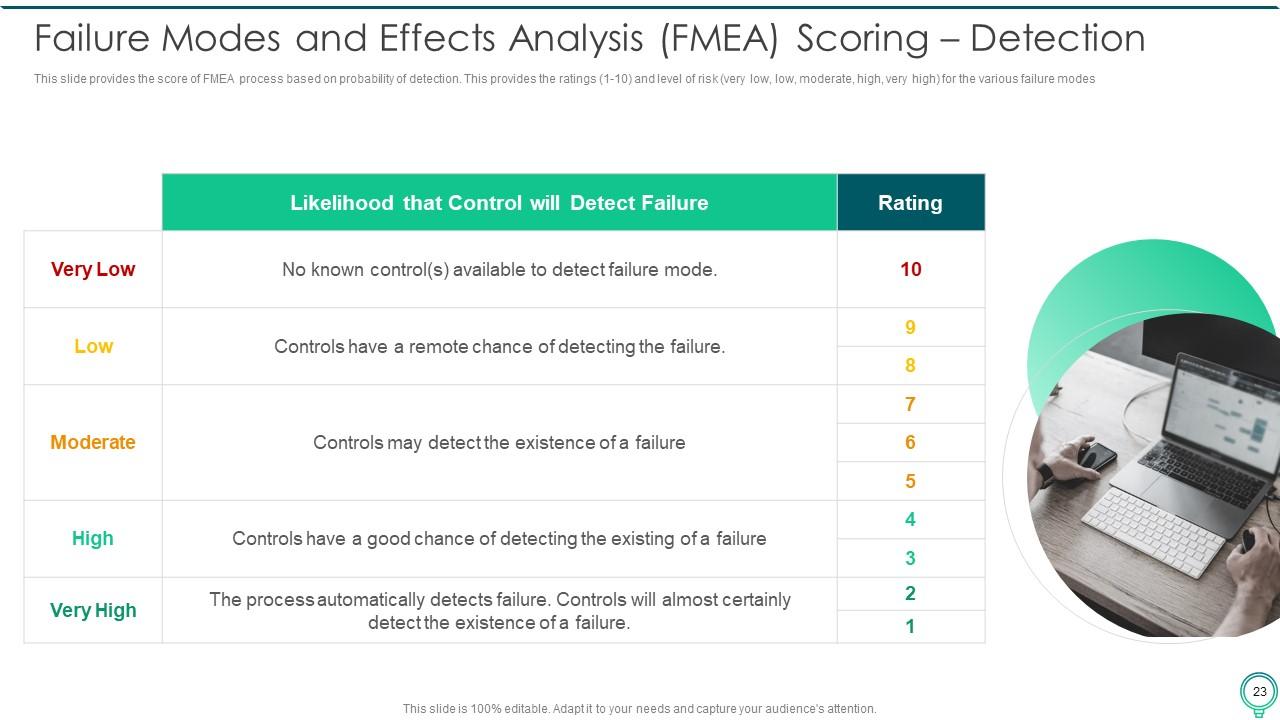
Slide 23: This slide provides the score of FMEA process based on probability of detection.
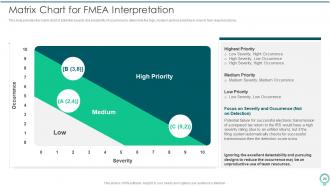
Slide 24: This slide provides the matrix chart of potential severity and probability of occurrence to determine the high, medium and low priorities.
Slide 25: This slide depicts title for four topics that are to be covered next in the template.
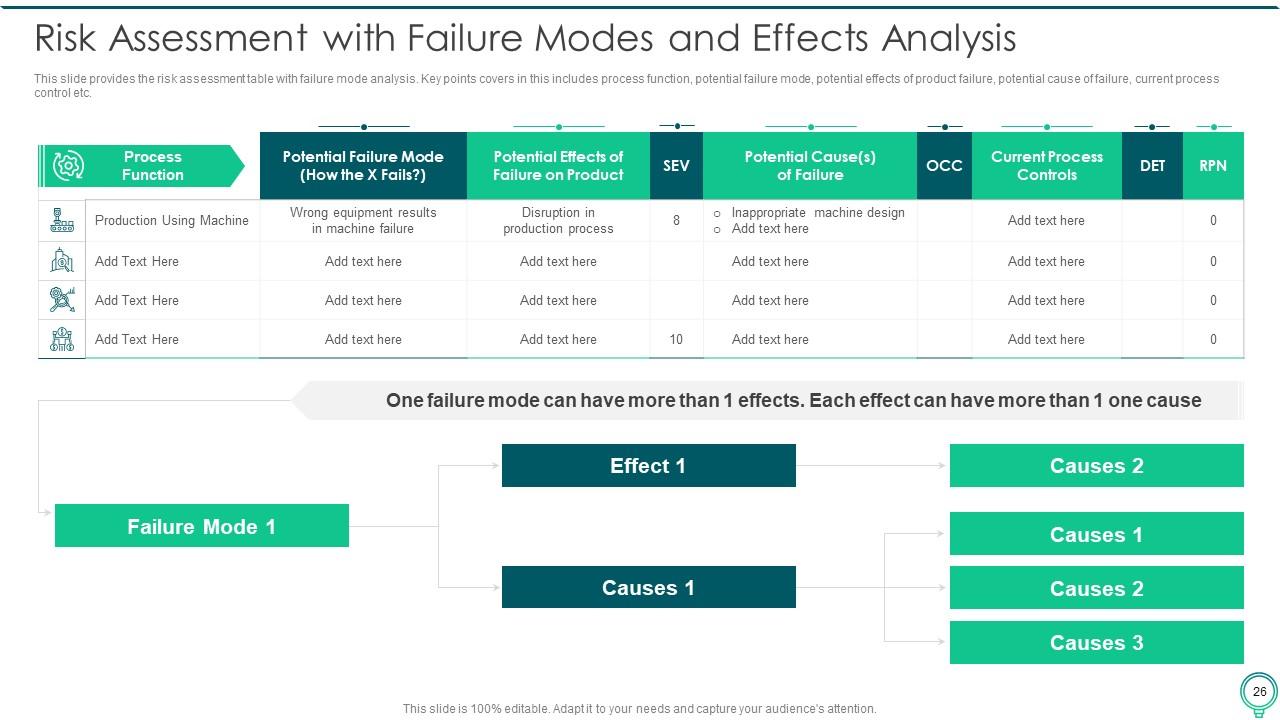
Slide 26: This slide provides the risk assessment table with failure mode analysis.
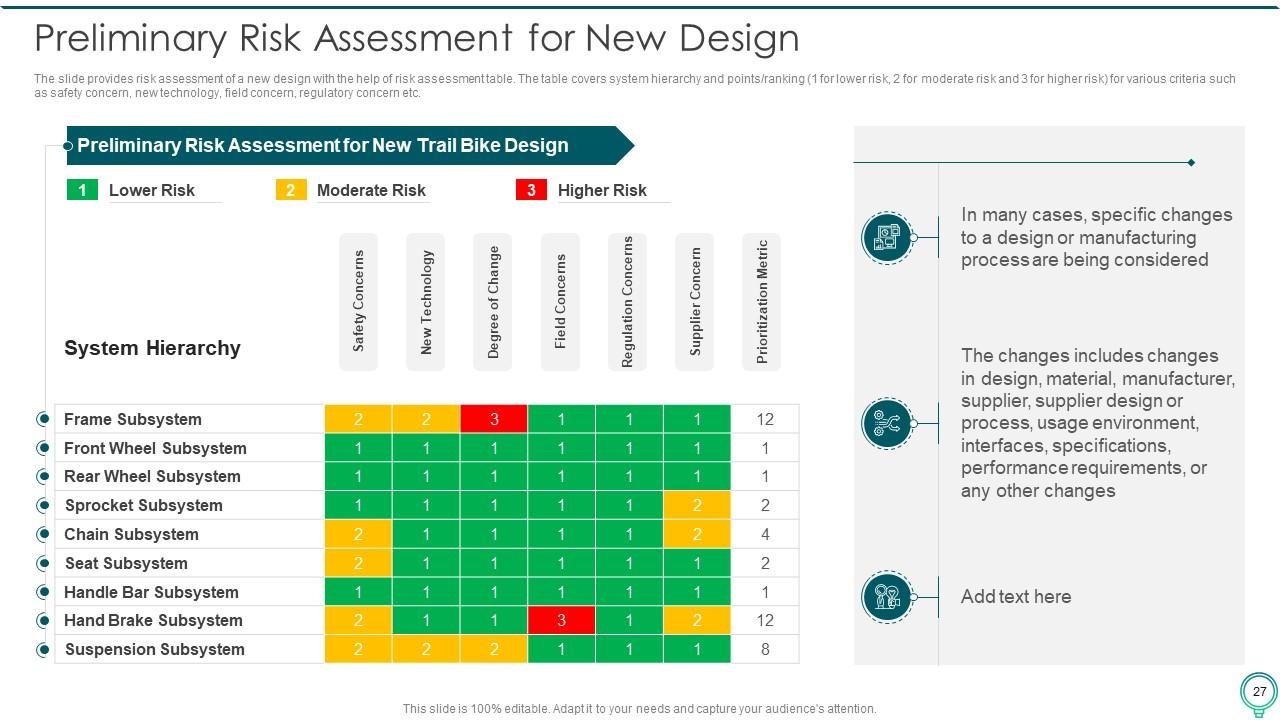
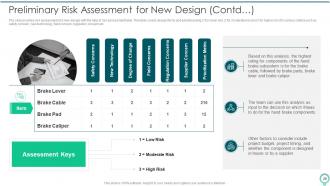
Slide 27: The slide provides risk assessment of a new design with the help of risk assessment table.
Slide 28: The slide provides risk assessment of a new design with the help of risk assessment table.
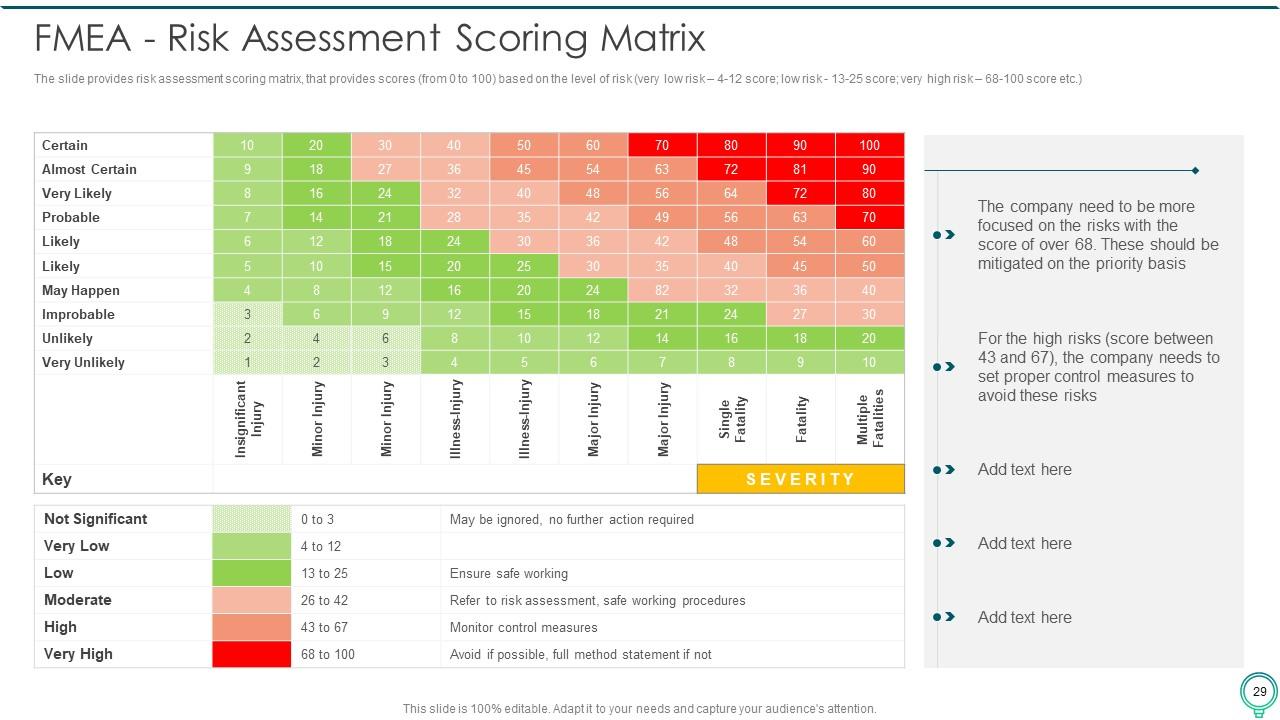
Slide 29: The slide provides risk assessment scoring matrix, that provides scores (from 0 to 100) based on the level of risk.
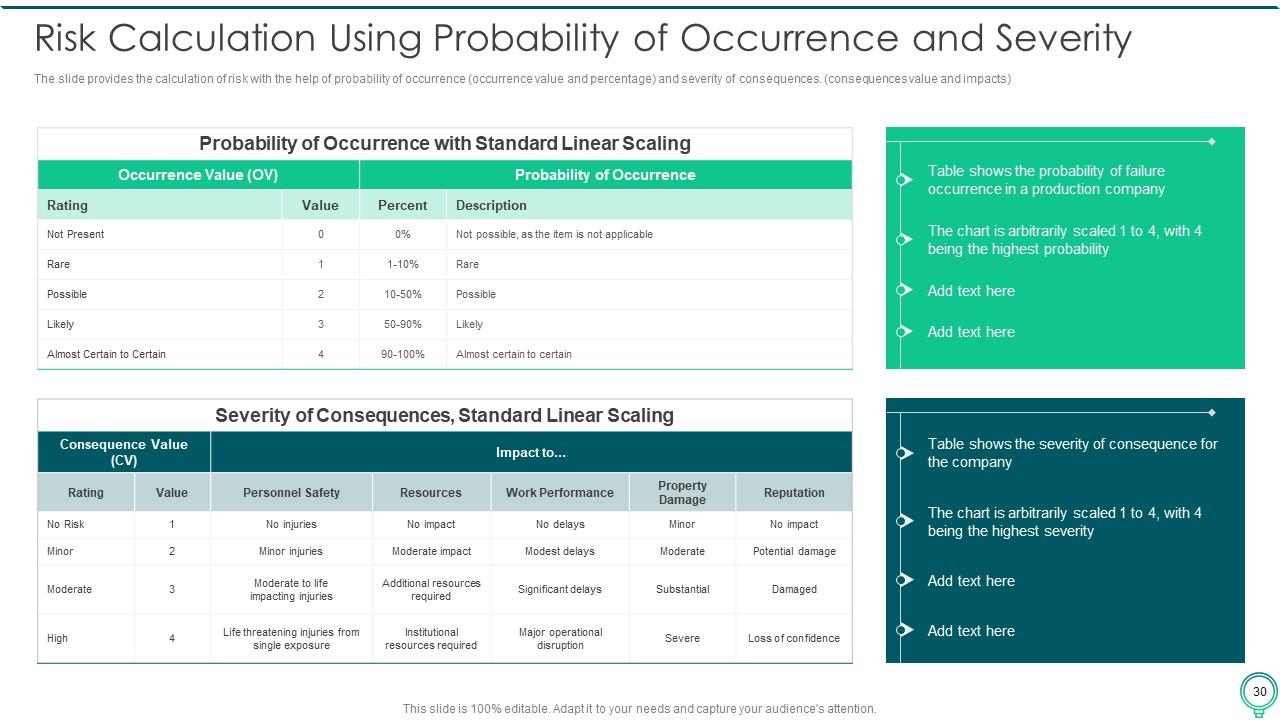
Slide 30: The slide provides the calculation of risk with the help of probability of occurrence and severity of consequences.
Slide 31: This slide depicts title for three topics that are to be covered next in the template.
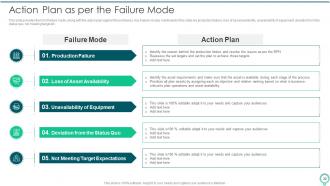
Slide 32: This slide provides the list of failure mode, along with the action plan against those failures.
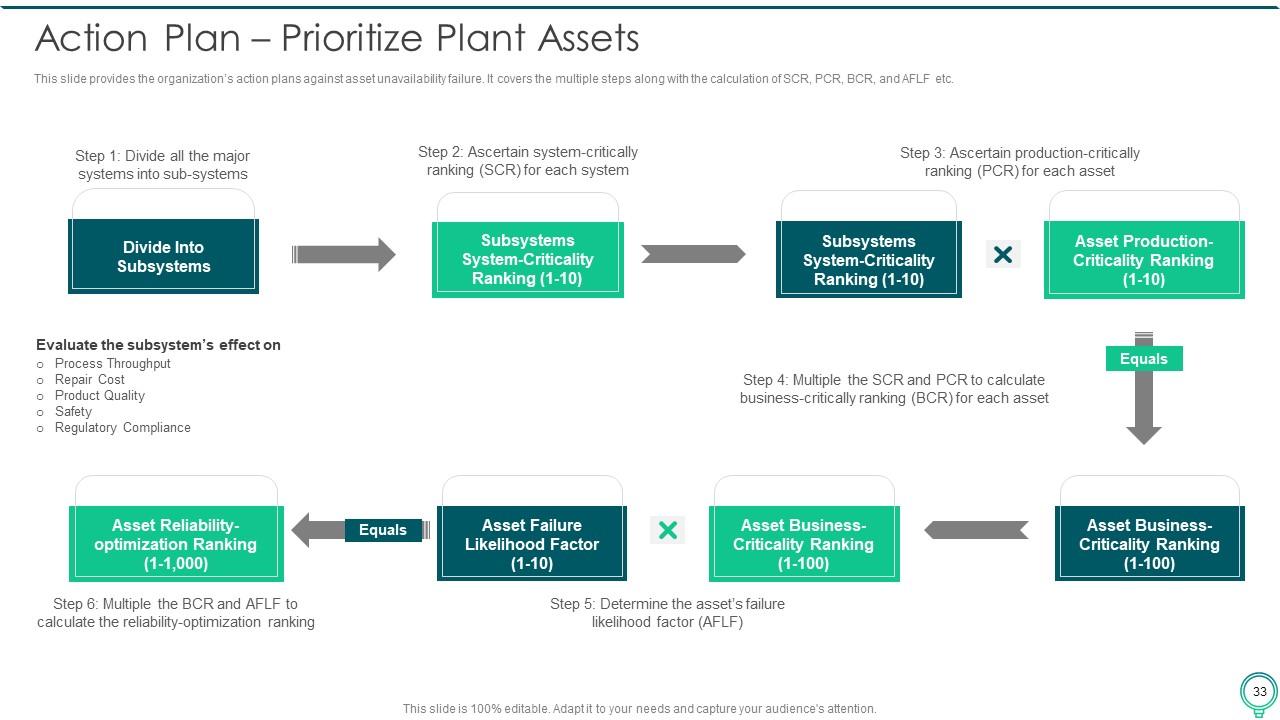
Slide 33: This slide provides the organization’s action plans against asset unavailability failure.
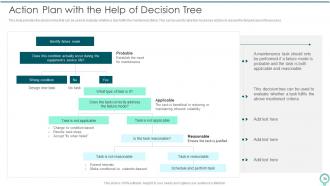
Slide 34: This slide provides the decision tree that can be used to evaluate whether a task fulfils the mentioned criteria.
Slide 35: This slide depicts title for two topics that are to be covered next in the template.
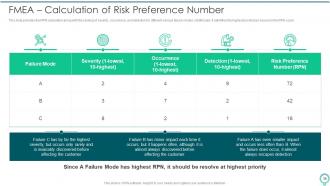
Slide 36: This slide provides the RPN calculation along with the ranking of severity, occurrence, and detection for different various failure modes.
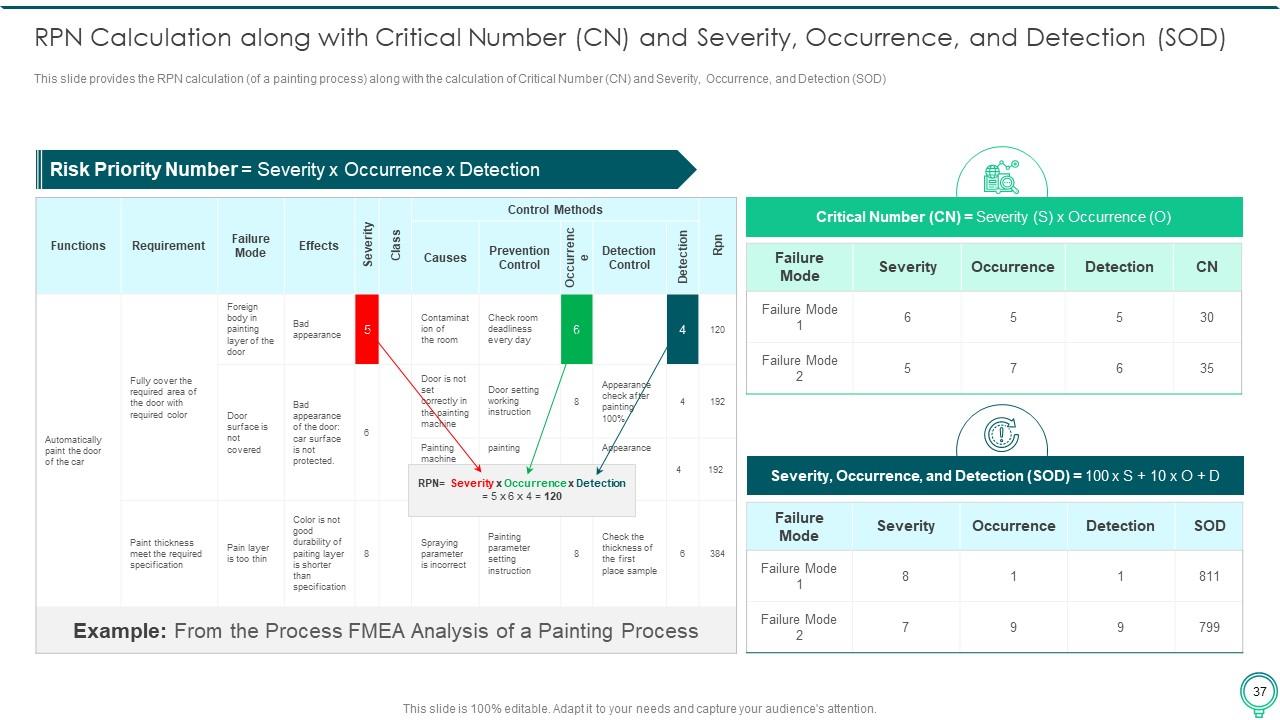
Slide 37: This slide provides the RPN calculation (of a painting process) along with the calculation of Critical Number (CN) and Severity, Occurrence, etc.
Slide 38: This slide depicts title for three topics that are to be covered next in the template.
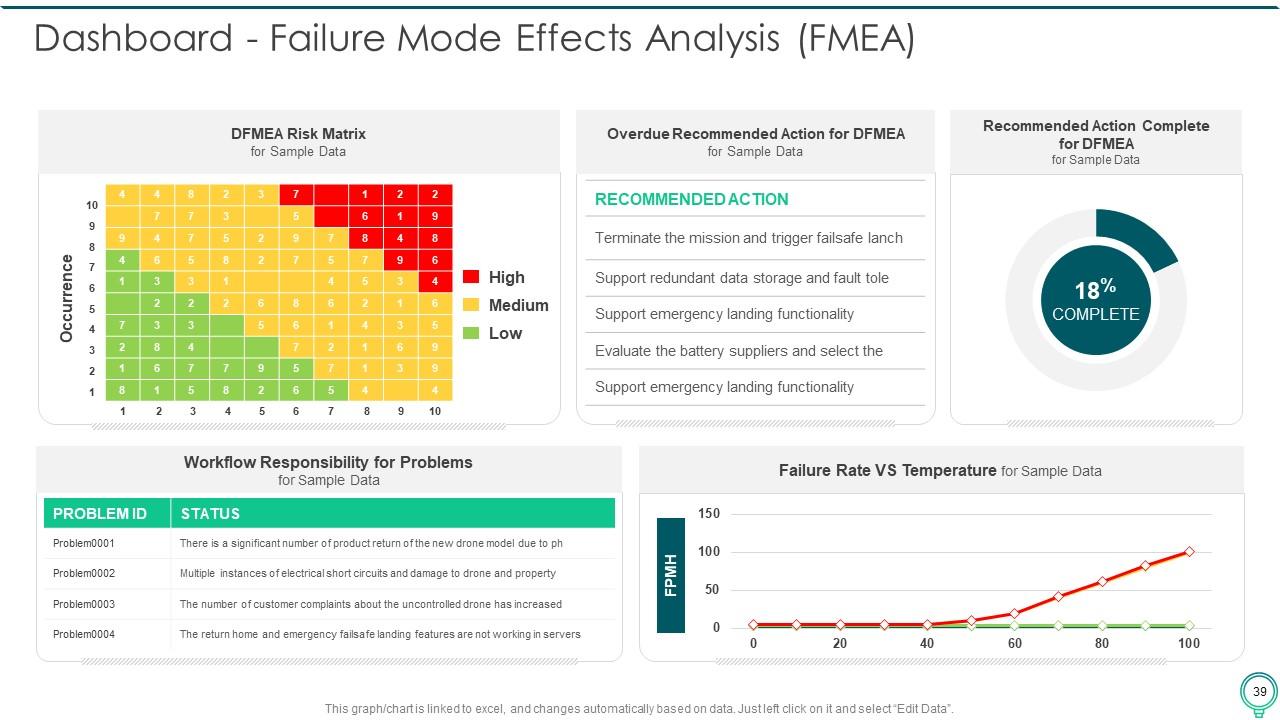
Slide 39: This slide presents Dashboard - Failure Mode Effects Analysis (FMEA).
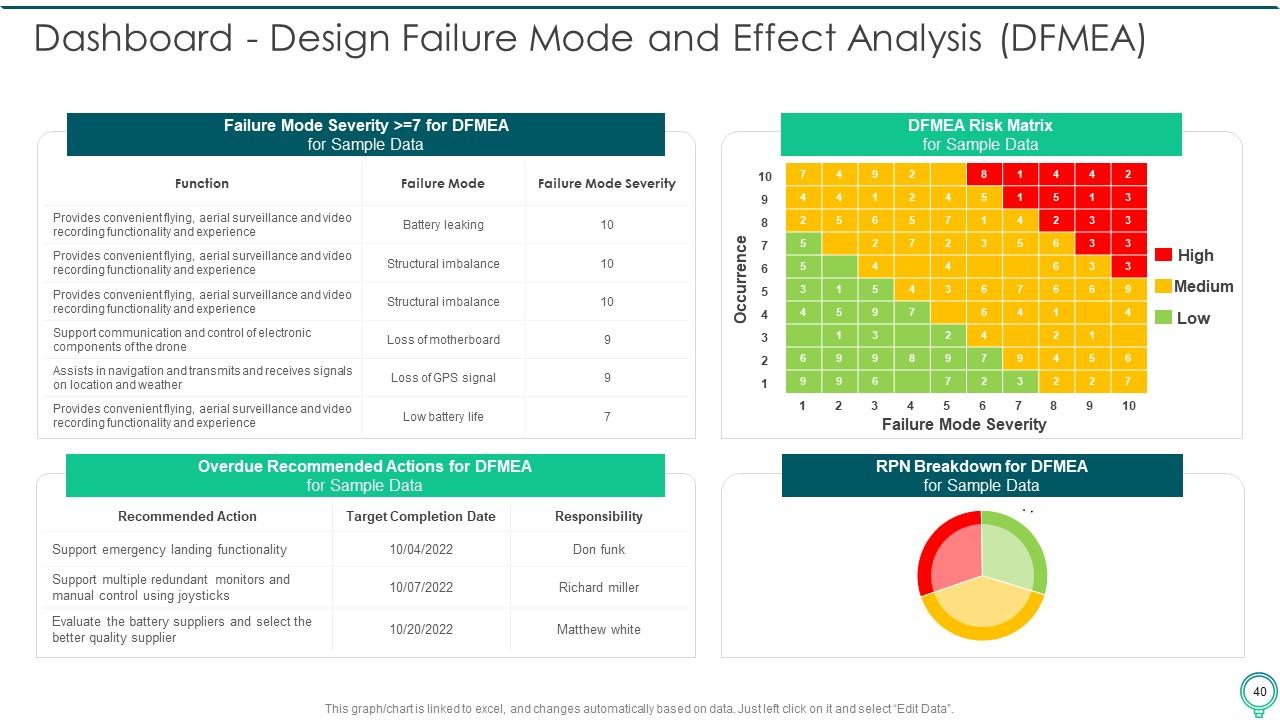
Slide 40: This slide exhibits Dashboard - Design Failure Mode and Effect Analysis (DFMEA).
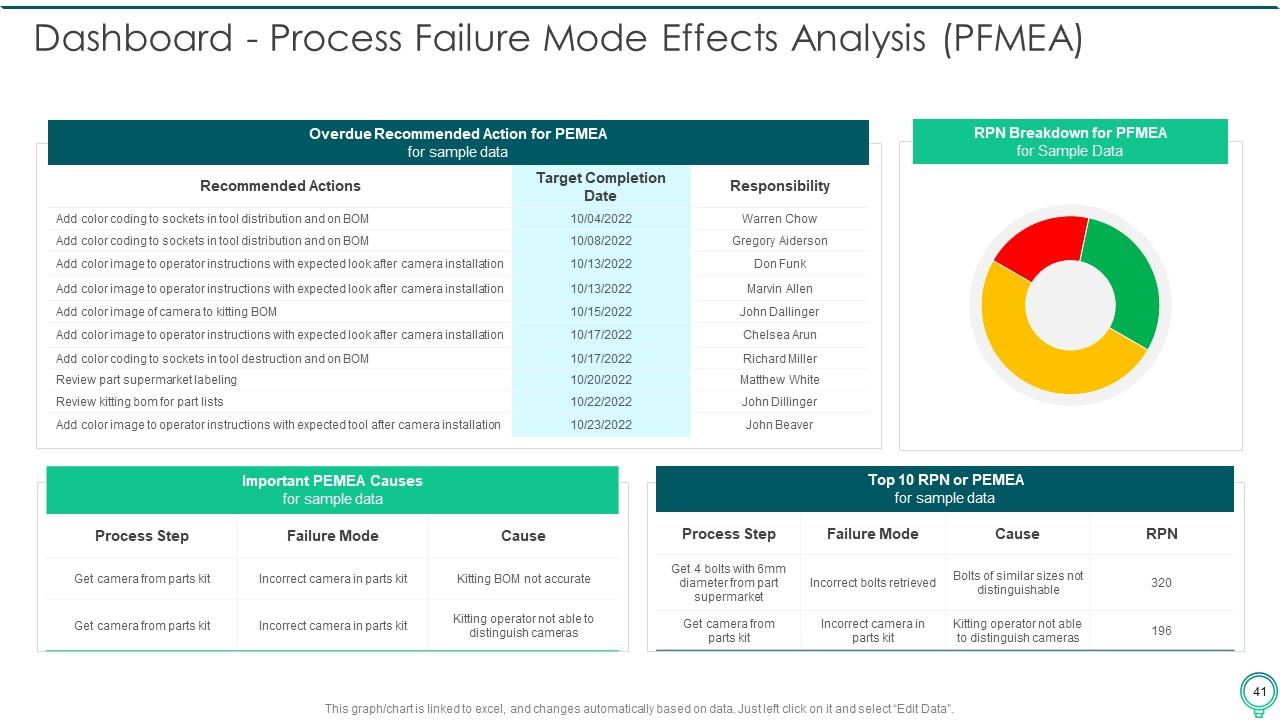
Slide 41: This slide illustrates Dashboard - Process Failure Mode Effects Analysis (PFMEA).
Slide 42: This slide displays Icons for FMEA to Identify Potential Failure Modes.
Slide 43: This slide is titled as Additional Slides for moving forward.
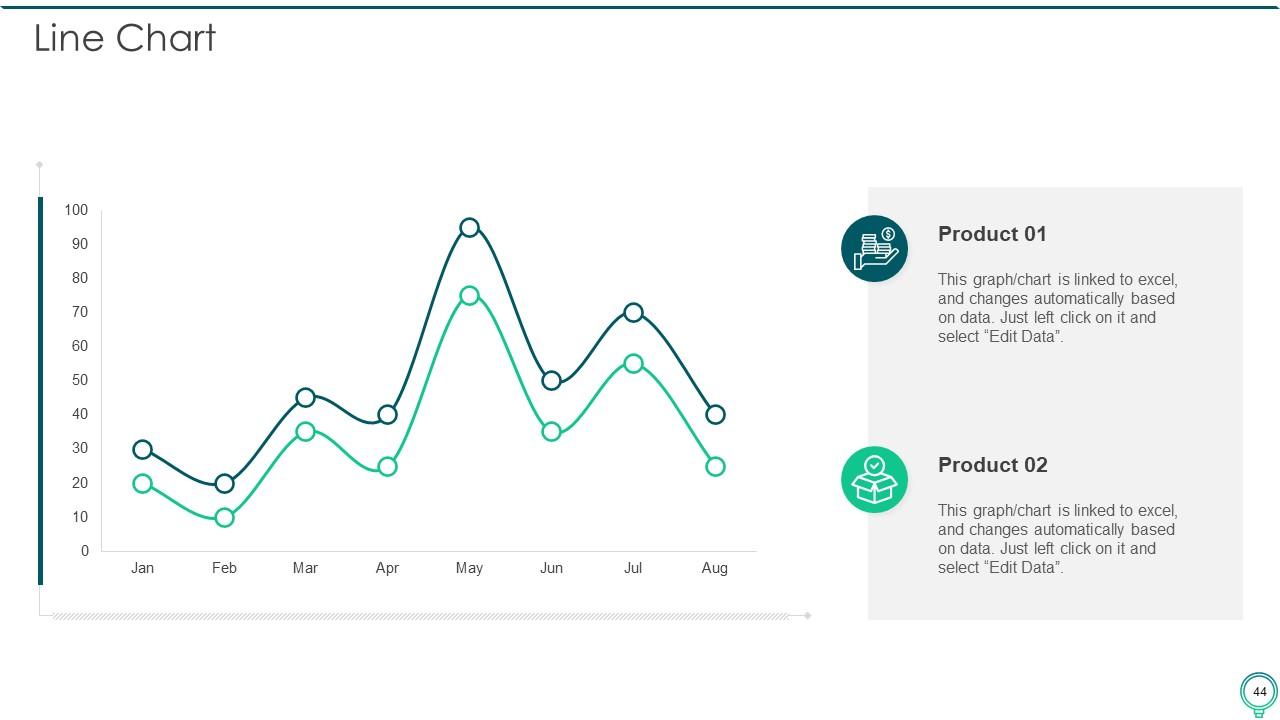
Slide 44: This slide describes Line chart with two products comparison.
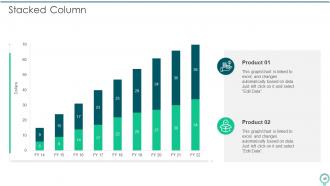
Slide 45: This slide represents Stacked Bar chart with two products comparison.
Slide 46: This is About Us slide to show company specifications etc.
Slide 47: This is Our Mission slide with related imagery and text.
Slide 48: This slide shows Post It Notes. Post your important notes here.
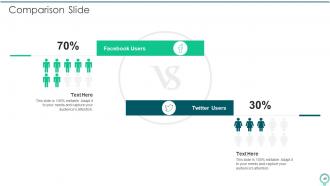
Slide 49: This is a Comparison slide to state comparison between commodities, entities etc.
Slide 50: This slide contains Puzzle with related icons and text.
Slide 51: This slide depicts Venn diagram with text boxes.
Slide 52: This is Our Team slide with names and designation.
Slide 53: This slide provides 30 60 90 Days Plan with text boxes.
Slide 54: This is a Thank You slide with address, contact numbers and email address.
FMEA To Identify Potential Failure Modes Powerpoint Presentation Slides with all 59 slides:
Use our FMEA To Identify Potential Failure Modes Powerpoint Presentation Slides to effectively help you save your valuable time. They are readymade to fit into any presentation structure.
-
The design is clean-cut, modern, and sleek, keeping the users' needs in mind. The multiple uses make this product worth every penny!
-
My team has been relying on SlideTeam’s professional PPT designs for a while now. It has greatly sped up quality work at my organization. So thanks!


