


Growing Attrition Rate In An IT Company Powerpoint Presentation Slides




Try Before you Buy Download Free Sample Product
 Impress Your
 Audience
 100%
100% Editable
 Save Hours
 of Time


Introducing our growing attrition rate in an IT company PowerPoint presentation slides. Discuss the reasons behind the growing attrition rate of the company with the help of our attrition frequency PowerPoint deck. This resignation rate PPT theme helps addresses the factors responsible for the growing attrition rate. This ready-to-use corporate employee PowerPoint design contains a slide that gives out the business and operations overview of the company. Utilizing this attrition system PPT layout will help you showcase the annual pay scale comparison between your company and your competitors. Incorporating this organization's growing attrition PPT theme helps you identify the key reasons behind the growing attrition of the company. This attrition frequency PowerPoint creative set contains a slide that discusses the wage structure of the employees of your company. Selection of this staff optimization PowerPoint template provides you with a slide that discusses the role of reward and recognition for retaining employees. Download this PPT slide to explore true perfection.
People who downloaded this PowerPoint presentation also viewed the following :
Content of this Powerpoint Presentation
Slide 1: This slide introduces the Growing Attrition Rate in an IT COMPANY. Add your company’s name here and begin.
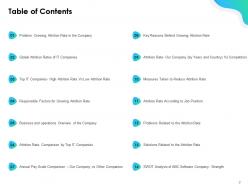
Slide 2: This slide contains the Table of Contents. The content includes- Problem: Growing Attrition Rate in the Company, Global Attrition Rates of IT Companies, Top IT Companies- High Attrition Rate Vs Low Attrition Rate, Responsible Factors for Growing Attrition Rate, Business, and operations Overview of the Company, Attrition Rate- Comparison by Top IT Companies, Annual PayScale Comparison – Our Company vs Other Companies, Key Reasons Behind Growing Attrition Rate, Attrition Rate- Our Company (by Years and Country) Vs Competitors, Measures Taken to Reduce Attrition Rate, Attrition Rate According to Job Position, Problems Related to the Attrition Rate, Solutions Related to the Attrition Rate, SWOT Analysis of ABC Software Company- Strength.
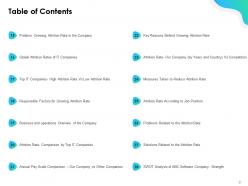
Slide 3: This slide continues the Table of Contents from the last slide. The content includes- SWOT Analysis of ABC Software Company- Weakness, SWOT Analysis of ABC Software Company- Opportunity, SWOT Analysis of ABC Software Company- Threats, Strategy 1: Offer Equitable and Modest Salaries, Strategy 2: Train Front-line Executives, Administrators and Supervisors, Strategy 3: Defining Duties and Responsibilities, Strategy 4: Rewards and Recognition, Monthly Employee Attrition Rate, Key Performance Indicators, Profitability Analysis (Market Scenario), Major Risk and Mitigation Strategies, Competitive Analysis with Various Factors, After Strategy Implementation: Attrition Rate of ABC Software Company, Dashboard- Employee Attrition Rate.
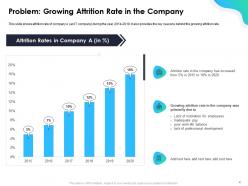
Slide 4: This slide graphically presents Problem: Growing Attrition Rate in the Company during the years 2014-2019. It also gives some reasons for it such as lack of motivation for employees, inadequate pay, poor work-life balance, lack of professional development.
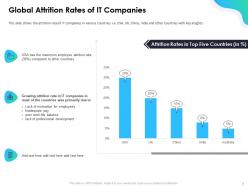
Slide 5: This slide graphically presents Global Attrition Rates of IT Companies like the USA, UK, China, and India, etc., and their reasons such as lack of motivation for employees, inadequate pay, poor work-life balance, lack of professional development.
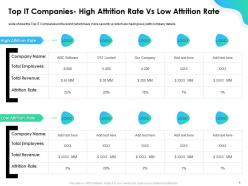
Slide 6: This slide shows Top IT Companies in the world with respect to high and low attrition rates with company details such as company name, the total number of employees, total revenue, and attrition rate.
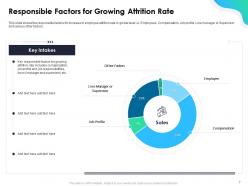
Slide 7: This slide presents the Responsible Factors for Growing Attrition Rate. These factors include the Compensation, Line Manager or Supervisor, Employee, Job Profile, and other factors.
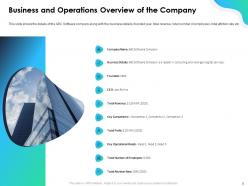
Slide 8: This slide lists the Business and Operations Overview of a Company. The list includes the Company Name, Business Details, Founded Year, CEO, Total Revenue, Key Competitors, Total Profit, Key Operational Heads, Total Number of Employees, and Total Attrition Rate.
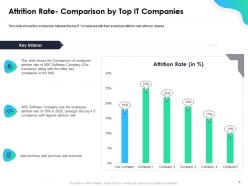
Slide 9: This slide graphical presents Key Intakes of which shows the comparison between the top IT Companies with their employee attrition rate with key intakes. This slide shows the Comparison of the employee attrition rate of ABC Software Company (Our Company) along with the other key companies in the field and ABC Software Company has an employee attrition rate of 18% in 2020, amongst the top 4 IT companies with the highest attrition rate.
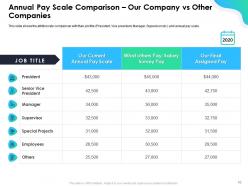
Slide 10: This slide tabulates Annual PayScale Comparison – Our Company vs Other Companies. It shows the attrition rate comparison with their job title (President, Vice president, Manager, Supervisor, and other employees) and annual pay scale.
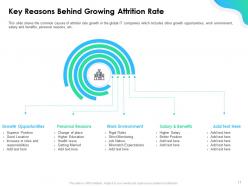
Slide 11: The slide represents Key Reasons Behind the Growing Attrition Rate including growth opportunities, work environment, salary and benefits, and personal reasons, etc.
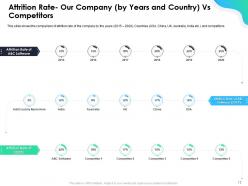
Slide 12: This slide shows Attrition Rate- Our Company (by Years and Country) Vs Competitors and shows the comparison of attrition rate of the company by the years (2015 – 2020), Countries (USA, China, UK, Australia, India, etc.), and competitors.
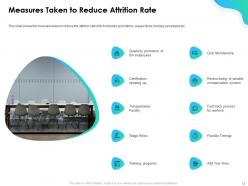
Slide 13: This slide lists the Measures Taken to Reduce Attrition Rates like: Quarterly promotion of the employees, Certification ramping up, Transportation Facility, Wage Hikes, Training programs, Club Membership, Restructuring of the variable compensation system, Fast track process for workers, Flexible Timings, and others.
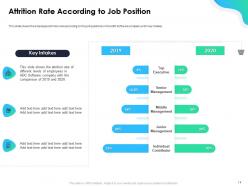
Slide 14: This slide contains the Attrition Rate According to Job Position which shows the employee attrition rate according to the job positions in a Software company with key intakes. The job positions are Top Executive, Senior Management, Middle Management, Junior Management, and Individual Contributor.
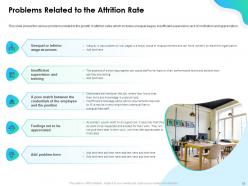
Slide 15: This slide presents the Problems Related to the Attrition Rate which includes Unequal or inferior wage structures, Insufficient supervision and training, A poor match between the credentials of the employee and the position, and Feelings of not being appreciated. This can force workers to leave the organization.
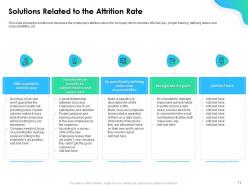
Slide 16: This slide presents Solutions Related to the Attrition Rate in the company. This includes - Offer equitable and fair pay, Train front-line executives, administrators and supervisors, by specifically defining duties and responsibilities, and Recognized programs, and many more.
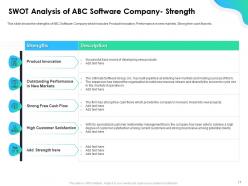
Slide 17: This slide lists the SWOT Analysis of a Software Company- Strength. The strengths include - Product Innovation, Performance in new markets, Strong free cash flow, and High Customer Satisfaction among others. etc.
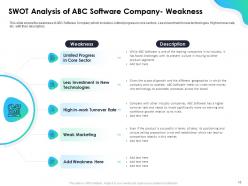
Slide 18: This slide lists the SWOT Analysis of ABC Software Company- Weakness. The weaknesses include - Limited progress in core sectors, Less investment in new technologies, High in-work turnover rate, and Weak Marketing, and more.
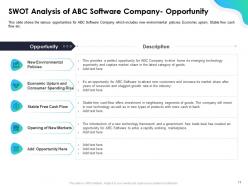
Slide 19: This slide lists the SWOT Analysis of ABC Software Company- Opportunity. The opportunities include - new environmental policies, Economic upturn, Stable free cash flow, and Opening of New Markets, etc.
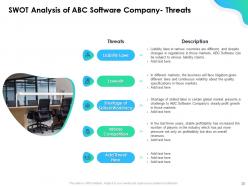
Slide 20: This slide lists the SWOT Analysis of ABC Software Company- Threats. The threats include - Liability Laws, Lawsuits, Shortage of skilled workforce, and Intense Competition, etc.
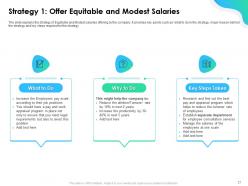
Slide 21: This slide presents Strategy 1: Offer Equitable and Modest Salaries. It shows the strategy of Equitable and Modest salaries offering by the company. It provides key points such as what to do in the strategy, why to do it, and key steps required for the strategy.
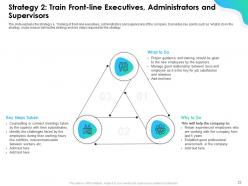
Slide 22: This slide presents Strategy 2: Train Front-line Executives, Administrators, and Supervisors. It explains the strategy i.e., Training of front-line executives, administrators, and supervisors of the company. It provides key points such as what to do in the strategy, why to do it, and key steps required for the strategy.
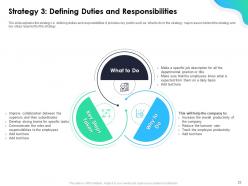
Slide 23: This slide presents Strategy 3: Defining Duties and Responsibilities. It explains the strategy i.e., defining duties and responsibilities. It provides key points such as what to do in the strategy, why to do it, and key steps required for the strategy.
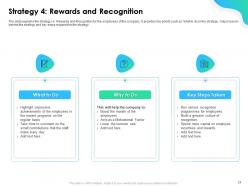
Slide 24: This slide presents Strategy 4: Rewards and Recognition. It explains the strategy i.e., Rewards and Recognition for the employees of the company. It provides key points such as what to do in the strategy, why to do it, and key steps required for the strategy.
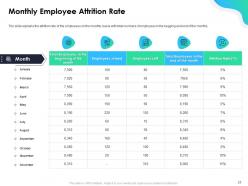
Slide 25: This slide tabulates the Monthly Employee Attrition Rate. It explains the attrition rate of the employees on the monthly basis with the total numbers of employees at the beginning and end of the months.
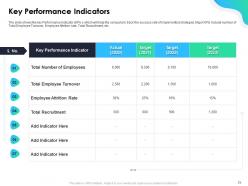
Slide 26: This slide tabulates the Key Performance Indicators, (KPI)s, which will help the company to track the success rate of implemented strategies. Major KPIs include Total number of Employees, Total Employee Turnover, Employee Attrition rate, and Total Recruitment, etc.
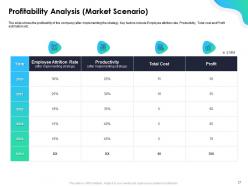
Slide 27: This slide tabulates the Profitability Analysis (Market Scenario). It shows the profitability of the company (after implementing the strategy). Key factors include Employee attrition rate, Productivity, Total Cost, and Profit estimation.
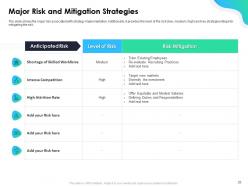
Slide 28: This slide tabulates the Major Risk and Mitigation Strategies which shows the major risk associated with strategy implementation. Additionally, it provides the level of the risk (low, medium, high) and key strategies/steps for mitigating the risk.
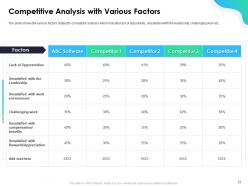
Slide 29: This slide tabulates the Competitive Analysis with Various Factors. It shows the various factors related to competitor analysis which include lack of opportunity, being unsatisfied with the leadership, challenging work, unsatisfied with the work environment, unsatisfied with the compensation/benefits, and unsatisfied with the rewards/appreciation among others.
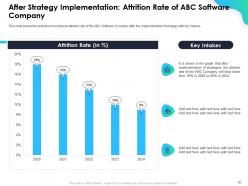
Slide 30: This slide presents the After Strategy Implementation: Attrition Rate of a Software Company graphically. It shows the reduction in the employee attrition rate of the Software Company after the implementation of the strategy.
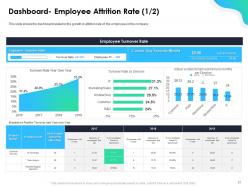
Slide 31: This slide visually presents part 1 of 2 of the Dashboard- Employee Attrition Rate. It shows the dashboard related to the growth in the attrition rate of the employees in the company.
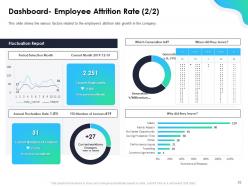
Slide 32: This slide visually presents part 2 of 2 of the Dashboard- Employee Attrition Rate. It shows the various factors related to the employee's attrition rate growth in the company.
Slide 33: This slide presents a number of Growing Attrition Rate in an IT Company Icons Slide for you to choose from.
Slide 34: This slide introduces the Additional Slides.
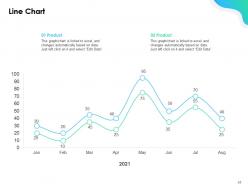
Slide 35: This slide shows an editable Line Chart comparing a change in two products over a period of several months.
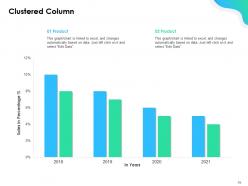
Slide 36: This slide shows editable Clustered Column Charts for tracking 2 products and comparing their sales over the years.
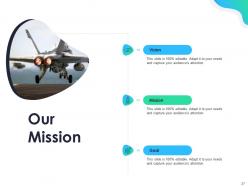
Slide 37: This slide provides the Mission for the entire company. This includes the vision, the mission, and the goal.
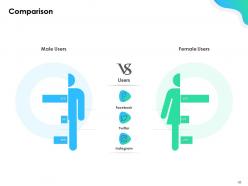
Slide 38: This slide presents the comparison between social media usage between male and female users. The social media platforms are Facebook, Twitter, and Instagram.
Slide 39: This slide contains Post It Notes that can be used to express any brief thoughts or ideas.
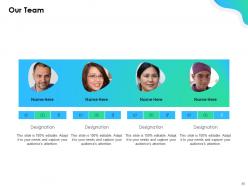
Slide 40: This slide shows the members of the company team with their name, designation, and photo.
Slide 41: This is a slide with a 30 60 90 Days Plan to set goals for these important intervals.
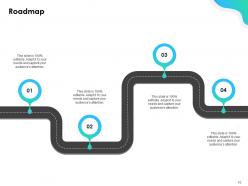
Slide 42: This slide is a Roadmap template to showcase the stages of a project, for example.
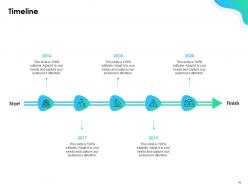
Slide 43: This slide is a Timeline template to showcase the progress of the steps of a project with time.
Slide 44: This slide contains the information about the company aka the ‘About Us’ section. This includes the Value Clients, the Target Audiences, and Preferred by Many.
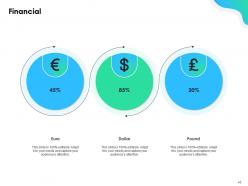
Slide 45: This is a financial presentation template. It can be used to represent market value in different markets with different currencies like the Dollar, the Pound, and the Euro.
Slide 46: This is a Thank You slide where details such as the address, contact number, email address are added.
Growing Attrition Rate In An IT Company Powerpoint Presentation Slides with all 46 slides:
Use our Growing Attrition Rate In An IT Company Powerpoint Presentation Slides to effectively help you save your valuable time. They are readymade to fit into any presentation structure.



FAQs for Growing Attrition Rate In An IT Company
Honestly, most people quit because of crappy managers - that's like 80% of it right there. Money's obviously huge too, especially if you're underpaying compared to market rates. Work-life balance kills retention fast, and so does having zero growth opportunities. Poor onboarding is brutal - people bounce within months if they feel thrown to the wolves. Culture problems are another big one. Oh, and recognition matters more than people think. When someone's busting their ass with no acknowledgment, they're already mentally checked out. I'd start by auditing your managers first since that tends to be the root of most issues, then look at comp.
So basically use this formula monthly: (departures ÷ average headcount) × 100. Break it down by department and role level in a spreadsheet - trust me, patterns become super obvious that way. Voluntary vs involuntary exits are totally different beasts, so track them separately. Exit interview themes are gold too, along with engagement scores. Oh and stay consistent with your measurement periods or the data gets wonky. If you can automate the reporting, do it. Nothing worse than scrambling for numbers when your boss randomly asks for an update on a Tuesday.
Oh man, engaged employees are way less likely to quit - it's such a clear connection. People who actually feel valued and connected to their work? They stay put. The ones who've mentally checked out are already halfway out the door anyway. You can see attrition drop like 20-40% when engagement scores are solid vs. terrible. Honestly, most companies mess this up by doing those surveys but then never actually changing anything based on what people say. That's probably worse than not asking at all. Regular pulse checks work, but you gotta follow through.
Really depends on what industry you're in tbh. Retail and hospitality are rough - they see like 20-30% turnover annually because the hours and pay honestly suck. Tech hovers around 10-15%. Healthcare's in the middle at 15-20%. Manufacturing's actually not bad at 8-12% since those jobs usually have decent benefits and stability. Financial services are similar, maybe 10-15%. Oh and don't compare yourself to general averages - that's useless. If you're in banking, 25% turnover would be awful. Restaurant? Totally normal Tuesday. You gotta look at your specific industry to know if your numbers are actually concerning or just par for the course.
Ugh, toxic workplace culture is THE reason people quit - I swear it matters more than salary sometimes. People will literally flee even decent-paying jobs if management's micromanaging or the environment sucks. But flip that around? Create a place where your team feels valued and trusted, and they'll actually want to stay. It's wild how much culture impacts everything - stress, job satisfaction, whether someone dreads Monday mornings. Oh and actually listen to feedback instead of just asking for it. That makes a huge difference too.
Exit interviews are seriously underrated for figuring out why people bail. You'll get way more honest answers since they're already gone anyway - no sugarcoating! Ask specific stuff about their manager, growth opportunities, pay issues instead of vague "how was your experience" nonsense. Track everything in categories like career development or work-life balance so you can spot patterns. When the same complaints keep coming up across different teams, that's your red flag right there. Oh and make it standardized so you're actually comparing apples to apples, not random feedback.
Honestly, start with pay - if that's not competitive, nothing else matters. Bad managers are usually the real problem though. People can deal with a lot if their boss doesn't suck. Career paths help too, like showing people where they could be in 2-3 years. Remote work and flexible hours are basically non-negotiable now, at least in my experience. Oh, and don't underestimate simple recognition - a shoutout in a meeting goes further than you'd think. Survey your team first to see what's actually bugging them instead of guessing.
Oh absolutely, there's a huge connection there. Companies that actually invest in training see their turnover drop by like 30-50% - which honestly makes total sense when you think about it. People want to feel like they're going somewhere, you know? If someone's learning new skills and growing, why would they leave? Nobody wants to be stuck doing the same thing forever. I'd say if you're bleeding talent, take a hard look at what development stuff you're offering. Also make sure people actually know about it - sometimes companies have programs but suck at communicating them.
Dude, high turnover will absolutely wreck your business. Productivity tanks when you're constantly training newbies, and recruitment costs go through the roof. Your best people leave with all their knowledge - honestly, it's maddening to watch. The employees who stay? They're drowning trying to cover extra work, which makes them want to quit too. Customers hate dealing with someone new every time who doesn't know their story. You can't build any real culture when half your team's been there like three months. Watch those numbers closely and figure out why people are bailing before it gets worse.
Oh that's actually pretty smart - you basically feed employee data into models that learn from people who already quit. Things like engagement scores, performance reviews, how long they've been there, salary bumps (or lack of), even sick days. Run it monthly and it'll flag who's probably eyeing the exit. Honestly some of these get scary accurate! But here's the thing - spotting flight risks is only half the battle. You've gotta actually do something about it, like having real conversations with those employees or fixing whatever's bugging them before they bounce.
Oof, high turnover is such a budget killer. Replacing someone costs like 50-200% of their salary - recruitment, training, the whole mess. The sneaky costs are worse though: paying overtime to cover gaps, team morale tanking, all that company knowledge just walking away. I swear, losing experienced people hurts more than most companies realize. Track what each departure actually costs you so you can make a real case for keeping people around instead of constantly hiring.
Dude, your leadership style makes or breaks retention - I've literally seen whole teams quit because of one terrible manager. People don't leave jobs, they leave bosses. Be supportive and give clear direction, and your team will stick around. Micromanage or play favorites though? Good luck keeping anyone decent. Oh, and actually listen when they talk to you - sounds basic but you'd be shocked how many managers just... don't. The research proves it too. Bottom line: be the type of leader you'd actually want to work for yourself.
Honestly, you need a solid plan that's way more than just filling out forms. Give them quick wins early on and check in regularly - like actually talk to them at 30, 60, 90 days before they start job hunting again. Pair them with someone who isn't their boss, maybe someone who's been there a year or two? I've watched so many companies just dump new people into chaos and act shocked when they quit. Short conversations work better than formal meetings tbh. Connection to the team matters more than you'd think. Map out those first 90 days now while you're thinking about it.
Honestly, job satisfaction pretty much determines if people stay or bounce. Happy employees stick around - it's that straightforward. But here's the thing: satisfaction isn't just about money. People want to feel heard, see growth opportunities, not hate their boss, you know? They also need to find some actual meaning in what they do daily. When someone's miserable, they mentally quit way before they physically leave. If your turnover sucks right now, I'd start with anonymous surveys to figure out what's actually bugging your team specifically.
Pull your numbers from the past year first - break them down by department and how long people stayed (like 0-1 years vs 1-3 years). Executive turnover at 15% is way worse than losing 15% of your entry-level folks, obviously. Check BLS and SHRM for industry benchmarks, but honestly the salary survey data sometimes has better turnover info. Don't just look at the percentages though. Track how long it takes to fill roles and what people actually say in exit interviews - your competitors might have lower numbers but everyone could still hate working there. Compare against 2-3 similar companies in your space.
-
Great designs, Easily Editable.
-
Perfect template with attractive color combination.
-
Awesome use of colors and designs in product templates.
-
Graphics are very appealing to eyes.
-
Wonderful templates design to use in business meetings.
-
Much better than the original! Thanks for the quick turnaround.
-
Informative design.
-
Great designs, really helpful.
-
Amazing product with appealing content and design.
-
Content of slide is easy to understand and edit.
-
Page:
- You're currently reading page 1
- Page 2
-
