Industrial shift to renewable energy powerpoint presentation slides
Introducing our all-inclusive Industrial Shift To Renewable Energy PowerPoint Presentation Slides. Present an engaging company overview regarding issues you face, employees, business units, headquarters, key competitors, risk mitigation strategy, profitability, solar system, etc by employing our renewable energy technology PPT slideshow. You can easily explain the energy utilization rate by utilizing these content-specific renewable energy projections PPT visuals. Highlight the growing demand for electricity using these renewable energy PPT designs and capture your audience’s attention almost immediately. Provide a list of renewable technologies such as thermal energy, solar energy, and biogas energy and their brief introduction with the assistance of these sustainable energy PPT graphics. Illustrate the permission and regulatory key considerations along with energy composition analysis using this renewable energy industry PPT presentation. You can even elaborate on the estimated cost of solar projects, operational, and maintenance plans by deploying these attention-grabbing power industry shift PPT themes. So without waiting any further, click the download button!
Introducing our all-inclusive Industrial Shift To Renewable Energy PowerPoint Presentation Slides. Present an engaging comp..
- Google Slides is a new FREE Presentation software from Google.
- All our content is 100% compatible with Google Slides.
- Just download our designs, and upload them to Google Slides and they will work automatically.
- Amaze your audience with SlideTeam and Google Slides.
-
Want Changes to This PPT Slide? Check out our Presentation Design Services
- WideScreen Aspect ratio is becoming a very popular format. When you download this product, the downloaded ZIP will contain this product in both standard and widescreen format.
-

- Some older products that we have may only be in standard format, but they can easily be converted to widescreen.
- To do this, please open the SlideTeam product in Powerpoint, and go to
- Design ( On the top bar) -> Page Setup -> and select "On-screen Show (16:9)” in the drop down for "Slides Sized for".
- The slide or theme will change to widescreen, and all graphics will adjust automatically. You can similarly convert our content to any other desired screen aspect ratio.
Compatible With Google Slides

Get This In WideScreen
You must be logged in to download this presentation.
PowerPoint presentation slides
Presenting our Industrial Shift To Renewable Energy Powerpoint Presentation Slides. This PPT template is your go-to option for presenting your business needs and requirements. You can customize this PPT layout to suit your content. This PPT theme is compatible with Google Slides making it highly accessible. Also, download and save this PPT template under different file extensions such as PNG, JPEG, etc. This PPT template is available in both standard and widescreen ratios.
People who downloaded this PowerPoint presentation also viewed the following :
Content of this Powerpoint Presentation
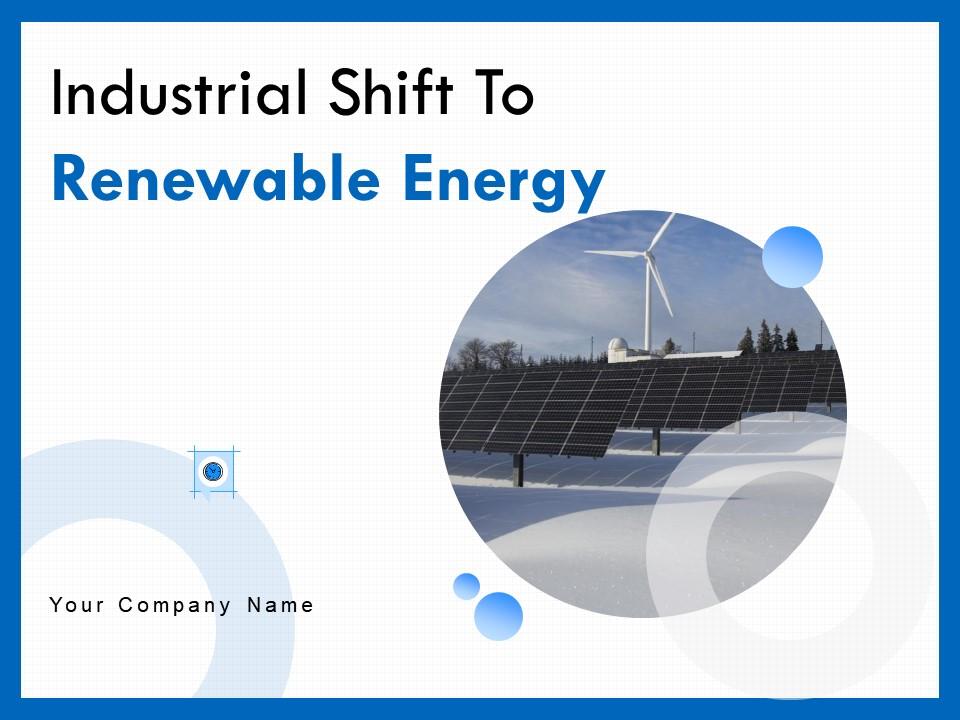
Slide 1: This slide introduces Industrial Shift To Renewable Energy. State your Company name and begin.
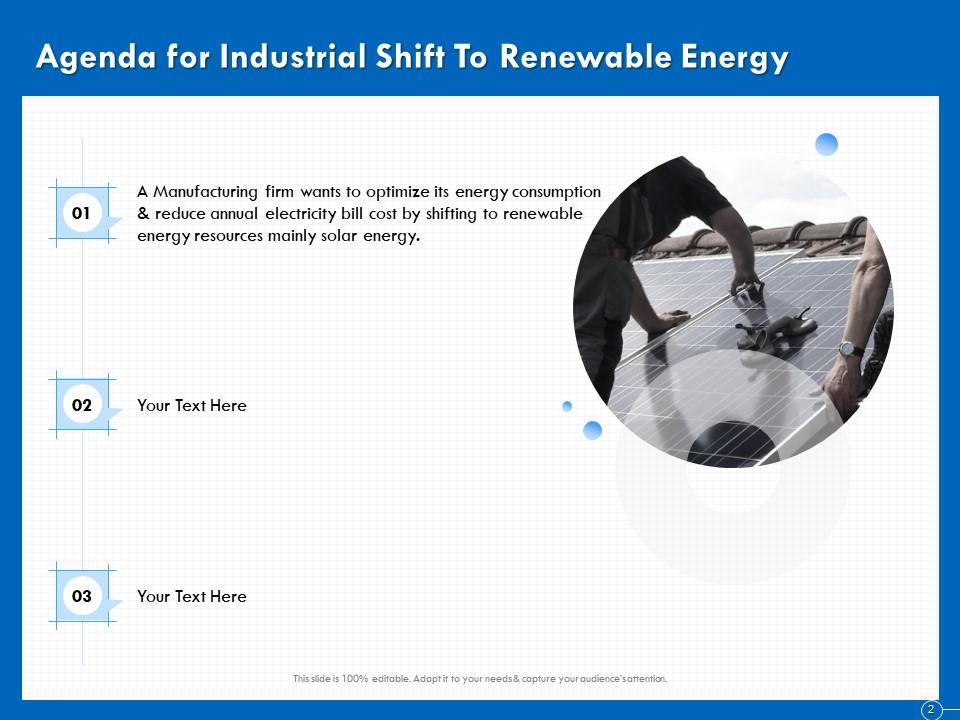
Slide 2: This slide shows Agenda for Industrial Shift To Renewable Energy
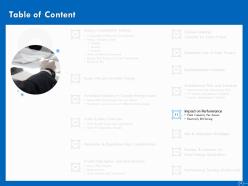
Slide 3: This slide displays Table of Contents.
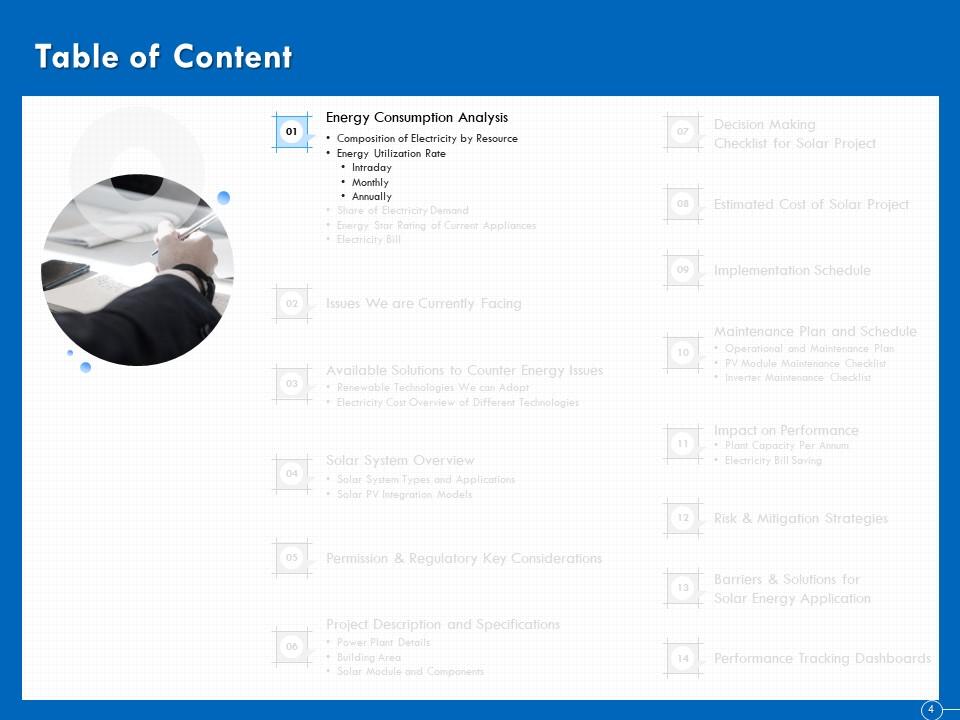
Slide 4: This slide displays Table of Content of the presentation.
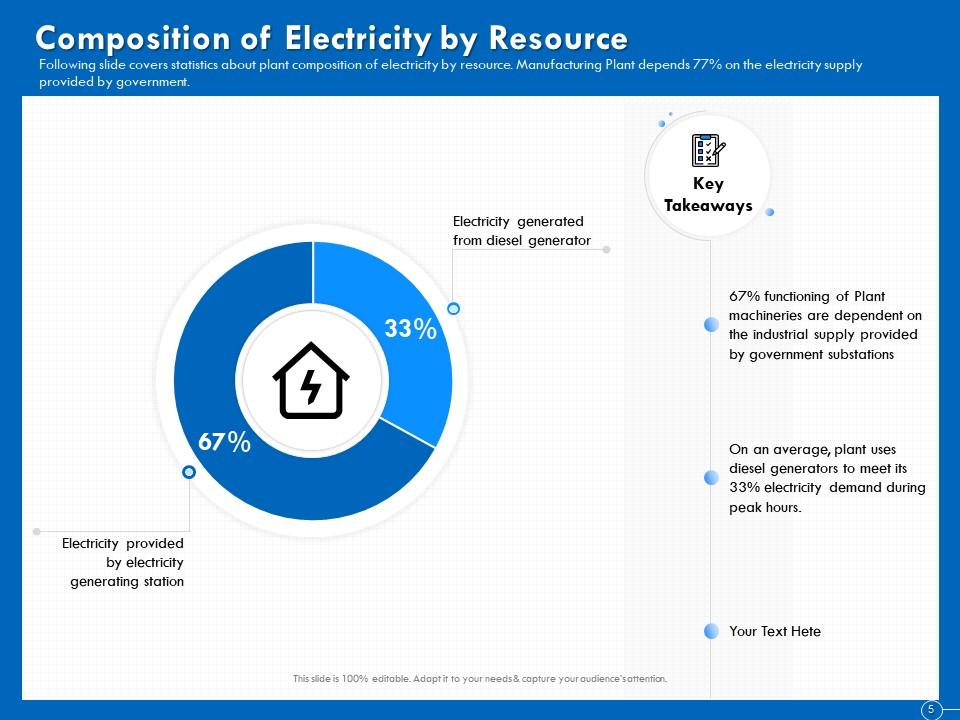
Slide 5: This slide covers statistics about plant composition of electricity by resource. Manufacturing Plant depends 77% on the electricity supply provided by government.
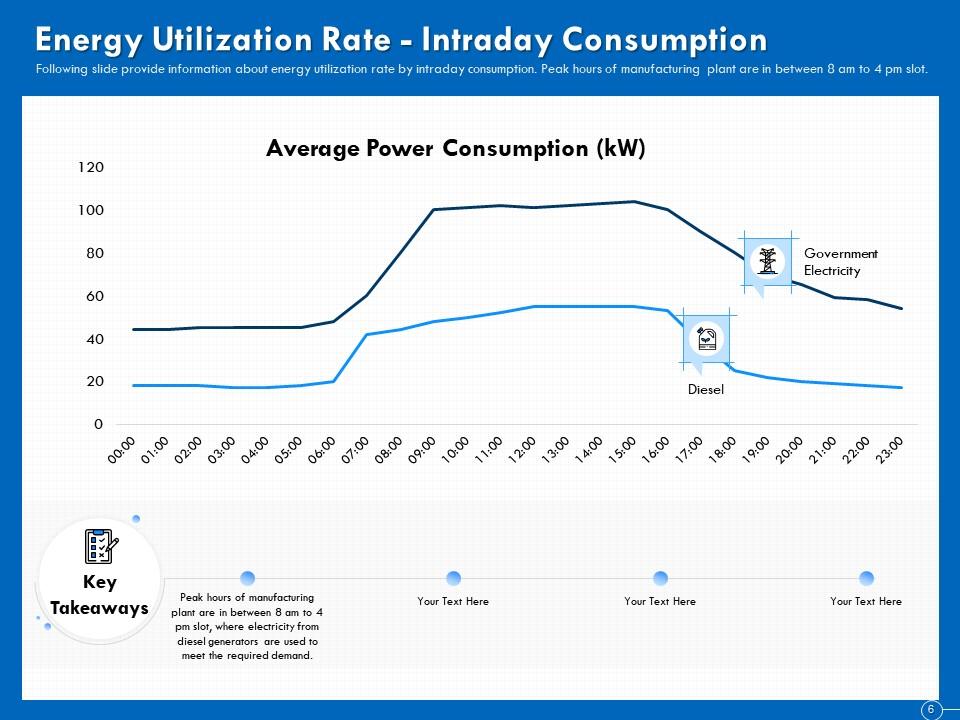
Slide 6: This slide provide information about energy utilization rate by intraday consumption. Peak hours of manufacturing plant are in between 8 am to 4 pm slot.
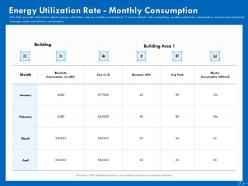
Slide 7: This slide provide information about energy utilization rate by monthly consumption. It covers details such as building, monthly electricity consumption, annual cost, baseload, average peak and electric consumption.
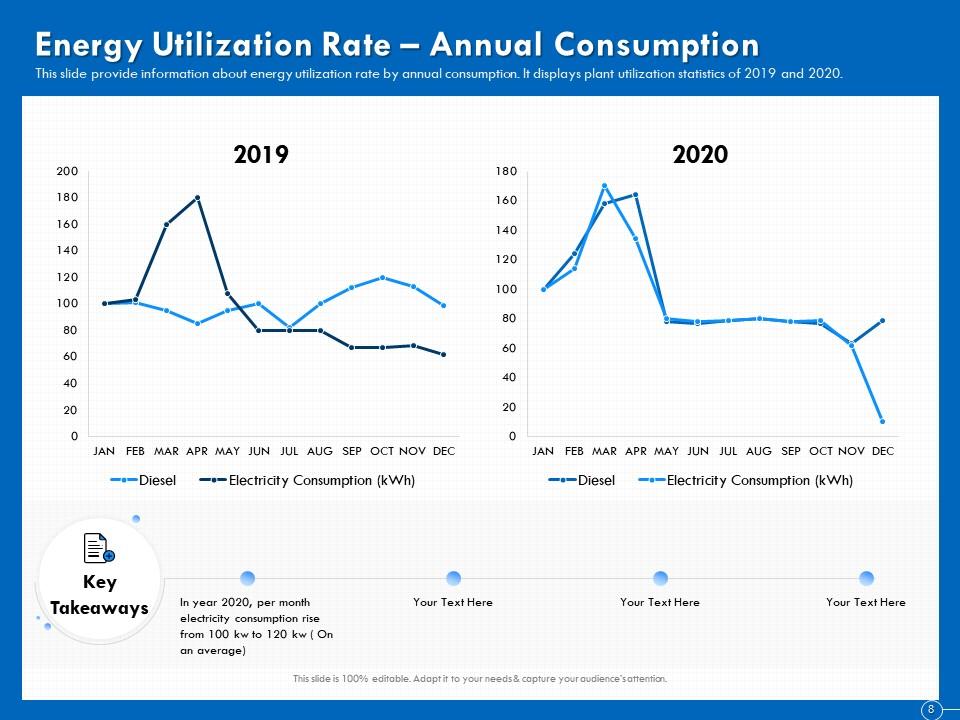
Slide 8: This slide provide information about energy utilization rate by annual consumption. It displays plant utilization statistics of 2019 and 2020.
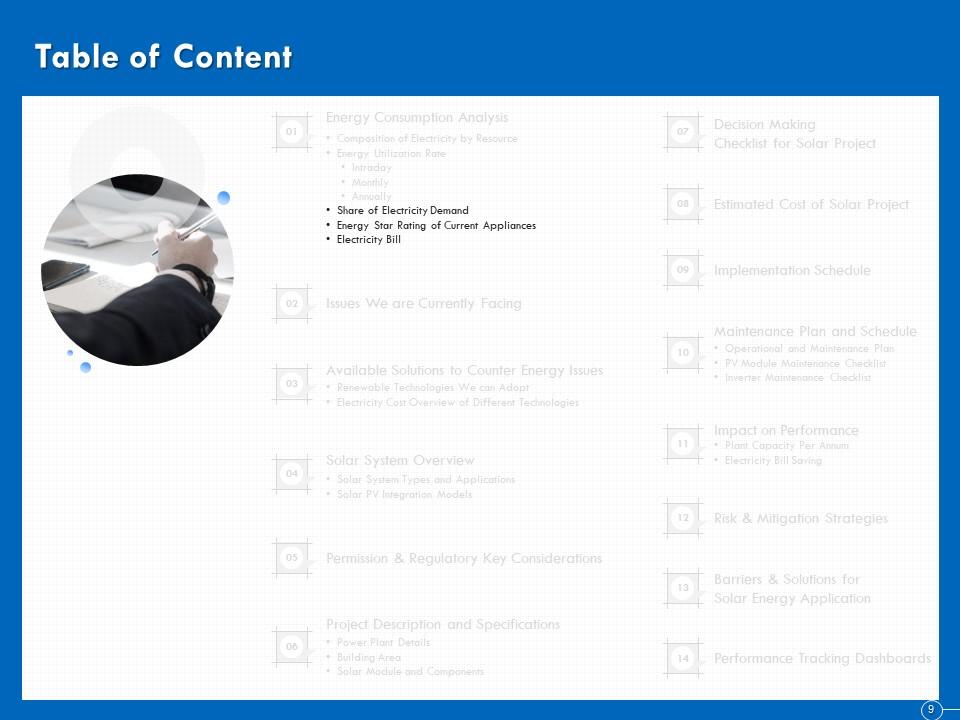
Slide 9: This slide displays Table of Content
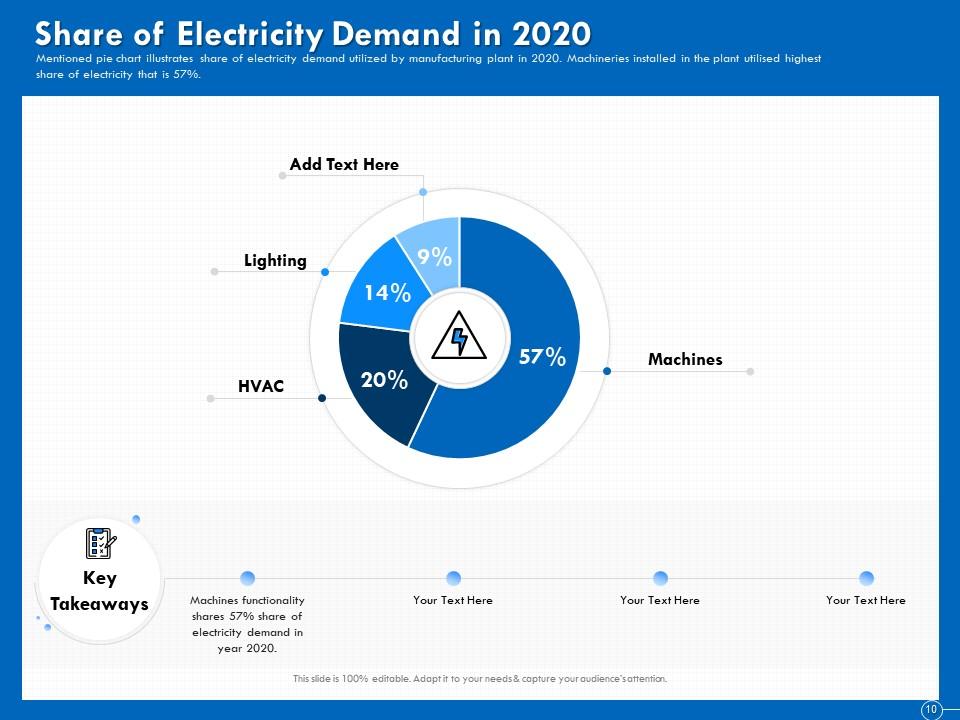
Slide 10: The pie chart in the slide illustrates share of electricity demand utilized by manufacturing plant in 2020. Machineries installed in the plant utilised highest share of electricity that is 57%.
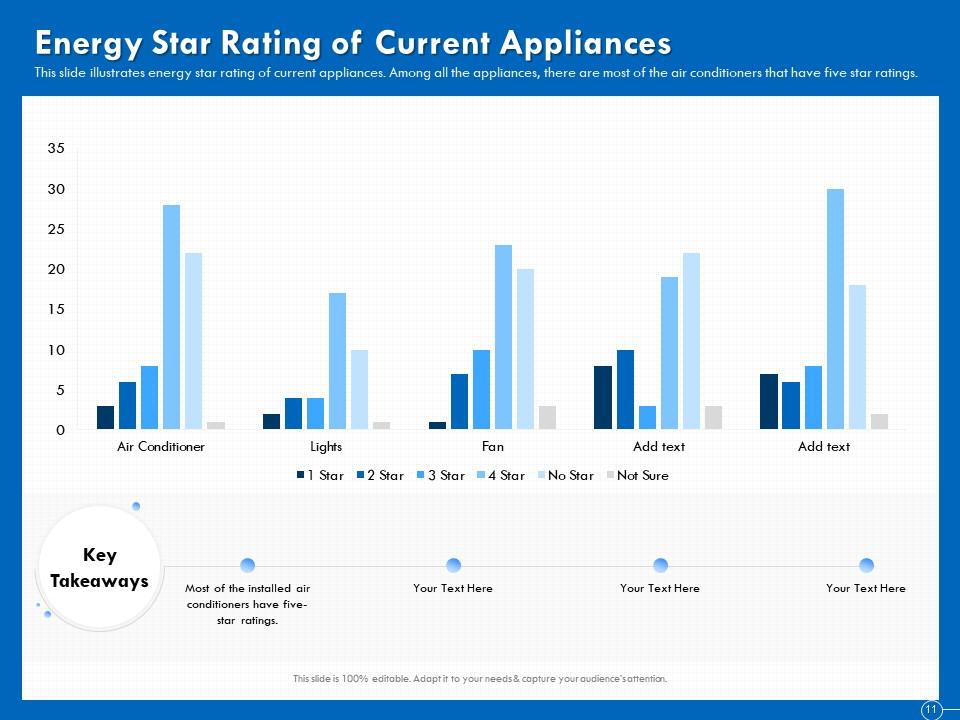
Slide 11: This slide shows Energy Star Rating of Current Appliances
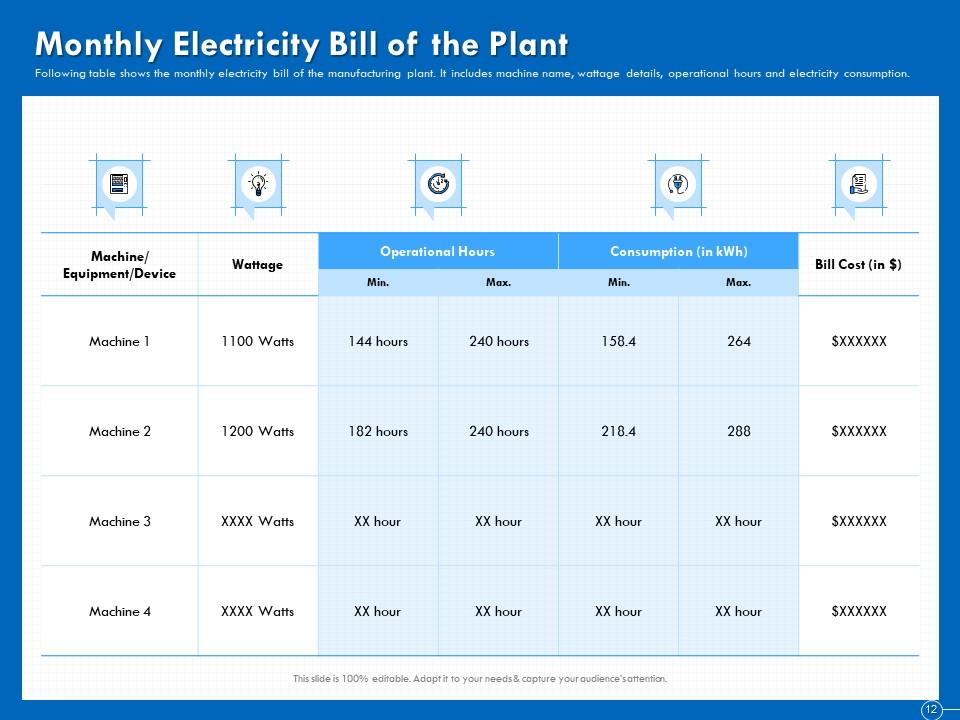
Slide 12: The table shows the monthly electricity bill of the manufacturing plant. It includes machine name, wattage details, operational hours and electricity consumption.
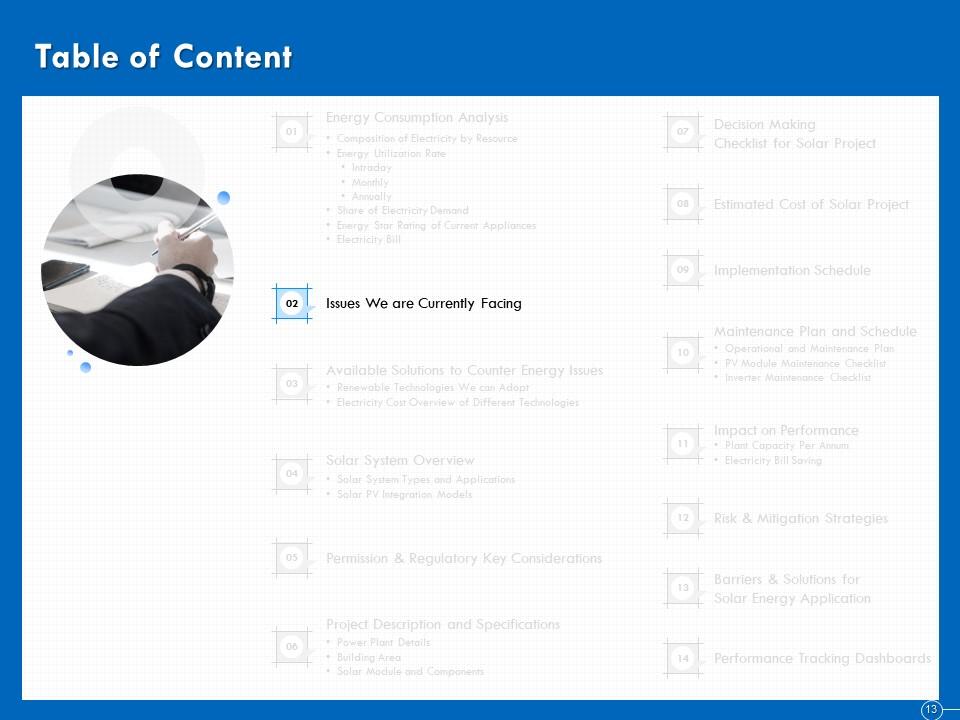
Slide 13: This slide shows Table of Content
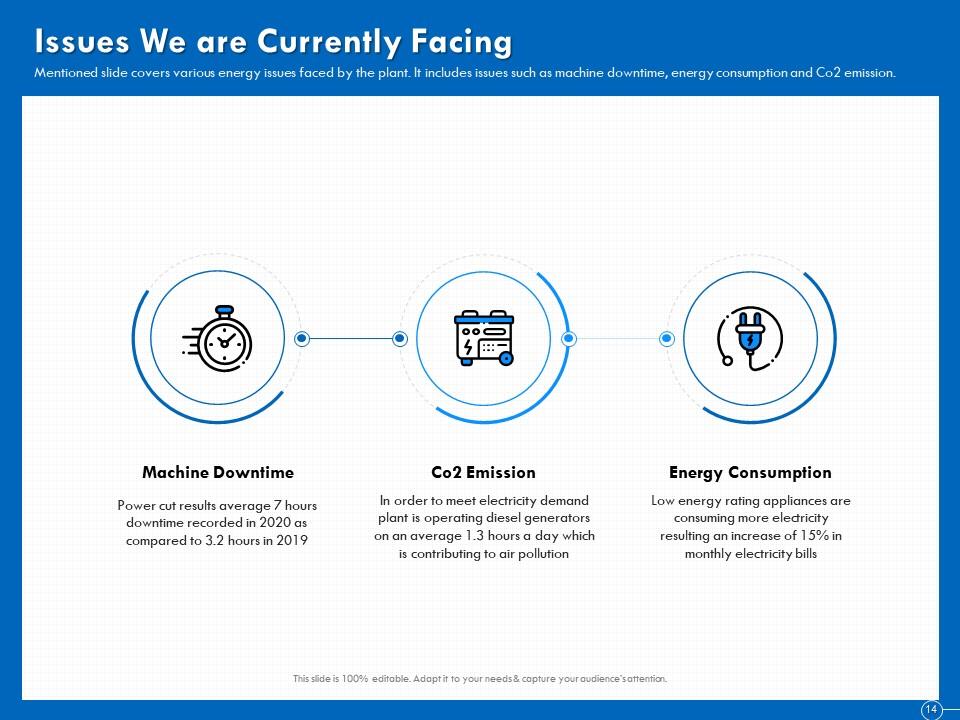
Slide 14: This slide covers various energy issues faced by the plant. It includes issues such as machine downtime, energy consumption and Co2 emission.
Slide 15: This slide shows Table of Content.
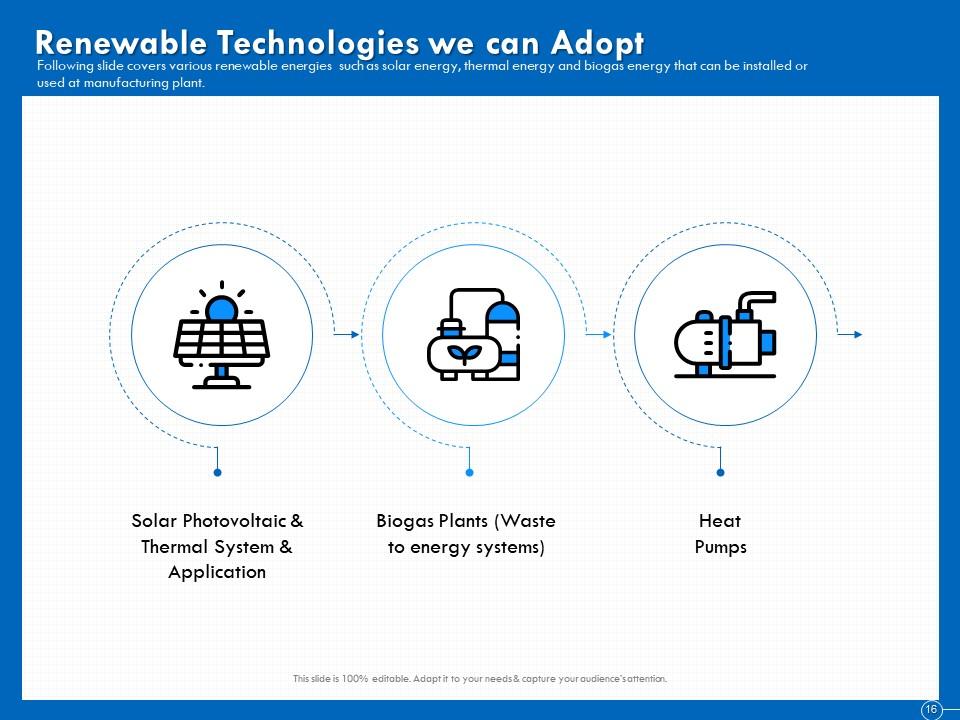
Slide 16: This slide covers various renewable energies such as solar energy, thermal energy and biogas energy that can be installed or used at manufacturing plant.
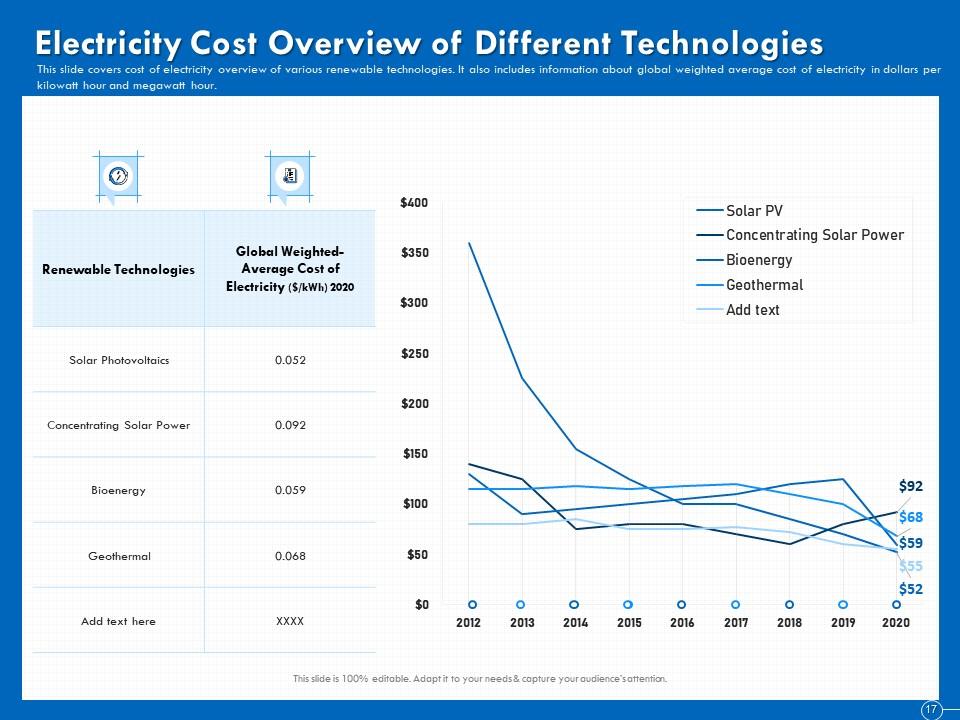
Slide 17: This slide covers cost of electricity overview of various renewable technologies. It also includes information about global weighted average cost of electricity in dollars per kilowatt hour and megawatt hour.
Slide 18: This slide displays Table of Content.
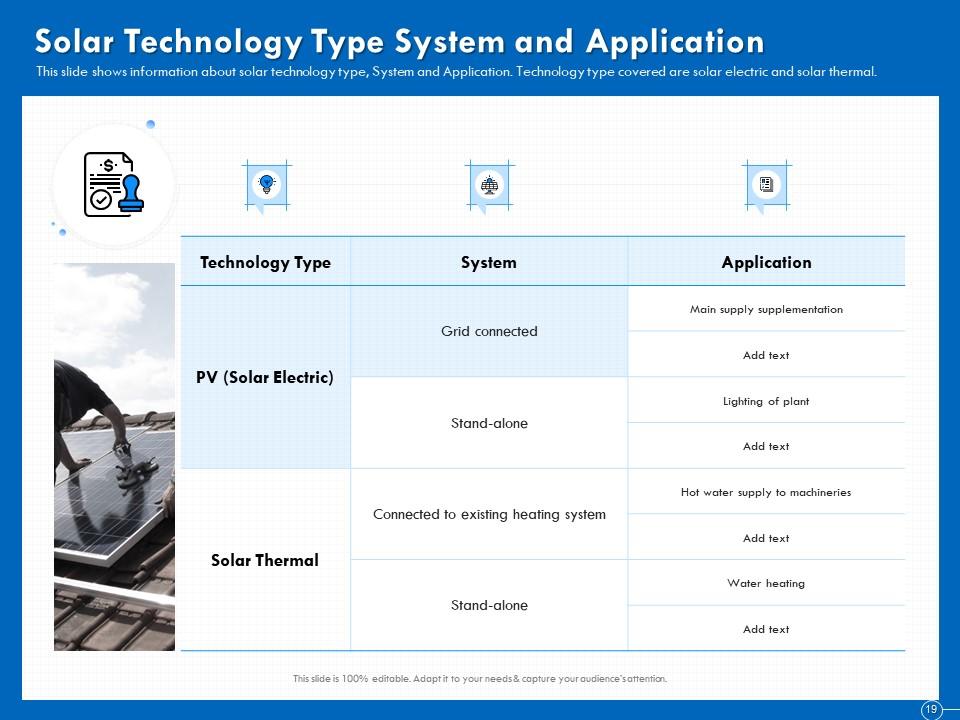
Slide 19: This slide shows information about solar technology type, System and Application. Technology type covered are solar electric and solar thermal.
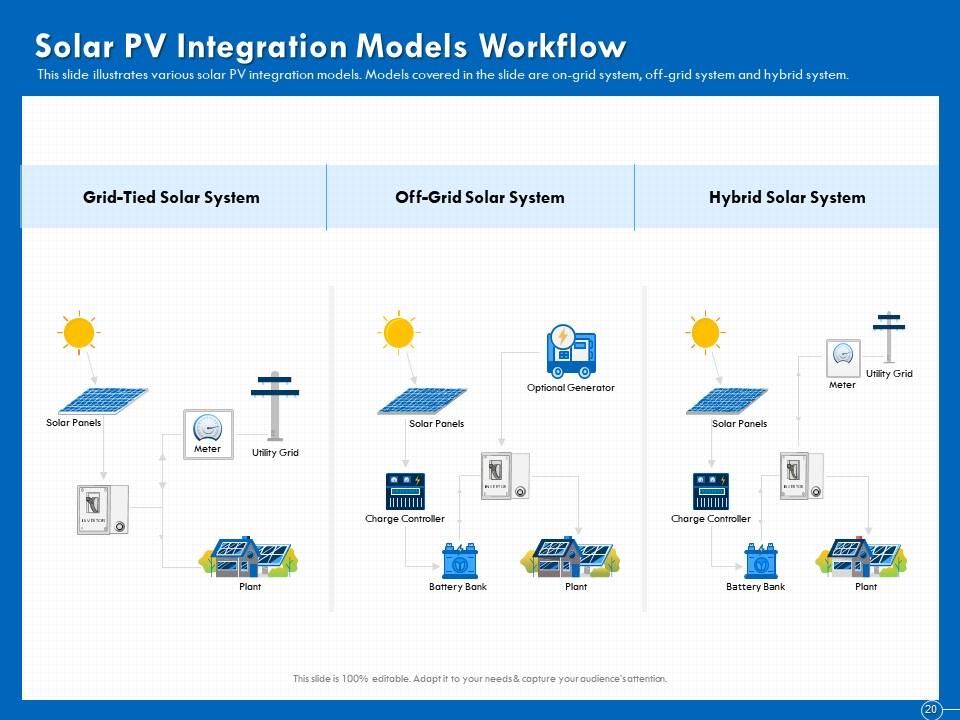
Slide 20: This slide illustrates various solar PV integration models. Models covered in the slide are on-grid system, off-grid system and hybrid system.
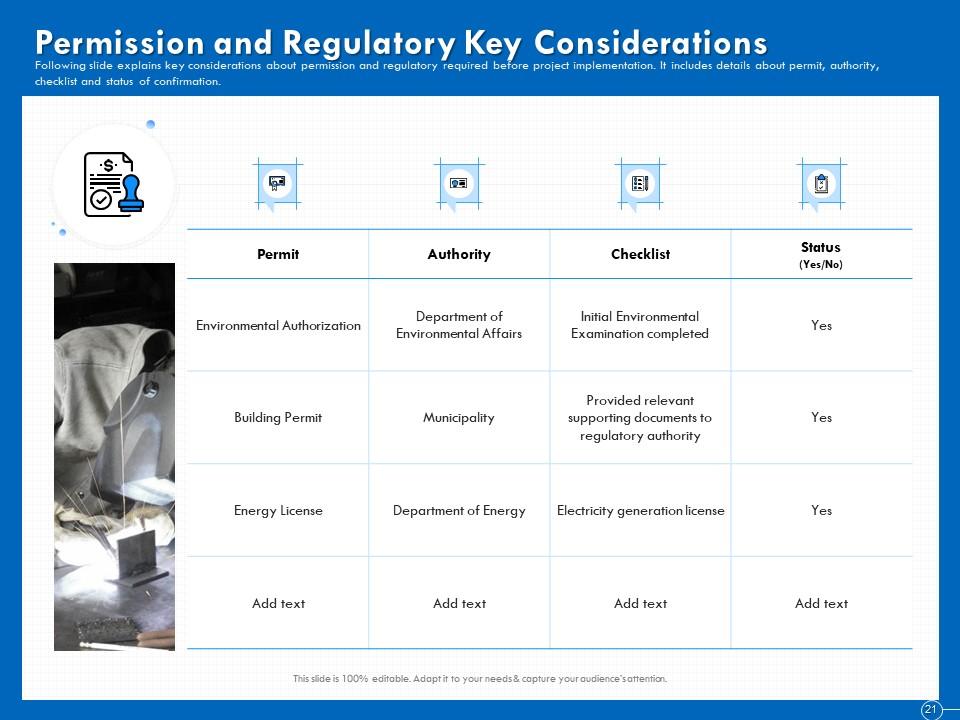
Slide 21: This slide explains key considerations about permission and regulatory required before project implementation. It includes details about permit, authority, checklist and status of confirmation.
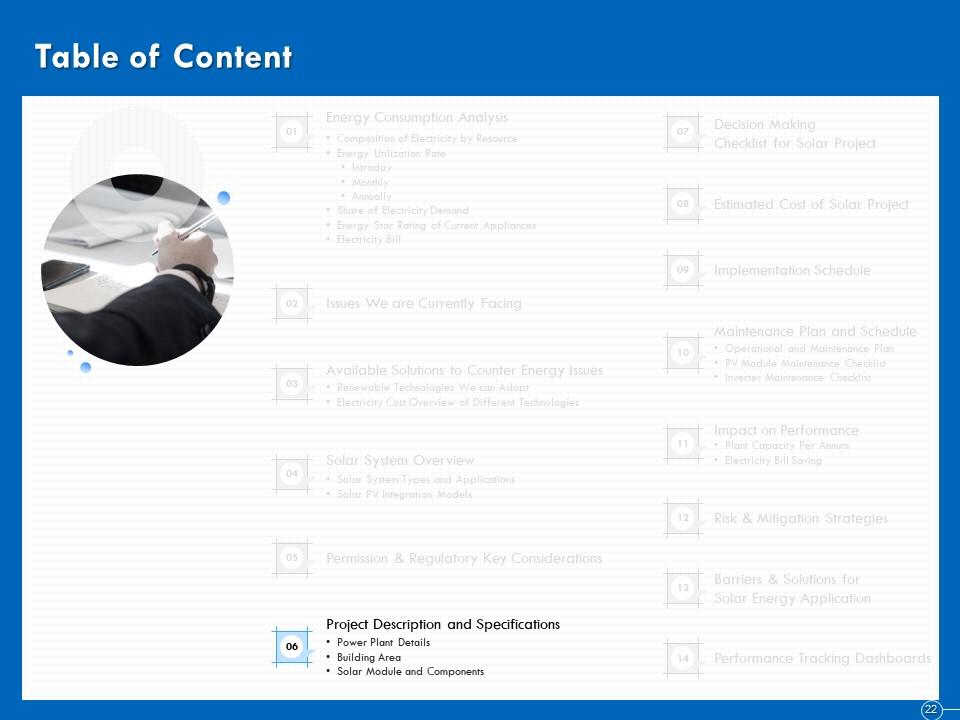
Slide 22: This slide displays Table of Content.
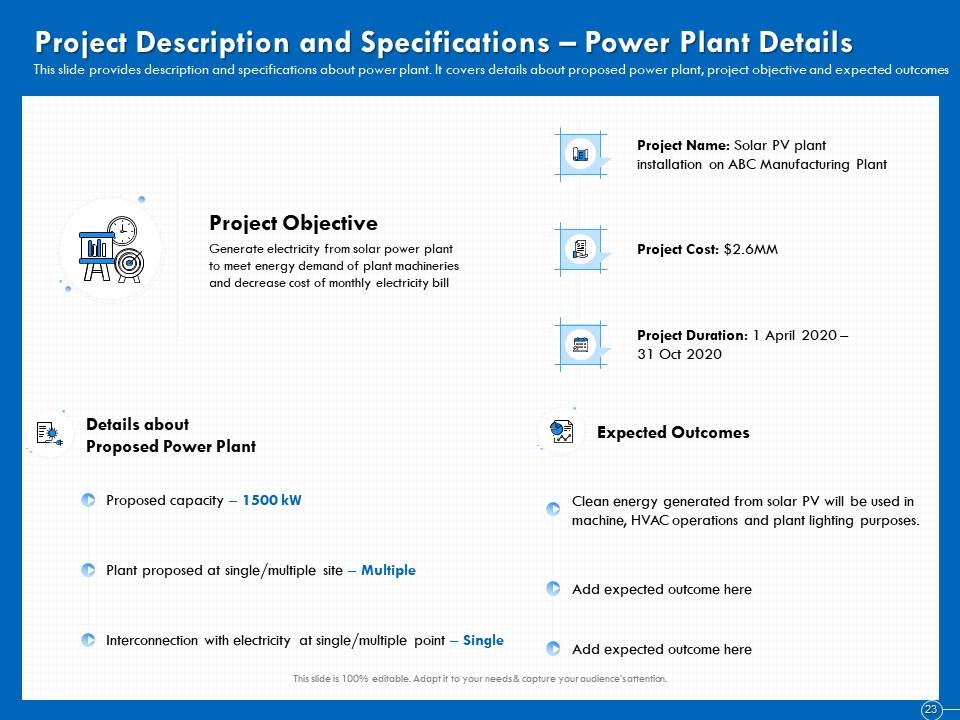
Slide 23: This slide provides description and specifications about power plant. It covers details about proposed power plant, project objective and expected outcomes
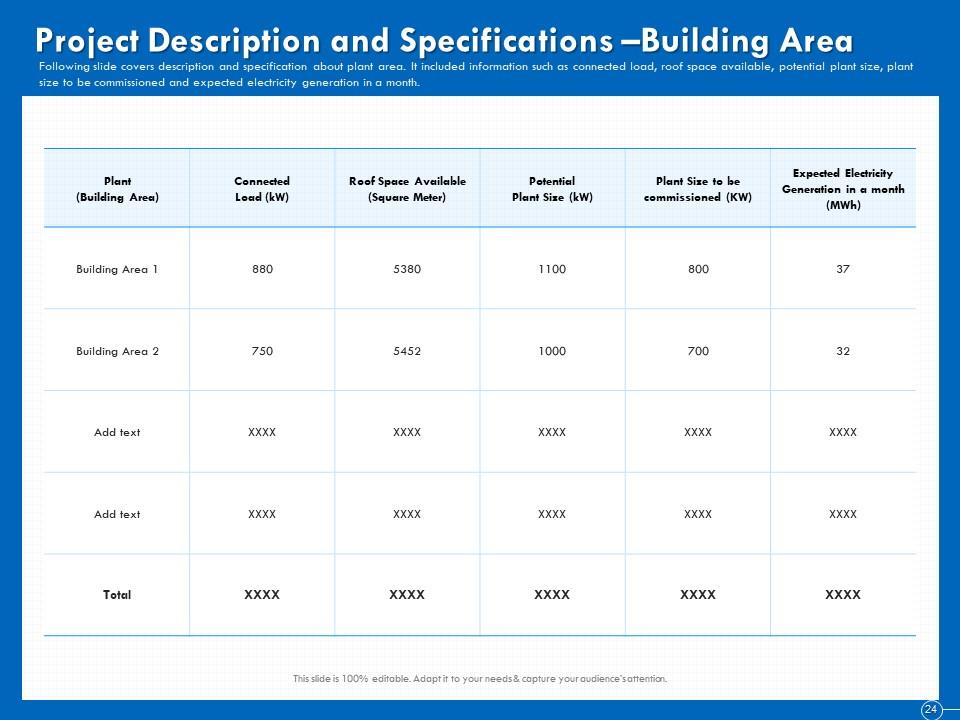
Slide 24: This slide covers description and specification about plant area. It included information such as connected load, roof space available, potential plant size, plant size to be commissioned and expected electricity generation in a month.
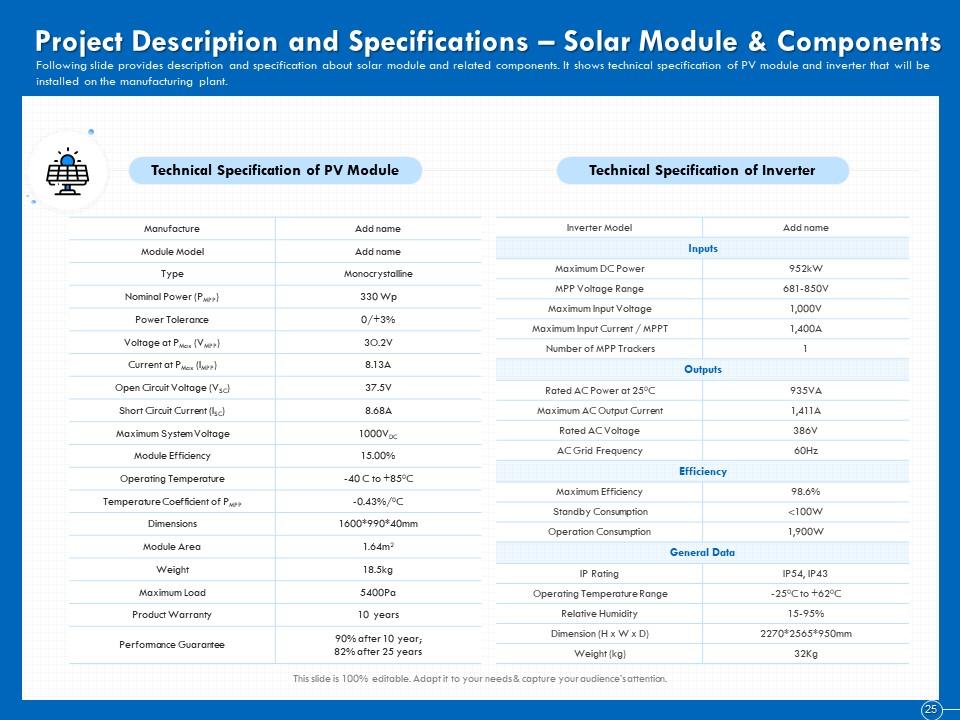
Slide 25: This slide provides description and specification about solar module and related components. It shows technical specification of PV module and inverter that will be installed on the manufacturing plant.
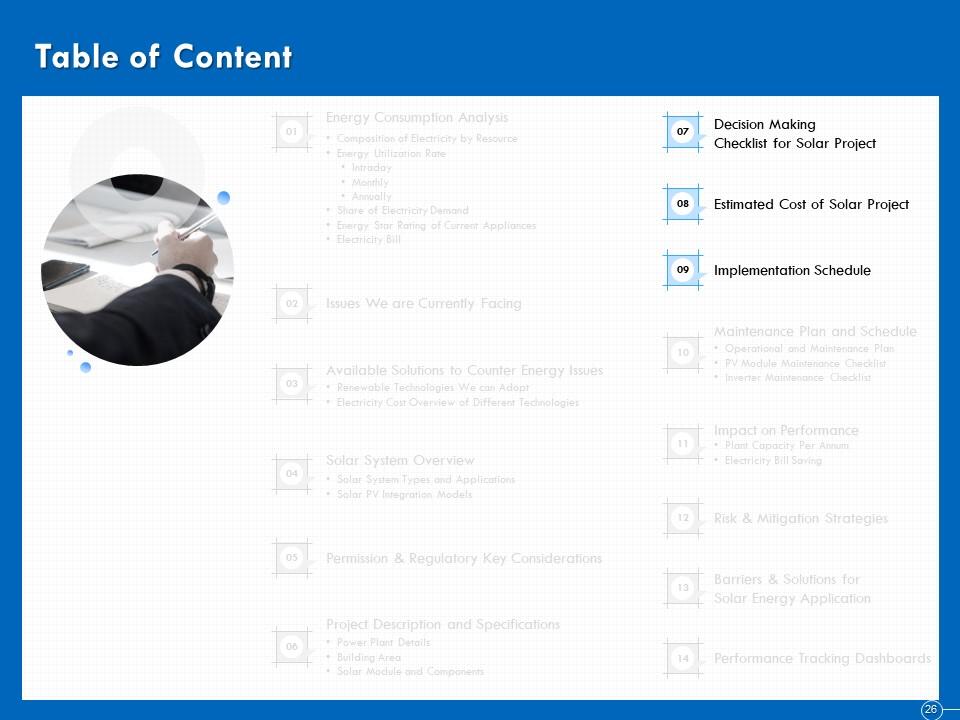
Slide 26: This slide displays Table of Content.
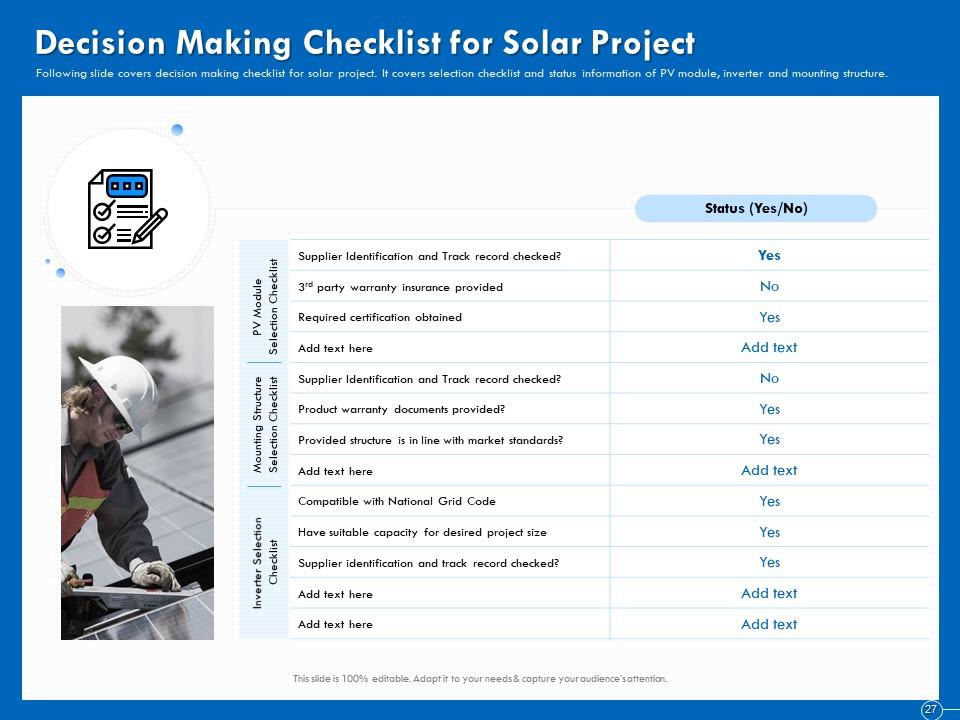
Slide 27: This slide covers decision making checklist for solar project. It covers selection checklist and status information of PV module, inverter and mounting structure.
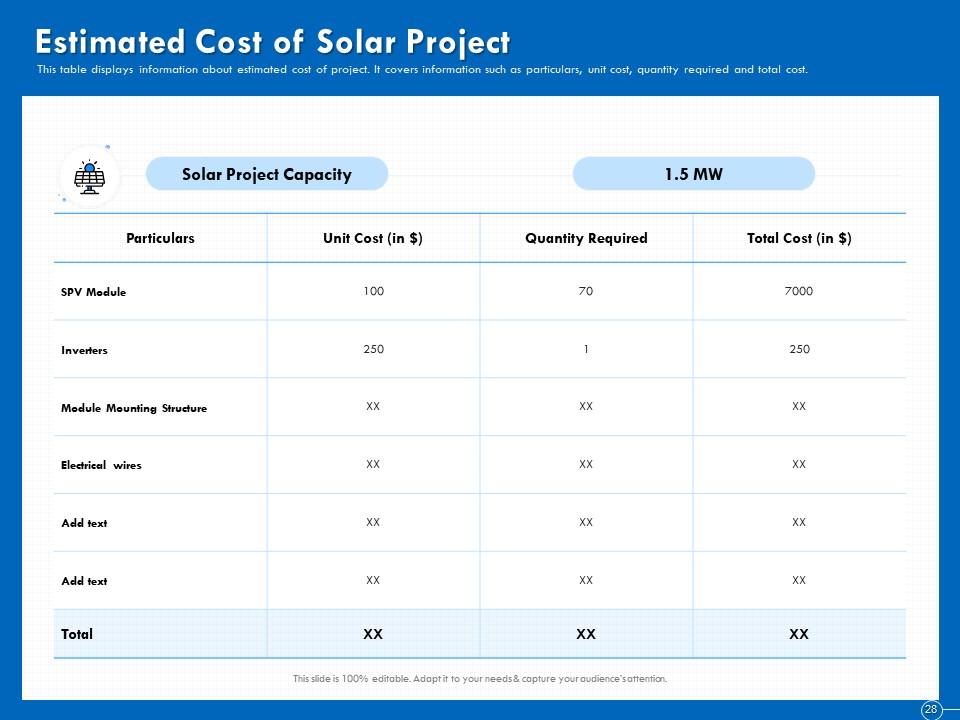
Slide 28: This table displays information about estimated cost of project. It covers information such as particulars, unit cost, quantity required and total cost.
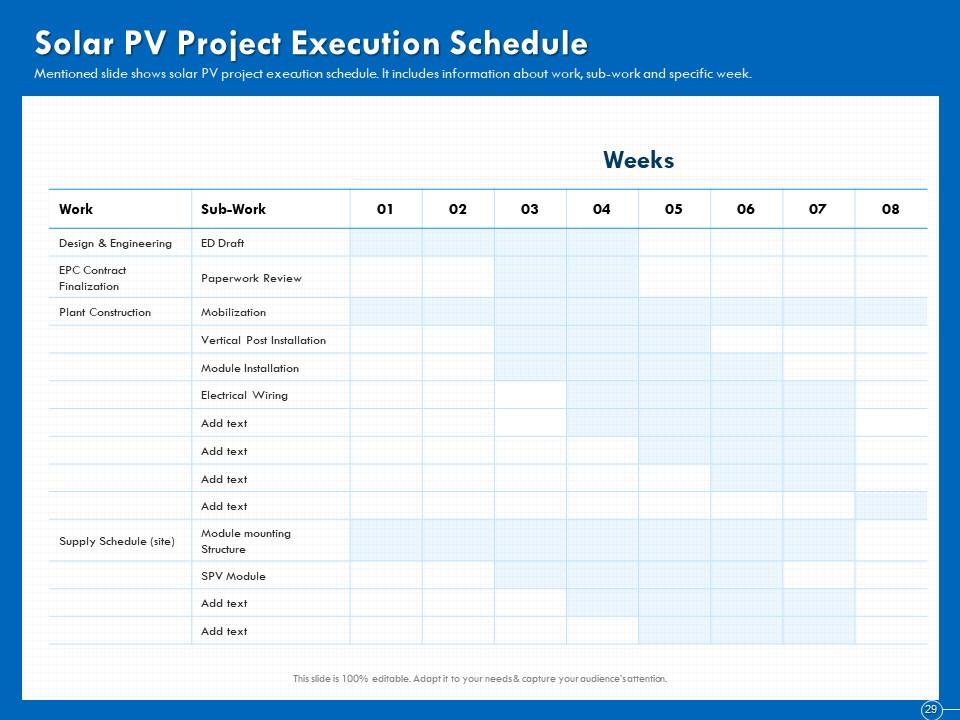
Slide 29: Mentioned slide shows solar PV project execution schedule. It includes information about work, sub-work and specific week.
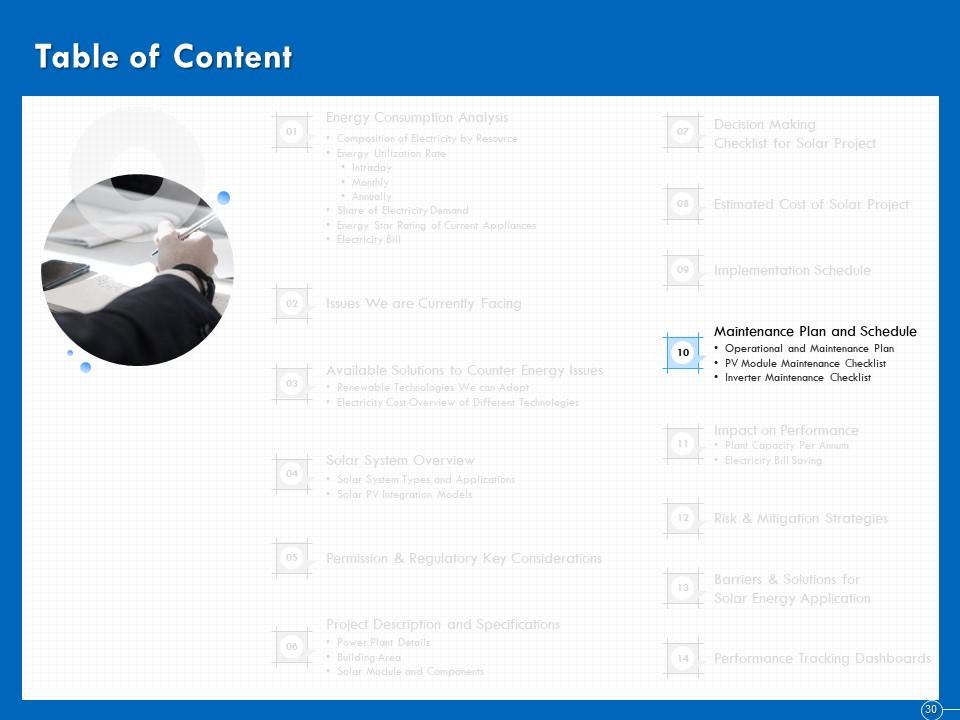
Slide 30: This slide displays Table of Content of the presentation.
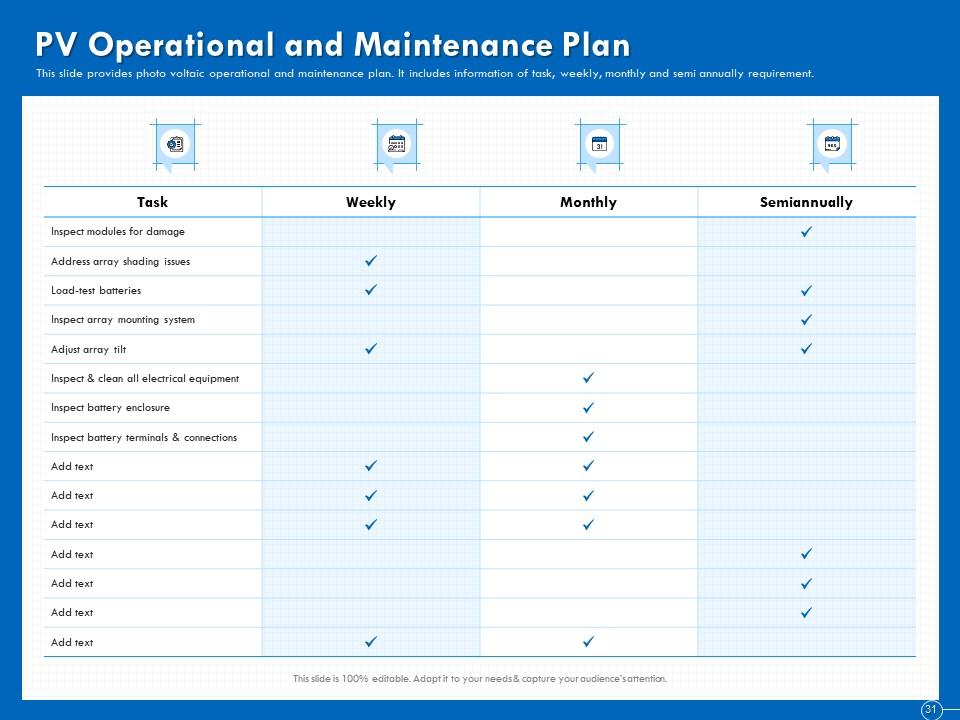
Slide 31: This slide provides photo voltaic operational and maintenance plan. It includes information of task, weekly, monthly and semi annually requirement.
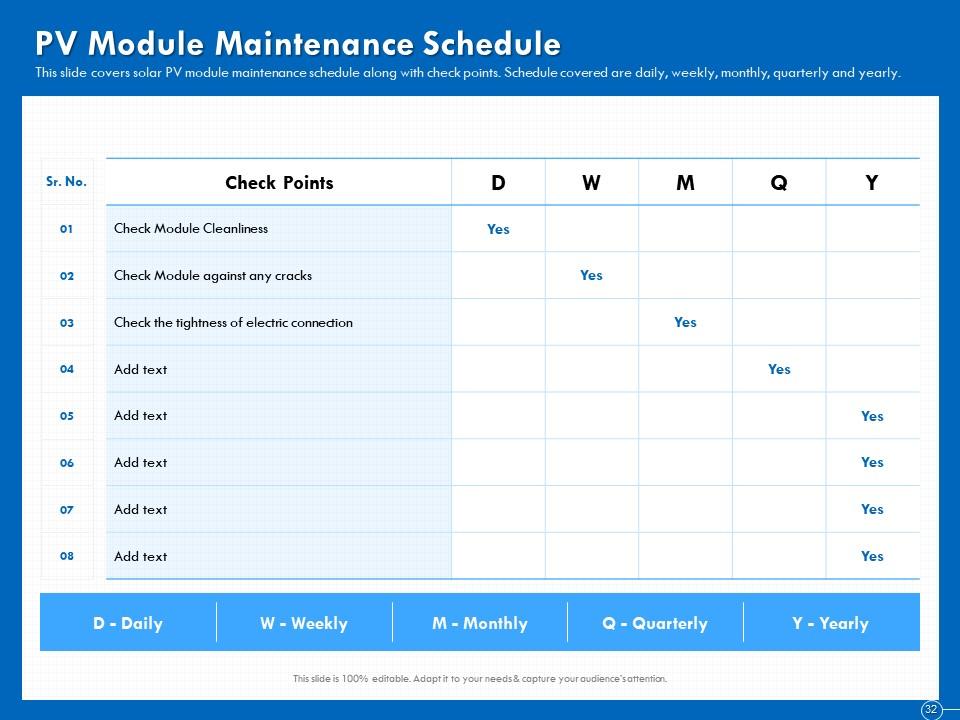
Slide 32: This slide covers solar PV module maintenance schedule along with check points. Schedule covered are daily, weekly, monthly, quarterly and yearly.
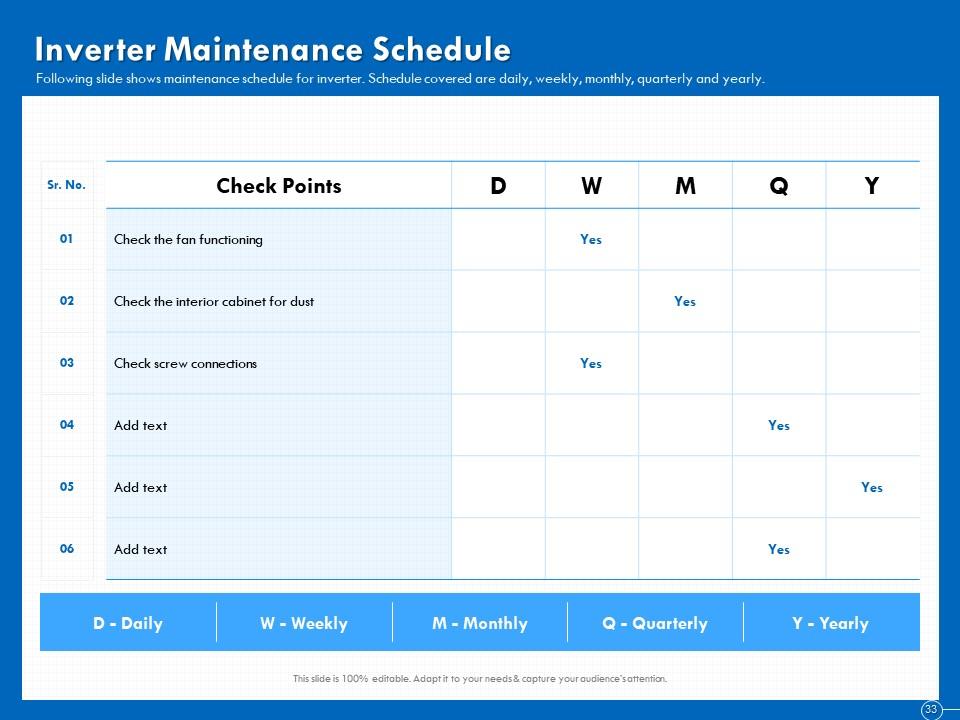
Slide 33: This slide shows maintenance schedule for inverter. Schedule covered are daily, weekly, monthly, quarterly and yearly.
Slide 34: This slide displays Table of Content
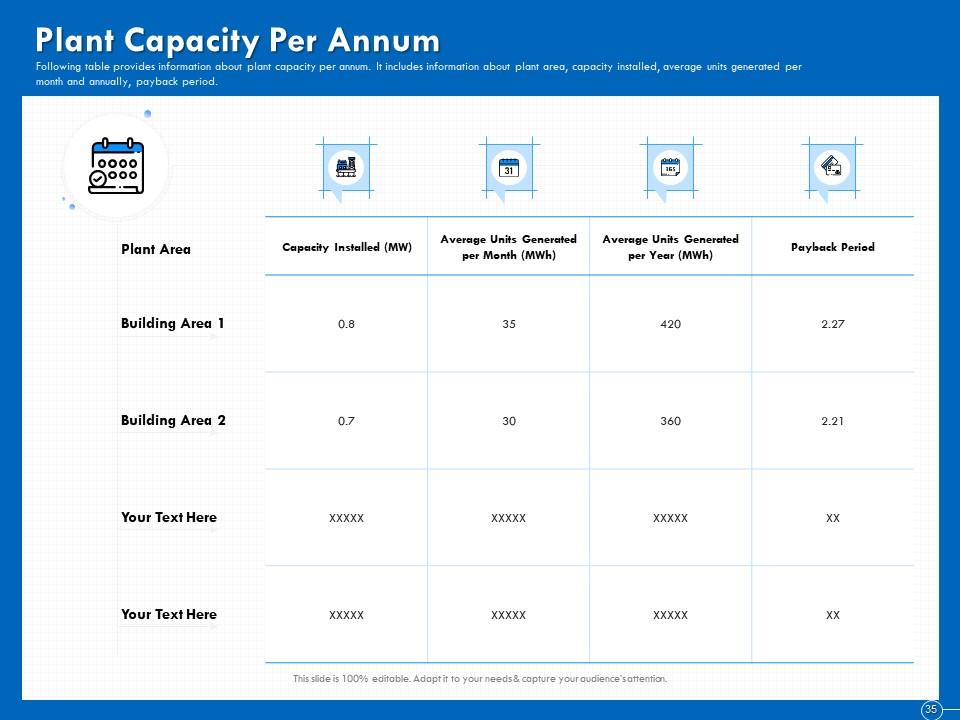
Slide 35: The table in the slide provides information about plant capacity per annum. It includes information about plant area, capacity installed, average units generated per month and annually, payback period.
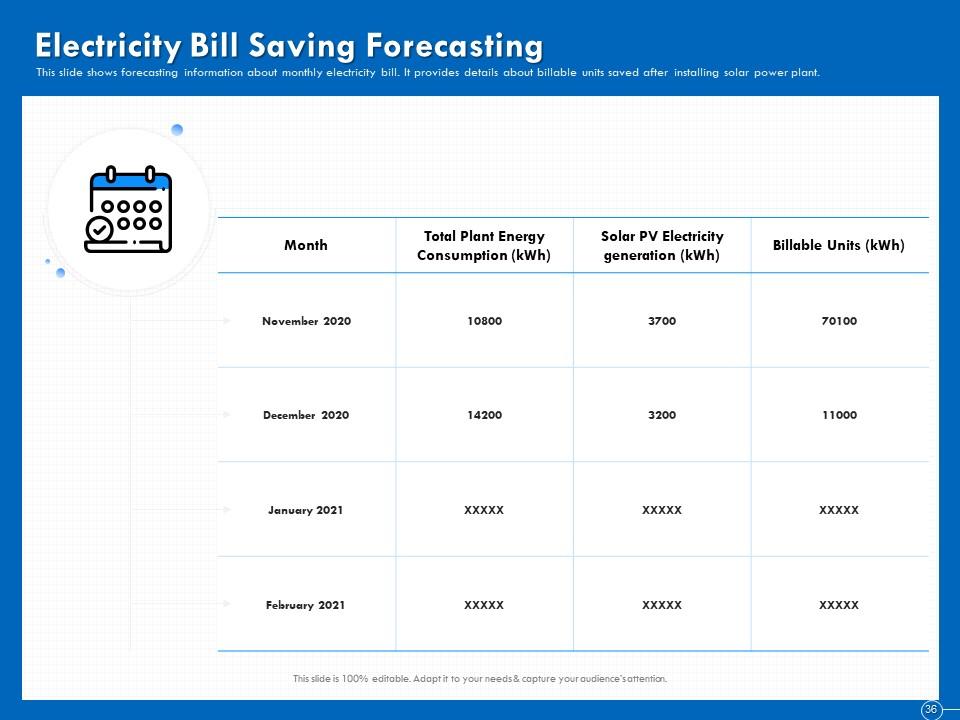
Slide 36: This slide shows forecasting information about monthly electricity bill. It provides details about billable units saved after installing solar power plant.
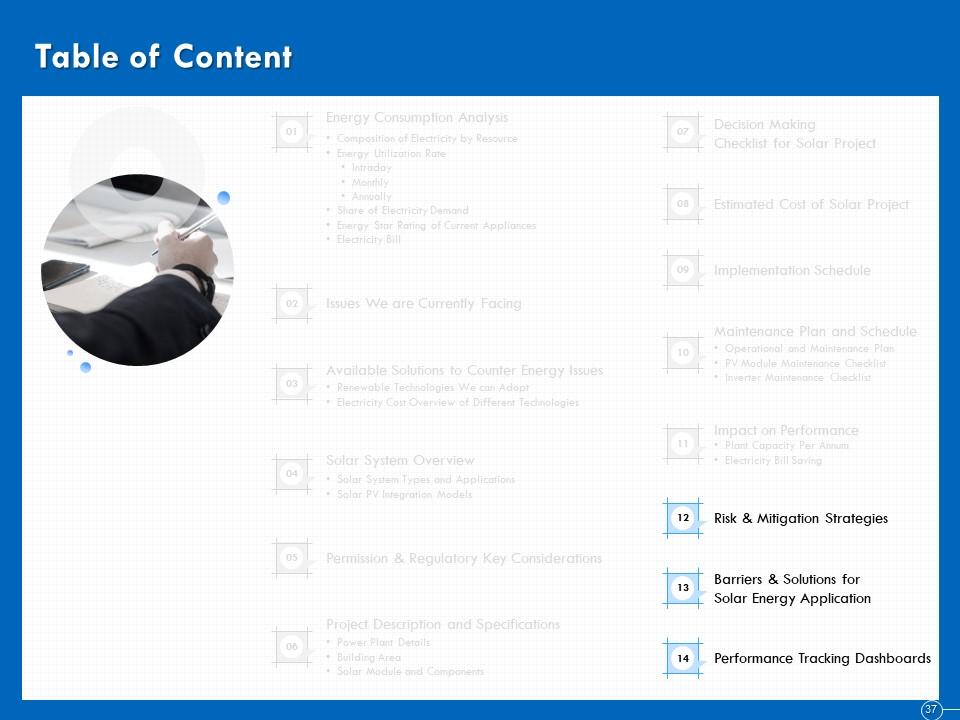
Slide 37: This slide displays Table of Content.
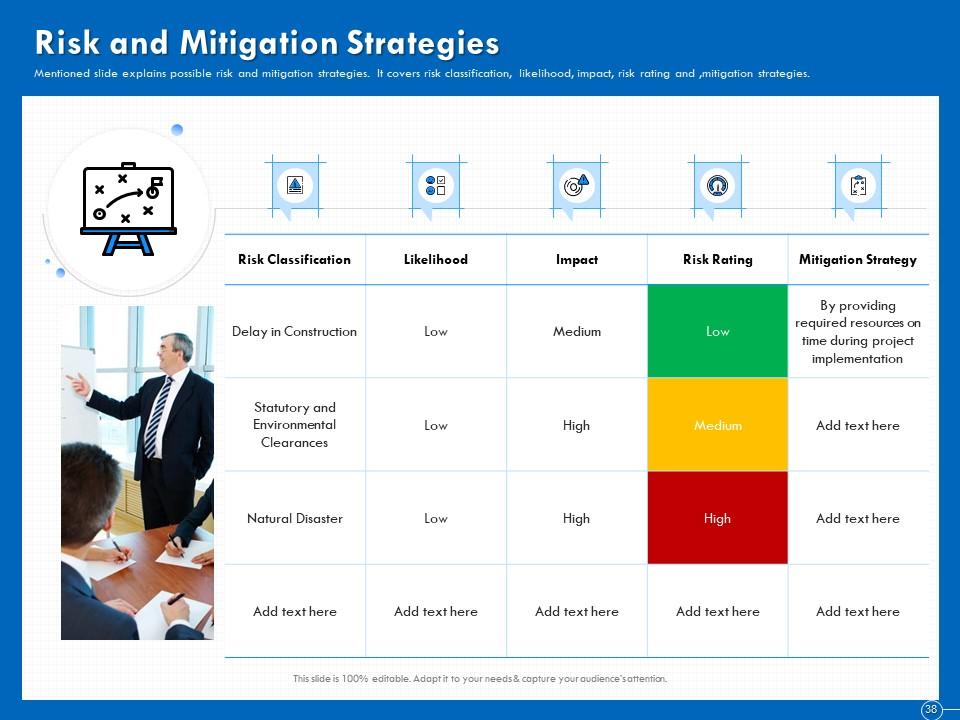
Slide 38: This slide explains possible risk and mitigation strategies. It covers risk classification, likelihood, impact, risk rating and ,mitigation strategies.
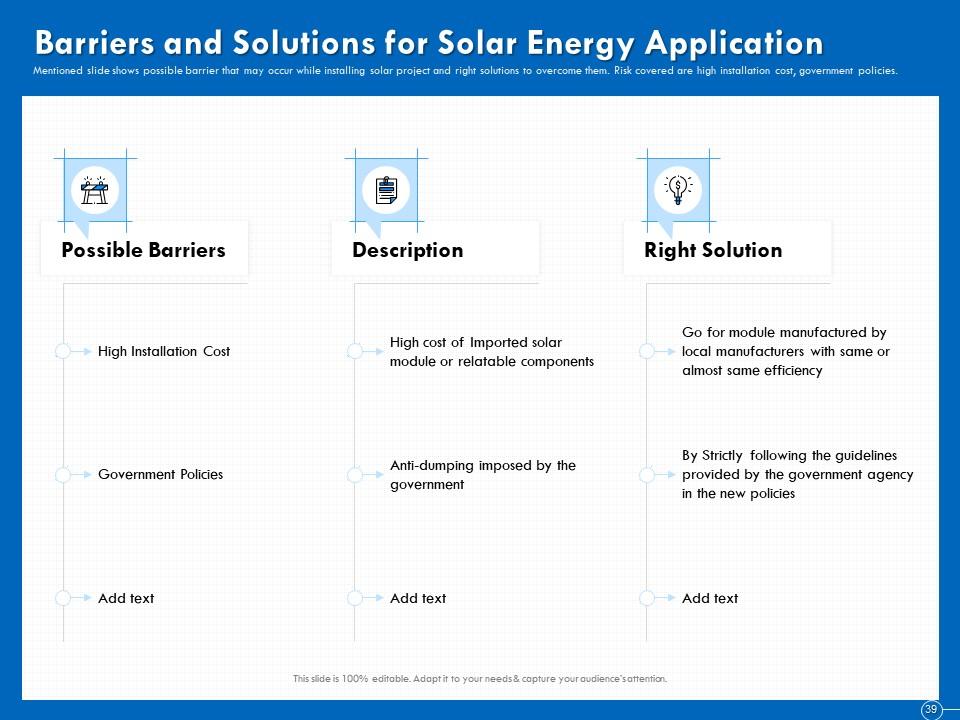
Slide 39: This slide shows possible barrier that may occur while installing solar project and right solutions to overcome them. Risk covered are high installation cost, government policies.
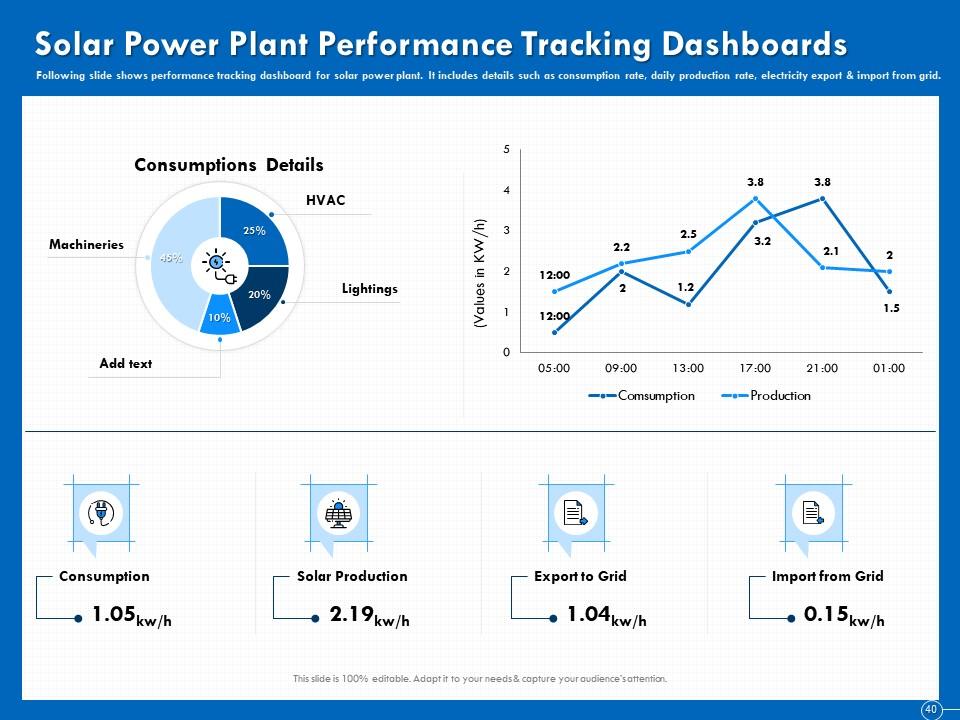
Slide 40: This slide shows performance tracking dashboard for solar power plant. It includes details such as consumption rate, daily production rate, electricity export & import from grid.
Slide 41: This is Industrial Shift To Renewable Energy Icons Slide.
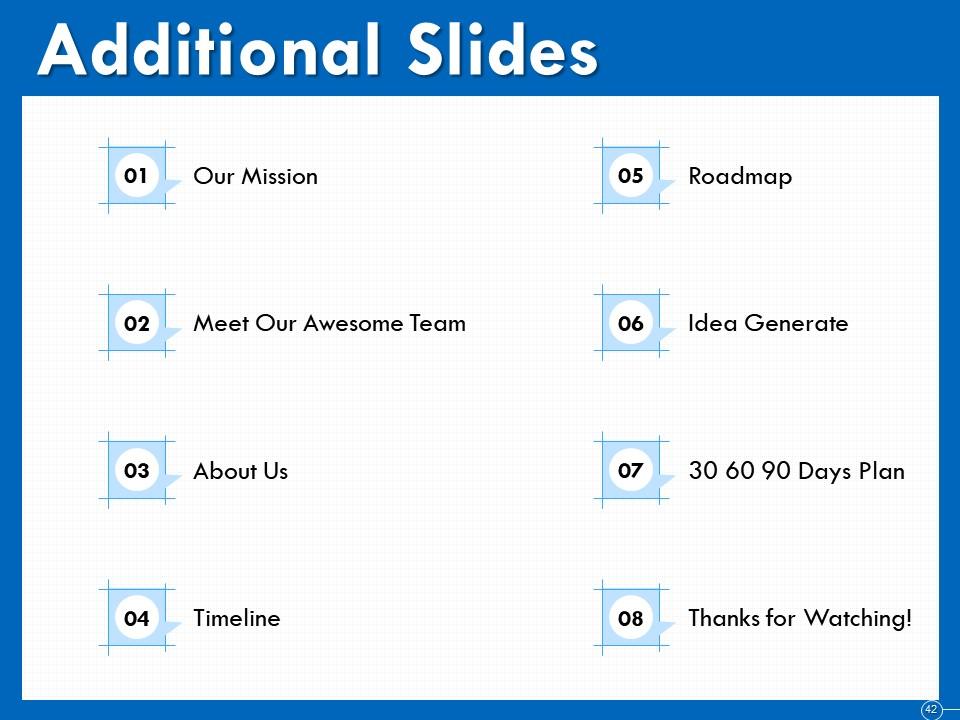
Slide 42: This slide is titled as Additional Slides for moving forward.
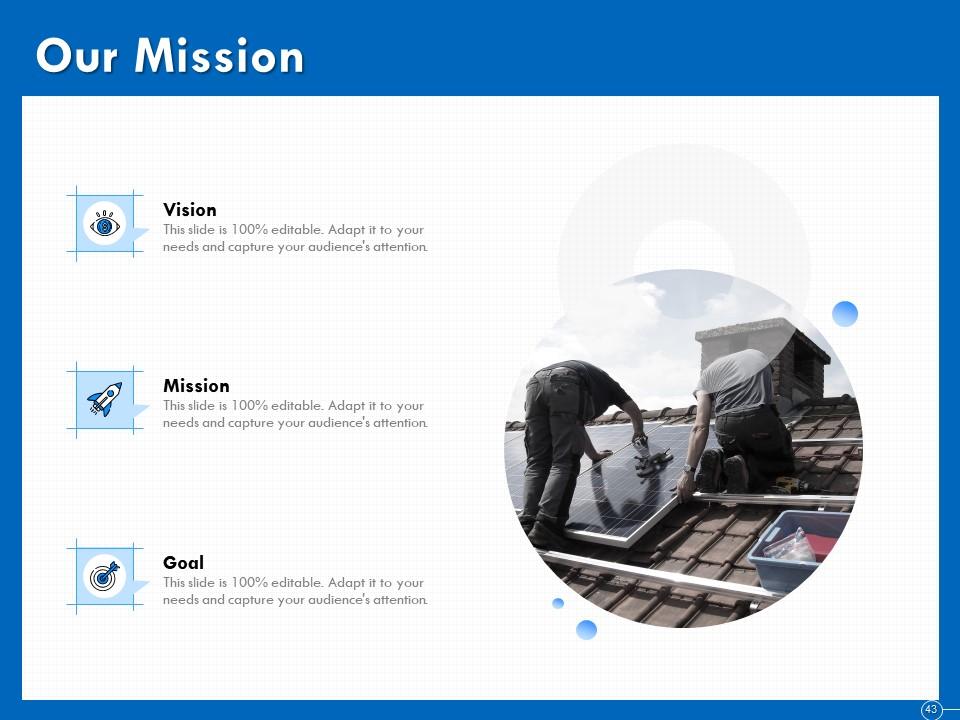
Slide 43: This slide displays Mission, Vision and Goals.
Slide 44: This is Our team slide with Names and Designations.
Slide 45: This is About Us slide to showcase Company specifications.
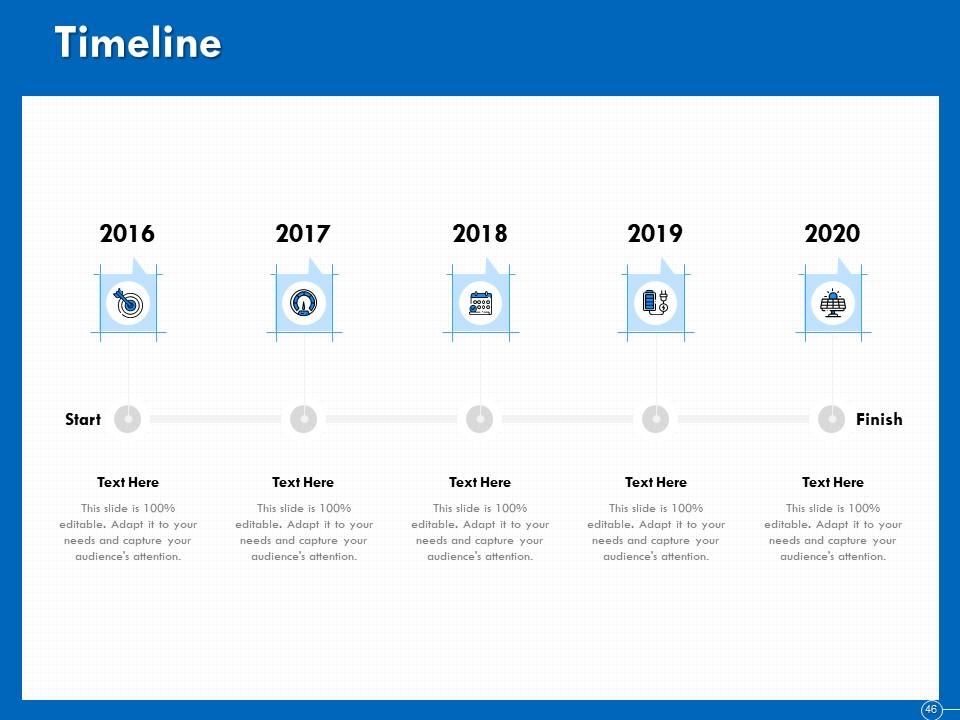
Slide 46: This slide depicts Timeline process.
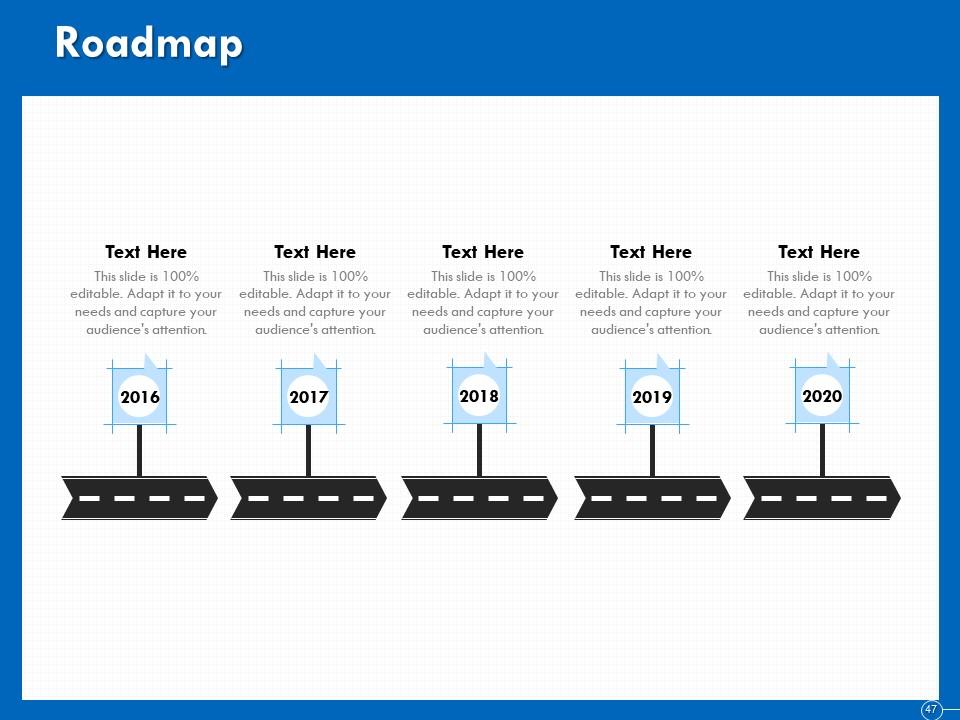
Slide 47: This slide shows Roadmap process.
Slide 48: This slide presents Idea Generation to highlight ideas and facts.
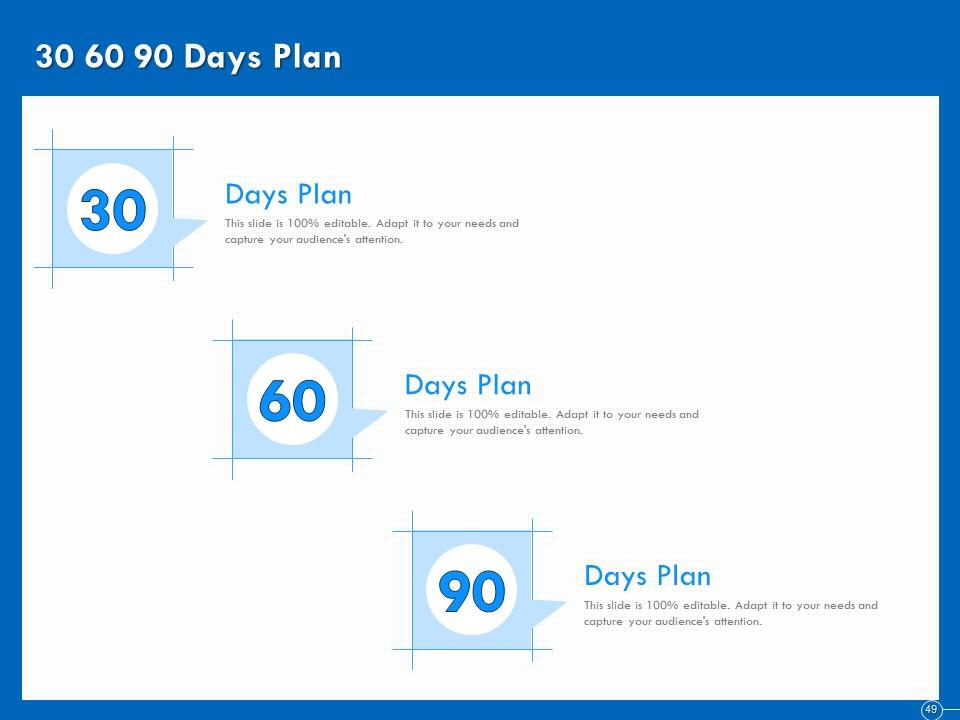
Slide 49: This is 30 60 90 Days Plan slide.
Slide 50: This is Thank you slide with Contact details.
Industrial shift to renewable energy powerpoint presentation slides with all 50 slides:
Introducing our all-inclusive Industrial Shift To Renewable Energy PowerPoint Presentation Slides. Present an engaging company overview regarding issues you face, employees, business units, headquarters, key competitors, risk mitigation strategy, profitability, solar system, etc by employing our renewable energy technology PPT slideshow. You can easily explain the energy utilization rate by utilizing these content-specific renewable energy projections PPT visuals. Highlight the growing demand for electricity using these renewable energy PPT designs and capture your audience’s attention almost immediately. Provide a list of renewable technologies such as thermal energy, solar energy, and biogas energy and their brief introduction with the assistance of these sustainable energy PPT graphics. Illustrate the permission and regulatory key considerations along with energy composition analysis using this renewable energy industry PPT presentation. You can even elaborate on the estimated cost of solar projects, operational, and maintenance plans by deploying these attention-grabbing power industry shift PPT themes. So without waiting any further, click the download button!
-
Easily Understandable slides.


