
Information technology gantt chart
You must be logged in to download this presentation.


Try Before you Buy Download Free Sample Product
 Impress Your
 Audience
Editable
of Time


Ring in the new with our Information Technology Gantt Chart. Bells of prosperity will begin to peal.
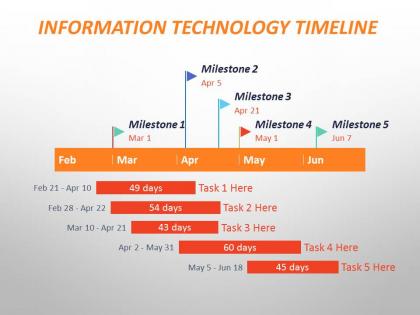
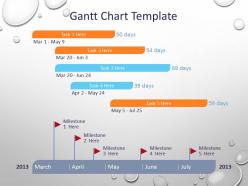
We are proud to present our information technology gantt chart. Free Gantt Chart Template is a pre-designed PowerPoint slide template created for high-level project presentations to your to staff, clients and executives. Gantt Chart Template was created with the Free Office Timeline PowerPoint add-in which you can also use to quickly edit Gantt Chart Timeline template including, easily changing texts and dates, changing the scale and position of the timeline, and changing the shapes of the objects and their colors?all automatically done with a few simple clicks.
People who downloaded this PowerPoint presentation also viewed the following :
Information technology gantt chart with all 3 slides:
Castle your opponents with our Information Technology Gantt Chart. Make the move with our Information Technology Gantt Chart.

Most Relevant Reviews
-
Graphics are very appealing to eyes.
-
Topic best represented with attractive design.
-
beautifully designed and easy adaptable!!