


Key Financial Success Indicators For Company


Try Before you Buy Download Free Sample Product
 Impress Your
 Audience
Editable
of Time


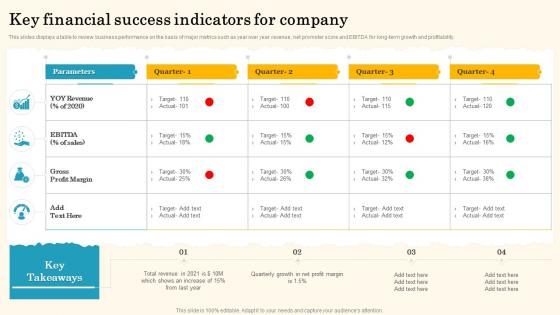
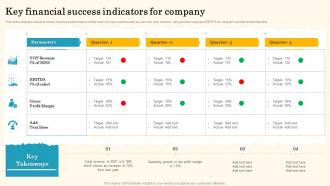
This slides displays a table to review business performance on the basis of major metrics such as year over year revenue, net promoter score and EBITDA for long-term growth and profitability.
People who downloaded this PowerPoint presentation also viewed the following :
Key Financial Success Indicators For Company with all 6 slides:
Use our Key Financial Success Indicators For Company to effectively help you save your valuable time. They are readymade to fit into any presentation structure.


FAQs for Key Financial Success
So the big ones you'll want to watch are revenue growth, gross profit margin, and cash flow - that's your foundation right there. Net profit margin shows if you're actually making money after everything. Burn rate tells you how fast you're bleeding cash. Customer acquisition cost and lifetime value are super important too, especially when you're trying to grow. I mean, there's probably like 50 other metrics you could obsess over, but honestly? These six will give you a really good read on how things are going. Start here and you can always add more later when things get messier.
Different industries care about totally different numbers, which makes sense when you think about it. SaaS companies are all about monthly recurring revenue and how much they spend getting customers. Meanwhile manufacturing is tracking inventory turnover and margins per unit. Retail? Same-store sales growth is everything - but that's useless if you're running a consulting firm. Even when industries use the same metric, the benchmarks are crazy different. 5% profit margin kills it in grocery stores but sucks for software companies. Honestly, just look up what your actual competitors track instead of generic business stuff.
So KPIs are basically your business GPS - they tell you where you're at vs where you wanna be. Pick like 3-5 that actually matter for your goals (revenue growth, profit margins, cash flow stuff). Review them regularly to see if you're on track or need to switch things up. Honestly, data beats guessing most of the time, but don't completely ignore your gut either. The trick is choosing ones that make sense for YOUR specific situation - not just what some business blog says you should track. Makes strategic planning way less of a shot in the dark.
Honestly, just pick 3-5 metrics that actually tell you something useful - gross profit margin, cash flow, customer acquisition cost. Skip the fancy dashboard stuff for now (seriously, I've watched so many people get obsessed with making pretty charts instead of running their business). A basic spreadsheet works fine, or whatever simple accounting software you're already using. The trick is being consistent about it. Check them monthly, same time every month. Actually make decisions based on what you see - that's the whole point, right? You can get all sophisticated later once this becomes second nature.
So liquidity ratios basically tell you if you can pay your bills on time without panicking. Current ratio and quick ratio are the big ones to watch. Honestly, I've seen too many businesses think they're doing fine until suddenly they can't cover payroll. Keep your current ratio between 1.0 and 2.0 - below means trouble paying debts, above means you're hoarding cash (which isn't great either). Check these monthly at least. Trust me, catching problems early beats scrambling later when vendors start calling.
Look, investors basically want three things: growth, profit, and solid cash management. Good KPIs in those areas build confidence and help your valuation. When your numbers suck though? That's when earnings calls get brutal - trust me on that one. Pick 4-5 metrics that actually matter for your specific business model and track them consistently. Don't try to sugarcoat bad trends, but be transparent about what's happening. Consistency beats perfection here. You'll want this data locked down before any investor meetings because they'll definitely ask.
Honestly, the hardest part is just how many damn options there are. You'll get totally overwhelmed trying to pick between all these shiny metrics that look cool but won't actually help you make decisions. Plus you're juggling leading stuff (pipeline growth) with lagging stuff (revenue), and different people want to see different things - sales wants one thing, leadership wants another. Super messy. I'd say just start with maybe 3-5 KPIs that actually connect to what you're trying to do right now. Don't overthink it. You can always add more later once you prove this whole thing works.
ROI is basically net profit divided by what you initially spent, then times 100 for the percentage. Like if you put in $1,000 and got back $1,200, that's ($200 ÷ $1,000) × 100 = 20%. Make sure you're counting all your costs though - maintenance, fees, whatever. I learned this the hard way when I forgot about some stupid monthly charges and my numbers were way off. Honestly, finance people love catching these mistakes so double-check everything. Check your ROI every few months to see how things are trending. Short sentences help sometimes.
Look, KPIs are just how you figure out if your business is actually making money or slowly dying. Cash flow, profit margins, revenue growth - track these together and you'll see the real picture of how things are going. It's like checking your pulse, but for your company instead. Honestly, most people overthink this stuff. Strong numbers mean you're doing something right. Declining ones? Time to panic a little and figure out what's broken. Pick maybe 3-5 metrics that actually matter for your industry and check them monthly. Don't go crazy with too many.
Track your financial KPIs monthly to spot trends before they smack you in the face. Cash flow, revenue growth, customer acquisition costs - these show momentum way before your profits do. Don't rely on just one metric though, that's like driving with one eye closed. Rising acquisition costs + dropping retention? Yeah, you're probably headed for trouble. Pick 3-5 KPIs that actually matter for your business model and watch how they move together. The patterns tell the real story. I learned this the hard way when I ignored early warning signs and... well, let's just say it wasn't fun.
So many ways to track this stuff! Most people just use Excel or Google Sheets at first - can't go wrong there since everyone already knows them. If you want something fancier, Tableau and Power BI are solid choices. QuickBooks works great for financial metrics too. Honestly though? I've watched teams spend weeks building these elaborate dashboards when a basic spreadsheet would've been fine. But hey, if you actually need real-time updates, then HubSpot or Salesforce make sense. There's also Klipfolio for KPI tracking specifically. My advice - start with whatever you've got lying around, then get fancy later when things get complicated.
Look, monthly is the bare minimum but it really depends on what you're tracking. Cash flow stuff? Check that weekly or even daily - learned that the hard way once. Revenue too if you're in something unpredictable. But profitability ratios and growth metrics don't swing around as much, so quarterly works fine for those. Honestly, the biggest thing is just being consistent about it. Pick whatever schedule actually works and stick to it instead of randomly checking when you panic. Set those calendar reminders now before you forget!
Dude, the worst mistake is looking at KPIs by themselves without any context. You gotta compare them to industry standards and your own historical data. Don't chase those flashy vanity metrics either - like revenue per employee might look amazing until you realize you're bleeding money elsewhere. Seasonal stuff will totally throw you off too, especially if you're comparing random time periods. Oh, and this is huge - double-check your data quality. I've seen people make terrible decisions because their numbers were garbage to begin with. Always verify with 2-3 different sources before you do anything drastic.
Look, tracking financial KPIs is basically how you stop throwing money at random stuff and actually see what's working. Once you dig into the numbers, you'll probably be shocked at which departments are crushing it vs. which ones are just burning cash. Trends become super obvious too – like when your customer acquisition costs start going crazy or certain revenue streams tank. Honestly, I wish I'd started doing this sooner. Pick 3-5 metrics that matter most for your goals, then let those numbers guide your spending decisions next quarter instead of just winging it.
So the best ones to watch are customer acquisition cost, pipeline value, and recurring revenue growth - basically stuff that hints at what's coming before it hits your books. Quote-to-close ratios are gold too, honestly. Churn rates will tell you if you're bleeding customers before it tanks your numbers. Oh, and definitely keep an eye on accounts receivable aging because cash flow issues sneak up fast. I'd pick maybe 2-3 that actually matter for your business and check them weekly. Don't go overboard tracking everything.
-
Good research work and creative work done on every template.
-
They helped us design the pamphlets for our church’s food drive! The people loved the design, and I’m happy to say it was successful. Thank you, SlideTeam!