Key Performance Indicators After Implementing Sales Strategy Creating Competitive Sales Strategy
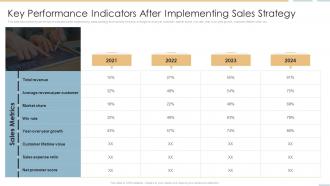
This slide shows the key performance indicators after implementing sales strategy such as total revenue, average revenue per customer, market share, win rate, year over year growth, customer lifetime value, etc.
- Google Slides is a new FREE Presentation software from Google.
- All our content is 100% compatible with Google Slides.
- Just download our designs, and upload them to Google Slides and they will work automatically.
- Amaze your audience with SlideTeam and Google Slides.
-
Want Changes to This PPT Slide? Check out our Presentation Design Services
- WideScreen Aspect ratio is becoming a very popular format. When you download this product, the downloaded ZIP will contain this product in both standard and widescreen format.
-

- Some older products that we have may only be in standard format, but they can easily be converted to widescreen.
- To do this, please open the SlideTeam product in Powerpoint, and go to
- Design ( On the top bar) -> Page Setup -> and select "On-screen Show (16:9)” in the drop down for "Slides Sized for".
- The slide or theme will change to widescreen, and all graphics will adjust automatically. You can similarly convert our content to any other desired screen aspect ratio.
Compatible With Google Slides

Get This In WideScreen
You must be logged in to download this presentation.
PowerPoint presentation slides
This slide shows the key performance indicators after implementing sales strategy such as total revenue, average revenue per customer, market share, win rate, year over year growth, customer lifetime value, etc. Increase audience engagement and knowledge by dispensing information using Key Performance Indicators After Implementing Sales Strategy Creating Competitive Sales Strategy. This template helps you present information on one stage. You can also present information on Total Revenue, Market Share, Sales Expense Ratio using this PPT design. This layout is completely editable so personaize it now to meet your audiences expectations.
People who downloaded this PowerPoint presentation also viewed the following :
Key Performance Indicators After Implementing Sales Strategy Creating Competitive Sales Strategy with all 6 slides:
Use our Key Performance Indicators After Implementing Sales Strategy Creating Competitive Sales Strategy to effectively help you save your valuable time. They are readymade to fit into any presentation structure.
-
The website is jam-packed with fantastic and creative templates for a variety of business concepts. They are easy to use and customize.
-
Their templates are super easy to edit and use even for the one like me who is not familiar with PowerPoint. Great customer support.


