Powerpoint Templates and Google slides for Total Revenue
Save Your Time and attract your audience with our fully editable PPT Templates and Slides.
-
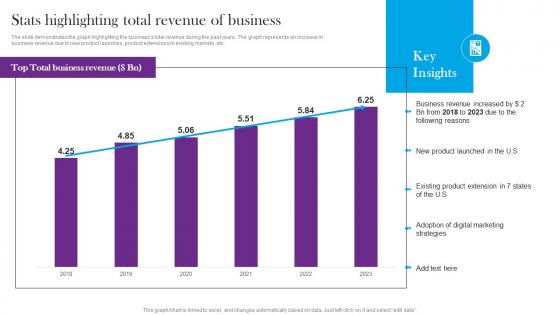 Stats Highlighting Total Revenue Of Business Comprehensive Guide For Global
The slide demonstrates the graph highlighting the businesss total revenue during the past years. The graph represents an increase in business revenue due to new product launches, product extensions in existing markets, etc. Deliver an outstanding presentation on the topic using this Stats Highlighting Total Revenue Of Business Comprehensive Guide For Global. Dispense information and present a thorough explanation of Business Revenue Increased, New Product Launched using the slides given. This template can be altered and personalized to fit your needs. It is also available for immediate download. So grab it now.
-
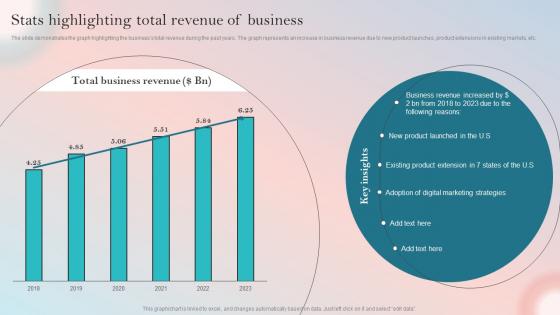 Product Expansion Guide To Increase Brand Stats Highlighting Total Revenue Of Business
The slide demonstrates the graph highlighting the businesss total revenue during the past years. The graph represents an increase in business revenue due to new product launches, product extensions in existing markets, etc. Deliver an outstanding presentation on the topic using this Product Expansion Guide To Increase Brand Stats Highlighting Total Revenue Of Business. Dispense information and present a thorough explanation of Business Revenue using the slides given. This template can be altered and personalized to fit your needs. It is also available for immediate download. So grab it now.
-
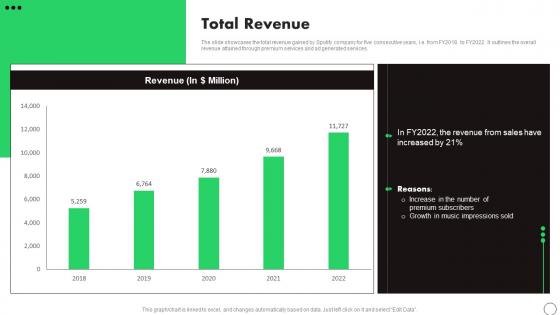 Total Revenue Spotify Company Profile Ppt Professional CP SS
The slide showcases the total revenue gained by Spotify company for five consecutive years, i.e. from FY2018 to FY2022. It outlines the overall revenue attained through premium services and ad generated services. Present the topic in a bit more detail with this Total Revenue Spotify Company Profile Ppt Professional CP SS. Use it as a tool for discussion and navigation on Revenue, Increased, Growth. This template is free to edit as deemed fit for your organization. Therefore download it now.
-
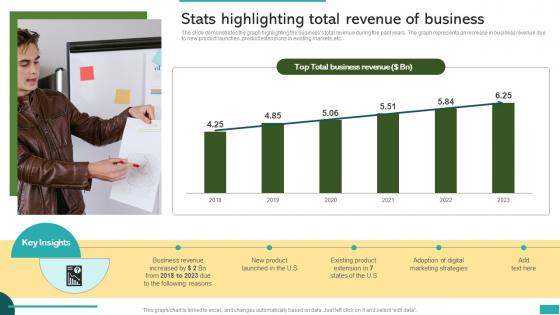 Stats Highlighting Total Revenue Of Business Global Market Expansion For Product
The slide demonstrates the graph highlighting the businesss total revenue during the past years. The graph represents an increase in business revenue due to new product launches, product extensions in existing markets, etc. Deliver an outstanding presentation on the topic using this Stats Highlighting Total Revenue Of Business Global Market Expansion For Product. Dispense information and present a thorough explanation of Marketing Strategies, Adoption Digital , Existing Product using the slides given. This template can be altered and personalized to fit your needs. It is also available for immediate download. So grab it now.
-
 Stats Highlighting Total Revenue Of Key Steps Involved In Global Product Expansion
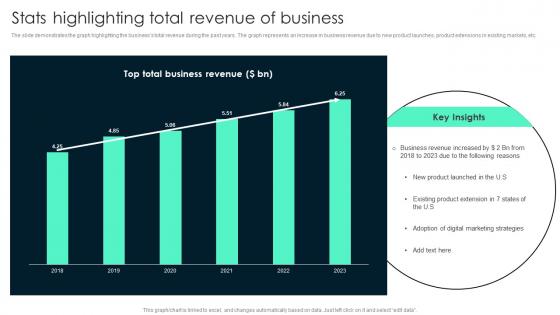
The slide demonstrates the graph highlighting the businesss total revenue during the past years. The graph represents an increase in business revenue due to new product launches, product extensions in existing markets, etc. Deliver an outstanding presentation on the topic using this Stats Highlighting Total Revenue Of Key Steps Involved In Global Product Expansion. Dispense information and present a thorough explanation of Revenue, Business, Increased using the slides given. This template can be altered and personalized to fit your needs. It is also available for immediate download. So grab it now.
-
 Global Product Expansion Stats Highlighting Total Revenue Of Business
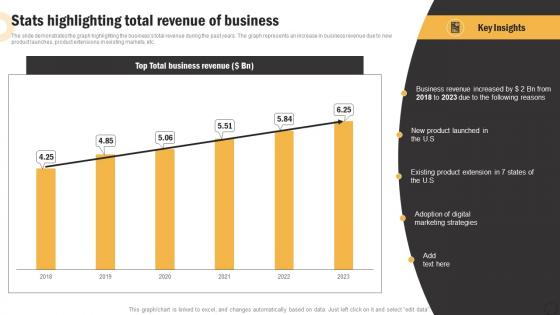
The slide demonstrates the graph highlighting the businesss total revenue during the past years. The graph represents an increase in business revenue due to new product launches, product extensions in existing markets, etc. Deliver an outstanding presentation on the topic using this Global Product Expansion Stats Highlighting Total Revenue Of Business. Dispense information and present a thorough explanation of Business Revenue, Existing Product Extension using the slides given. This template can be altered and personalized to fit your needs. It is also available for immediate download. So grab it now.
-
 Stats Highlighting Total Revenue Of Business Product Expansion Steps
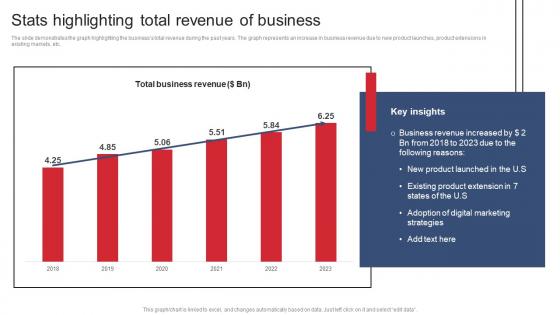
The slide demonstrates the graph highlighting the businesss total revenue during the past years. The graph represents an increase in business revenue due to new product launches, product extensions in existing markets, etc. Deliver an outstanding presentation on the topic using this Stats Highlighting Total Revenue Of Business Product Expansion Steps. Dispense information and present a thorough explanation of Total Business Revenue using the slides given. This template can be altered and personalized to fit your needs. It is also available for immediate download. So grab it now.
-
 Gym Fitness Trackers And Application Industry Total Revenue Crossfit Gym Business Plan BP SS
The purpose of this slide is to highlight the total revenue of fitness trackers, fitness apps, digital fitness, fitness equipment, boutique fitness and gym industry. It also showcases that the industry is expected to add new studios. Present the topic in a bit more detail with this Gym Fitness Trackers And Application Industry Total Revenue Crossfit Gym Business Plan BP SS. Use it as a tool for discussion and navigation on Revenue, Application, Equipment. This template is free to edit as deemed fit for your organization. Therefore download it now.
-
 Gym Fitness Trackers And Application Industry Total Revenue Fitness Center Business Plan BP SS
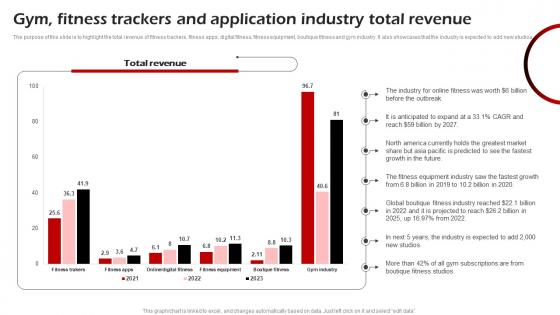
The purpose of this slide is to highlight the total revenue of fitness trackers, fitness apps, digital fitness, fitness equipment, boutique fitness and gym industry. It also showcases that the industry is expected to add new studios. Present the topic in a bit more detail with this Gym Fitness Trackers And Application Industry Total Revenue Fitness Center Business Plan BP SS. Use it as a tool for discussion and navigation on Application, Growth, Subscriptions. This template is free to edit as deemed fit for your organization. Therefore download it now.
-
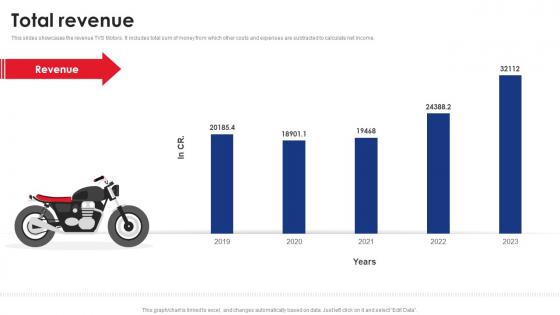 Total Revenue TVS Motor Company Profile CP SS
This slides showcases the revenue TVS Motors. It includes total sum of money from which other costs and expenses are subtracted to calculate net income. Deliver an outstanding presentation on the topic using this Total Revenue TVS Motor Company Profile CP SS Dispense information and present a thorough explanation of Total Revenue using the slides given. This template can be altered and personalized to fit your needs. It is also available for immediate download. So grab it now.
-
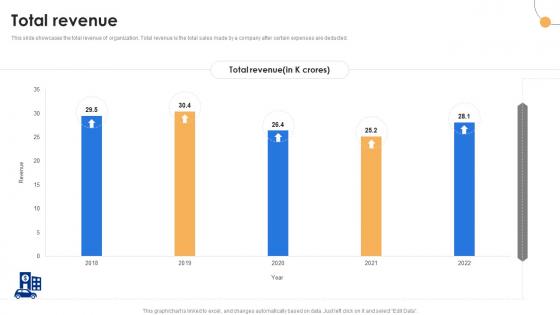 Total Revenue Tata Motors Company Profile Ppt Portfolio Smartart CP SS
This slide showcases the total revenue of organization. Total revenue is the total sales made by a company after certain expenses are deducted. Present the topic in a bit more detail with this Total Revenue Tata Motors Company Profile Ppt Portfolio Smartart CP SS Use it as a tool for discussion and navigation on Total Revenue This template is free to edit as deemed fit for your organization. Therefore download it now.
-
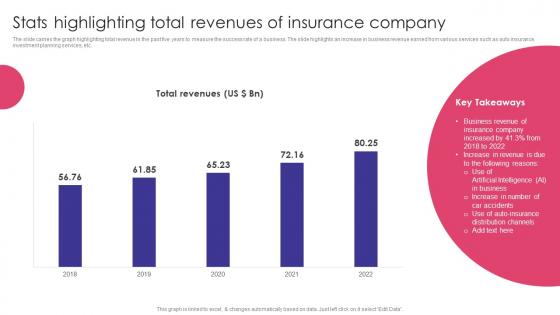 Stats Highlighting Total Revenues Of Insurance Company Auto Insurance Policy Comprehensive Guide
The slide carries the graph highlighting total revenue in the past five years to measure the success rate of a business. The slide highlights an increase in business revenue earned from various services such as auto insurance, investment planning services, etc. Present the topic in a bit more detail with this Stats Highlighting Total Revenues Of Insurance Company Auto Insurance Policy Comprehensive Guide Use it as a tool for discussion and navigation on Total Revenues, Business Revenue, Insurance Company This template is free to edit as deemed fit for your organization. Therefore download it now.
-
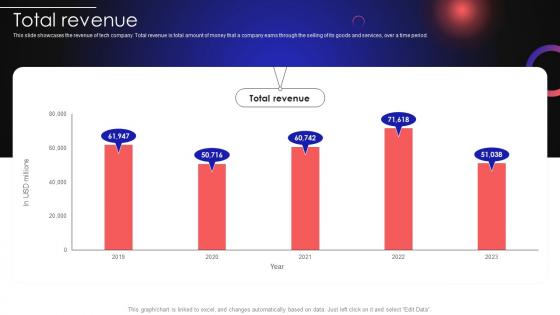 Tech Company Profile Total Revenue Ppt Graphics CP SS
This slide showcases the revenue of tech company. Total revenue is total amount of money that a company earns through the selling of its goods and services, over a time period. Present the topic in a bit more detail with this Tech Company Profile Total Revenue Ppt Graphics CP SS. Use it as a tool for discussion and navigation on Total Revenue. This template is free to edit as deemed fit for your organization. Therefore download it now.
-
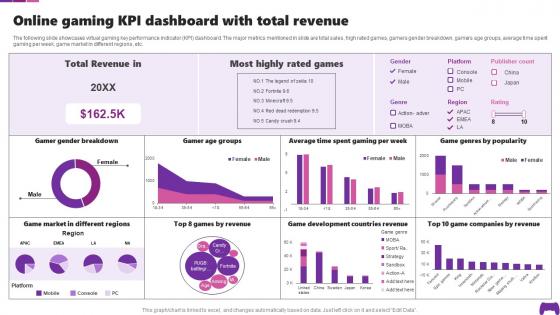 Online Gaming KPI Dashboard With Total Revenue Transforming Future Of Gaming IoT SS
The following slide showcases virtual gaming key performance indicator KPI dashboard. The major metrics mentioned in slide are total sales, high rated games, gamers gender breakdown, gamers age groups, average time spent gaming per week, game market in different regions, etc. Present the topic in a bit more detail with this Online Gaming KPI Dashboard With Total Revenue Transforming Future Of Gaming IoT SS. Use it as a tool for discussion and navigation on Gamer Age Groups, Game Development Countries Revenue. This template is free to edit as deemed fit for your organization. Therefore download it now.
-
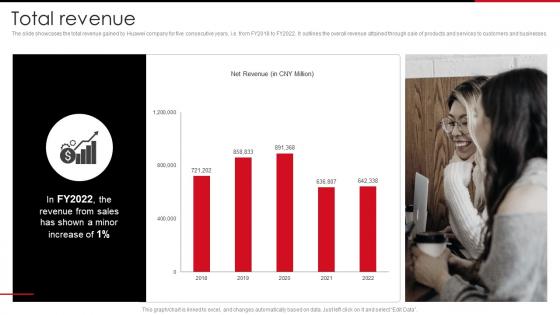 Total Revenue Huawei Company Profile CP SS
The slide showcases the total revenue gained by Huawei company for five consecutive years, i.e. from FY2018 to FY2022. It outlines the overall revenue attained through sale of products and services to customers and businesses. Deliver an outstanding presentation on the topic using this Total Revenue Huawei Company Profile CP SS. Dispense information and present a thorough explanation of Revenue, Consecutive, Products using the slides given. This template can be altered and personalized to fit your needs. It is also available for immediate download. So grab it now.
-
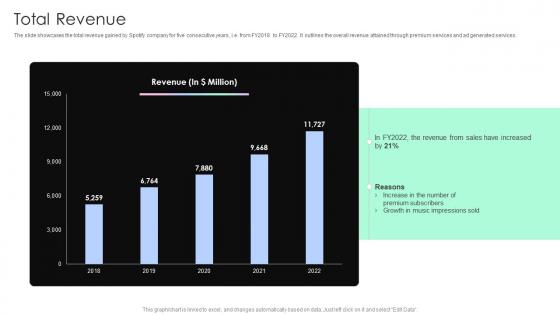 Total Revenue Music And Entertainment Company Profile CP SS V
The slide showcases the total revenue gained by Spotify company for five consecutive years, i.e. from FY2018 to FY2022. It outlines the overall revenue attained through premium services and ad generated services. Deliver an outstanding presentation on the topic using this Total Revenue Music And Entertainment Company Profile CP SS V. Dispense information and present a thorough explanation of Sales, Revenue, Premium Subscribers using the slides given. This template can be altered and personalized to fit your needs. It is also available for immediate download. So grab it now.
-
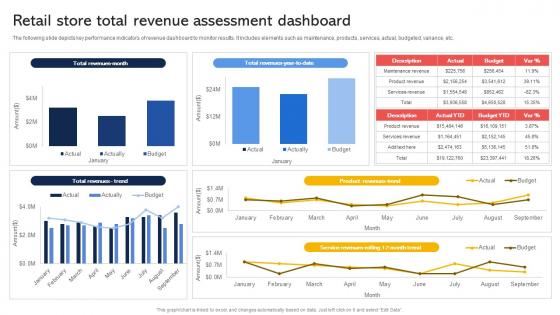 Retail Store Total Revenue Assessment Dashboard Effective Revenue Optimization Strategy SS
The following slide depicts key performance indicators of revenue dashboard to monitor results. It includes elements such as maintenance, products, services, actual, budgeted, variance, etc. Present the topic in a bit more detail with this Retail Store Total Revenue Assessment Dashboard Effective Revenue Optimization Strategy SS. Use it as a tool for discussion and navigation on Retail Store, Revenue Assessment Dashboard. This template is free to edit as deemed fit for your organization. Therefore download it now.
-
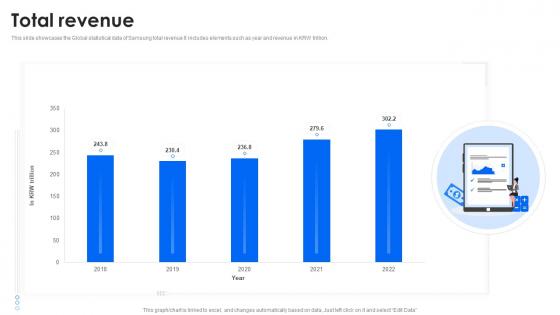 Total Revenue Samsung Company Profile CP SS
This slide showcases the Global statistical data of Samsung total revenue It includes elements such as year and revenue in KRW trillion. Deliver an outstanding presentation on the topic using this Total Revenue Samsung Company Profile CP SS Dispense information and present a thorough explanation of Total Revenue using the slides given. This template can be altered and personalized to fit your needs. It is also available for immediate download. So grab it now.
-
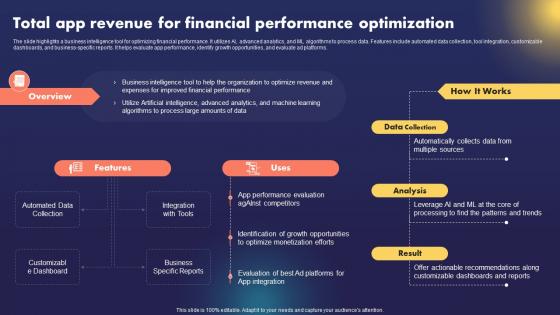 Data AI Artificial Intelligence Total App Revenue For Financial Performance Optimization AI SS
The slide highlights a business intelligence tool for optimizing financial performance. It utilizes AI, advanced analytics, and ML algorithms to process data. Features include automated data collection, tool integration, customizable dashboards, and business-specific reports. It helps evaluate app performance, identify growth opportunities, and evaluate ad platforms. Increase audience engagement and knowledge by dispensing information using Data AI Artificial Intelligence Total App Revenue For Financial Performance Optimization AI SS. This template helps you present information on three stages. You can also present information on Data Collection, Analysis, Actionable Recommendations, Customizable Dashboards And Reports using this PPT design. This layout is completely editable so personaize it now to meet your audiences expectations.
-
 Total Operating Revenue In Powerpoint And Google Slides Cpb
Presenting Total Operating Revenue In Powerpoint And Google Slides Cpb slide which is completely adaptable. The graphics in this PowerPoint slide showcase Three stages that will help you succinctly convey the information. In addition, you can alternate the color, font size, font type, and shapes of this PPT layout according to your content. This PPT presentation can be accessed with Google Slides and is available in both standard screen and widescreen aspect ratios. It is also a useful set to elucidate topics like Total Operating Revenue This well-structured design can be downloaded in different formats like PDF, JPG, and PNG. So, without any delay, click on the download button now.
-
 Total Revenue Accounting In Powerpoint And Google Slides Cpb
Presenting Total Revenue Accounting In Powerpoint And Google Slides Cpb slide which is completely adaptable. The graphics in this PowerPoint slide showcase six stages that will help you succinctly convey the information. In addition, you can alternate the color, font size, font type, and shapes of this PPT layout according to your content. This PPT presentation can be accessed with Google Slides and is available in both standard screen and widescreen aspect ratios. It is also a useful set to elucidate topics like Total Revenue Accounting. This well structured design can be downloaded in different formats like PDF, JPG, and PNG. So, without any delay, click on the download button now.
-
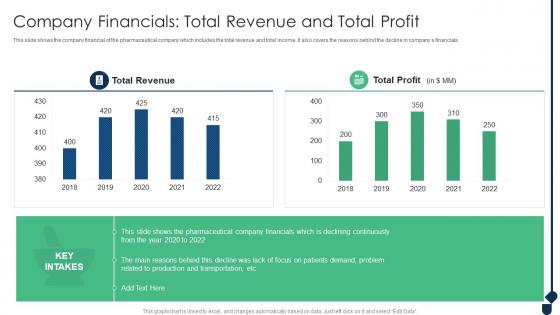 Company Financials Total Revenue And Total Profit Achieving Sustainability Evolving
This slide shows the company financial of the pharmaceutical company which includes the total revenue and total income. It also covers the reasons behind the decline in companys financials Present the topic in a bit more detail with this Company Financials Total Revenue And Total Profit Achieving Sustainability Evolving. Use it as a tool for discussion and navigation on Company Financials Total Revenue And Total Profit. This template is free to edit as deemed fit for your organization. Therefore download it now.
-
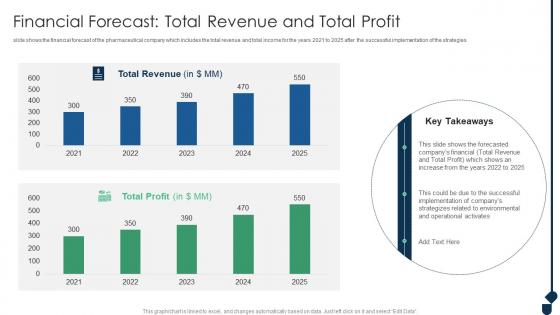 Financial Forecast Total Revenue And Total Profit Achieving Sustainability Evolving
slide shows the financial forecast of the pharmaceutical company which includes the total revenue and total income for the years 2021 to 2025 after the successful implementation of the strategies Present the topic in a bit more detail with this Financial Forecast Total Revenue And Total Profit Achieving Sustainability Evolving. Use it as a tool for discussion and navigation on Financial Forecast Total Revenue And Total Profit. This template is free to edit as deemed fit for your organization. Therefore download it now.
-
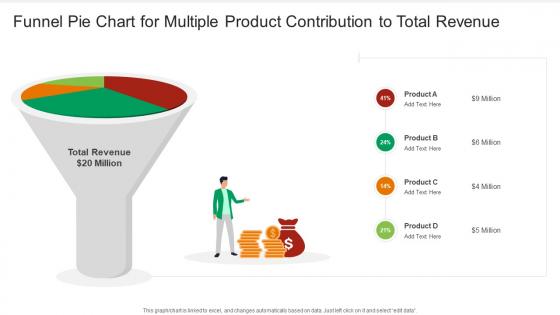 Funnel Pie Chart For Multiple Product Contribution To Total Revenue
This graph or chart is linked to excel, and changes automatically based on data. Just left click on it and select edit data. Presenting our well structured Funnel Pie Chart For Multiple Product Contribution To Total Revenue. The topics discussed in this slide are Total Revenue Dollar 20 Million, Product. This is an instantly available PowerPoint presentation that can be edited conveniently. Download it right away and captivate your audience.
-
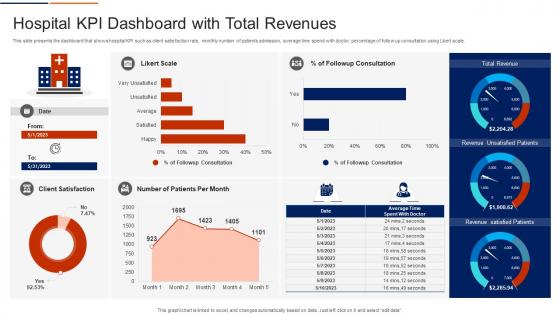 Hospital KPI Dashboard With Total Revenues
This slide presents the dashboard that shows hospital KPI such as client satisfaction rate, monthly number of patients admission, average time spend with doctor, percentage of follow up consultation using Likert scale. Introducing our Hospital KPI Dashboard With Total Revenues set of slides. The topics discussed in these slides are Likert Scale, Client Satisfaction, Sales. This is an immediately available PowerPoint presentation that can be conveniently customized. Download it and convince your audience.
-
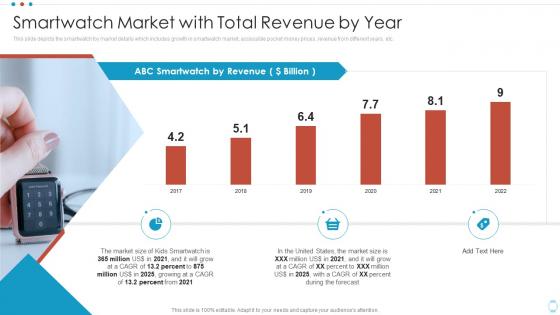 Smartwatch Market With Total Revenue By Year Smartwatch Company Pitch Deck
This slide depicts the smartwatch toy market details which includes growth in smartwatch market, accessible pocket money prices, revenue from different years, etc. Deliver an outstanding presentation on the topic using this Smartwatch Market With Total Revenue By Year Smartwatch Company Pitch Deck. Dispense information and present a thorough explanation of Smartwatch Market With Total Revenue By Year using the slides given. This template can be altered and personalized to fit your needs. It is also available for immediate download. So grab it now.
-
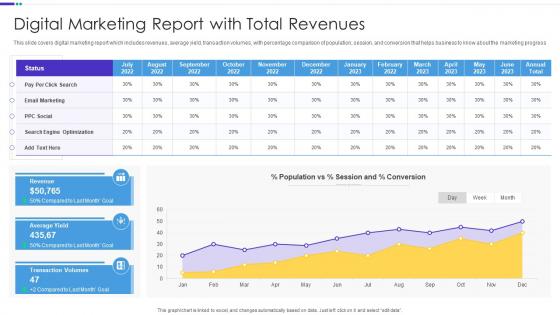 Digital Marketing Report With Total Revenues
This slide covers digital marketing report which includes revenues, average yield, transaction volumes, with percentage comparison of population, session, and conversion that helps business to know about the marketing progress. Presenting our well structured Digital Marketing Report With Total Revenues. The topics discussed in this slide are Revenue, Transaction Volumes, Email Marketing. This is an instantly available PowerPoint presentation that can be edited conveniently. Download it right away and captivate your audience.
-
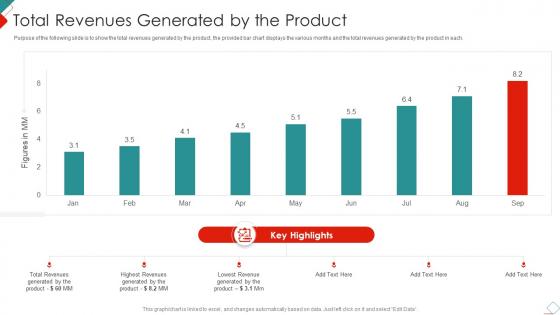 Total Revenues Generated By The Product New Commodity Market Feasibility Analysis
Purpose of the following slide is to show the total revenues generated by the product, the provided bar chart displays the various months and the total revenues generated by the product in each. Deliver an outstanding presentation on the topic using this Total Revenues Generated By The Product New Commodity Market Feasibility Analysis. Dispense information and present a thorough explanation of Total Revenues Generated By The Product using the slides given. This template can be altered and personalized to fit your needs. It is also available for immediate download. So grab it now.
-
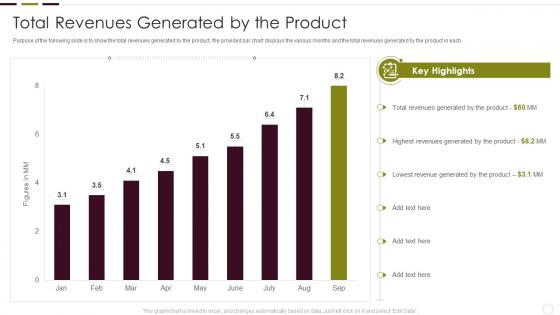 Understanding New Product Impact On Market Total Revenues Generated By The Product
Purpose of the following slide is to show the total revenues generated by the product, the provided bar chart displays the various months and the total revenues generated by the product in each. Deliver an outstanding presentation on the topic using this Understanding New Product Impact On Market Total Revenues Generated By The Product. Dispense information and present a thorough explanation of Total Revenues Generated Product, Highest Revenues Generated Product, Lowest Revenue Generated Product using the slides given. This template can be altered and personalized to fit your needs. It is also available for immediate download. So grab it now.
-
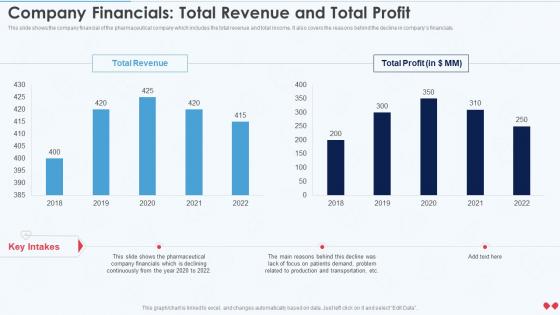 Company Financials Total Revenue And Total Profit Emerging Business Model
This slide shows the company financial of the pharmaceutical company which includes the total revenue and total income. It also covers the reasons behind the decline in companys financials. Present the topic in a bit more detail with this Company Financials Total Revenue And Total Profit Emerging Business Model. Use it as a tool for discussion and navigation on Total Revenue, Total Profit, 2018 To 2022. This template is free to edit as deemed fit for your organization. Therefore download it now.
-
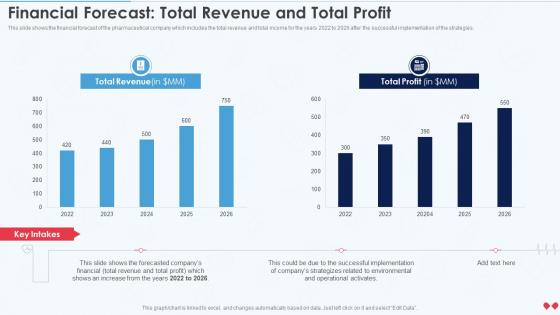 Emerging Business Model Financial Forecast Total Revenue And Total Profit
This slide shows the financial forecast of the pharmaceutical company which includes the total revenue and total income for the years 2022 to 2026 after the successful implementation of the strategies. Present the topic in a bit more detail with this Emerging Business Model Financial Forecast Total Revenue And Total Profit. Use it as a tool for discussion and navigation on Total Revenue, Total Profit, 2022 To 2026. This template is free to edit as deemed fit for your organization. Therefore download it now.
-
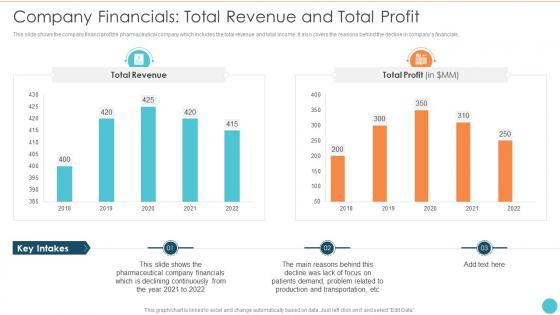 Company Financials Total Revenue And Total Sustainable Development
This slide shows the company financial of the pharmaceutical company which includes the total revenue and total income. It also covers the reasons behind the decline in companys financials. Present the topic in a bit more detail with this Company Financials Total Revenue And Total Sustainable Development. Use it as a tool for discussion and navigation on Revenue, Financials, Pharmaceutical. This template is free to edit as deemed fit for your organization. Therefore download it now.
-
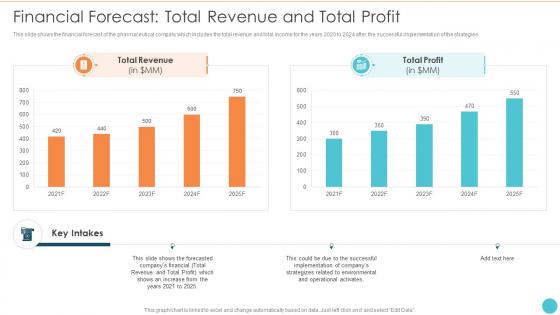 Financial Forecast Total Revenue And Total Strategies Sustainable Development
This slide shows the financial forecast of the pharmaceutical company which includes the total revenue and total income for the years 2020 to 2024 after the successful implementation of the strategies. Deliver an outstanding presentation on the topic using this Financial Forecast Total Revenue And Total Strategies Sustainable Development. Dispense information and present a thorough explanation of Financial, Forecast, Revenue using the slides given. This template can be altered and personalized to fit your needs. It is also available for immediate download. So grab it now.
-
 Total Revenues Generated By The Product Annual Product Performance Report Ppt Summary
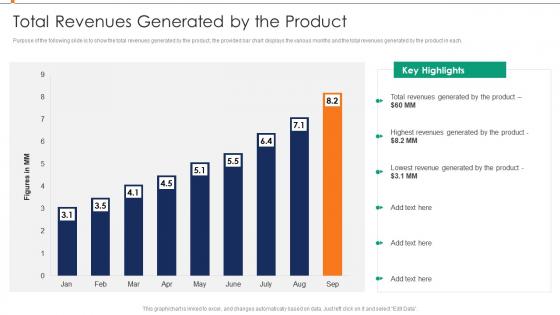
Purpose of the following slide is to show the total revenues generated by the product, the provided bar chart displays the various months and the total revenues generated by the product in each. Deliver an outstanding presentation on the topic using this Total Revenues Generated By The Product Annual Product Performance Report Ppt Summary. Dispense information and present a thorough explanation of Total Revenues Generated By The Product using the slides given. This template can be altered and personalized to fit your needs. It is also available for immediate download. So grab it now.
-
 Total Revenue Generated By Abc Medical Company Medical App Pitch Deck
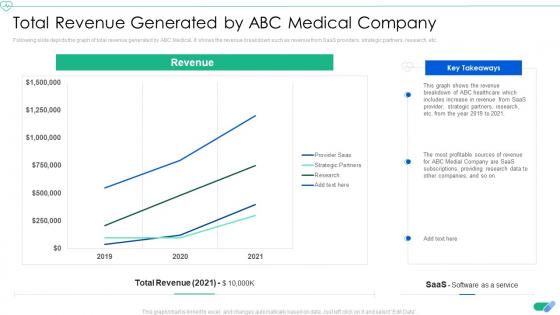
Following slide depicts the graph of total revenue generated by ABC Medical. It shows the revenue breakdown such as revenue from SaaS providers, strategic partners, research, etc. Deliver an outstanding presentation on the topic using this Total Revenue Generated By Abc Medical Company Medical App Pitch Deck. Dispense information and present a thorough explanation of Revenue, Generated, Research using the slides given. This template can be altered and personalized to fit your needs. It is also available for immediate download. So grab it now.
-
 Law Firm Company Profile Total Revenue And Headcount Ppt Pictures
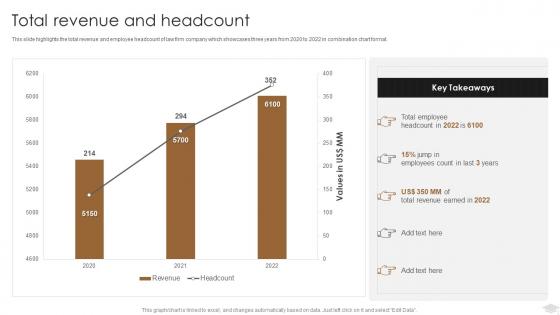
This slide highlights the total revenue and employee headcount of law firm company which showcases three years from 2020 to 2022 in combination chart format. Deliver an outstanding presentation on the topic using this Law Firm Company Profile Total Revenue And Headcount Ppt Pictures. Dispense information and present a thorough explanation of Employees Count, Total Revenue using the slides given. This template can be altered and personalized to fit your needs. It is also available for immediate download. So grab it now.
-
 Total Revenue Generated By ABC Medical Company Digital Healthcare Solution Pitch Deck
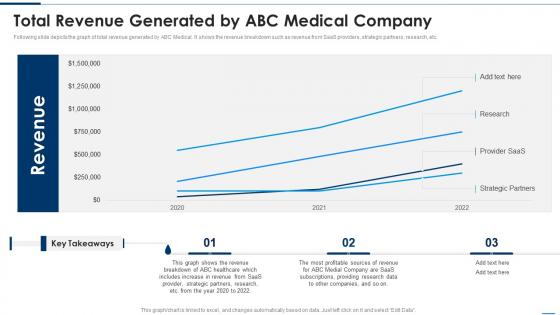
Following slide depicts the graph of total revenue generated by ABC Medical. It shows the revenue breakdown such as revenue from SaaS providers, strategic partners, research, etc.Present the topic in a bit more detail with this Total Revenue Generated By ABC Medical Company Digital Healthcare Solution Pitch Deck Use it as a tool for discussion and navigation on Includes Increase, Provider Strategic, Profitable Sources This template is free to edit as deemed fit for your organization. Therefore download it now.
-
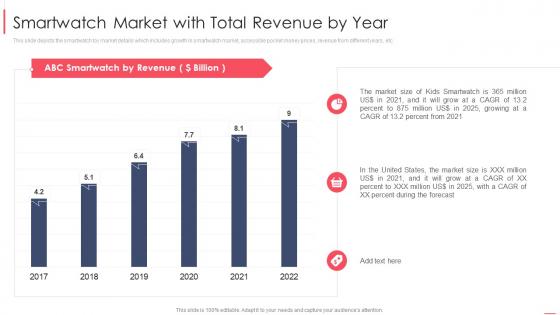 Retail sales smartwatch market with total revenue by year ppt infographics samples
This slide depicts the smartwatch toy market details which includes growth in smartwatch market, accessible pocket money prices, revenue from different years, etc. Present the topic in a bit more detail with this Retail Sales Smartwatch Market With Total Revenue By Year Ppt Infographics Samples. Use it as a tool for discussion and navigation on Smartwatch Market With Total Revenue By Year. This template is free to edit as deemed fit for your organization. Therefore download it now.
-
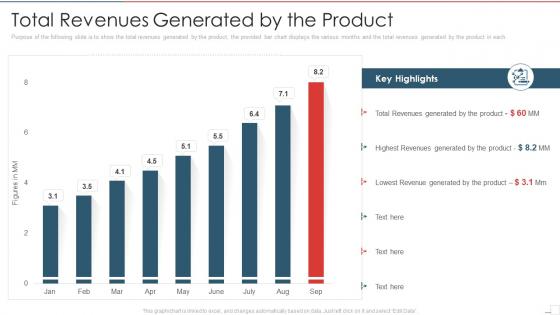 New product performance evaluation total revenues generated by the product
Purpose of the following slide is to show the total revenues generated by the product, the provided bar chart displays the various months and the total revenues generated by the product in each.Deliver an outstanding presentation on the topic using this New Product Performance Evaluation Total Revenues Generated By The Product. Dispense information and present a thorough explanation of Total Revenues Generated, Highest Revenues Generated, Lowest Revenue Generated using the slides given. This template can be altered and personalized to fit your needs. It is also available for immediate download. So grab it now.
-
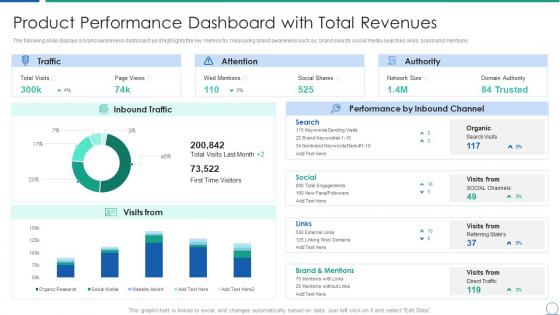 Analyzing product capabilities performance dashboard total revenues
The following slide displays a brand awareness dashboard as it highlights the key metrics for measuring brand awareness such as, brand search, social media searches, links, brand and mentions. Present the topic in a bit more detail with this Analyzing Product Capabilities Performance Dashboard Total Revenues. Use it as a tool for discussion and navigation on Traffic, Attention, Authority, Performance, Inbound Channel, Inbound Traffic. This template is free to edit as deemed fit for your organization. Therefore download it now.
-
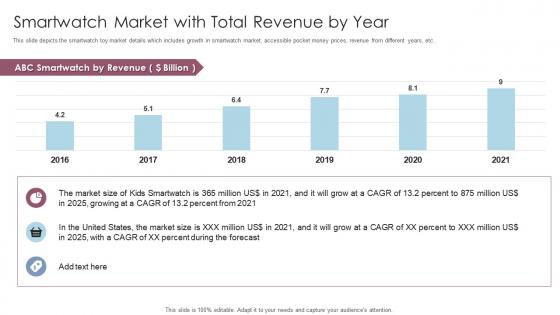 Retail smartwatch market with total revenue by year ppt powerpoint presentation professional
This slide depicts the smartwatch toy market details which includes growth in smartwatch market, accessible pocket money prices, revenue from different years, etc. Present the topic in a bit more detail with this Retail Smartwatch Market With Total Revenue By Year Ppt Powerpoint Presentation Professional. Use it as a tool for discussion and navigation on Market Size, 2016 To 2021, Smartwatch. This template is free to edit as deemed fit for your organization. Therefore download it now.
-
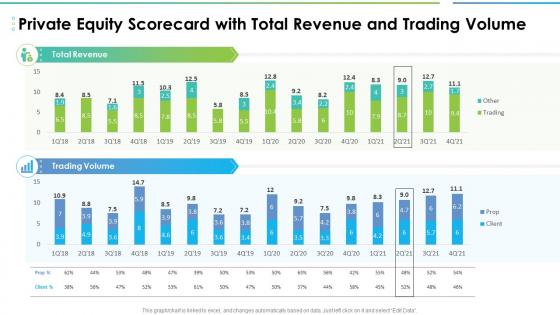 Private equity scorecard with total revenue and trading volume
Deliver an outstanding presentation on the topic using this Private Equity Scorecard With Total Revenue And Trading Volume. Dispense information and present a thorough explanation of Private Equity Scorecard With Total Revenue And Trading Volume using the slides given. This template can be altered and personalized to fit your needs. It is also available for immediate download. So grab it now.
-
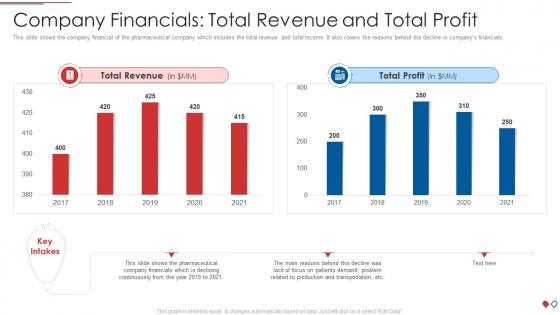 Environmental management issues pharmaceutical company financials total revenue total profit
This slide shows the company financial of the pharmaceutical company which includes the total revenue and total income. It also covers the reasons behind the decline in companys financials. Present the topic in a bit more detail with this Environmental Management Issues Pharmaceutical Company Financials Total Revenue Total Profit. Use it as a tool for discussion and navigation on Company Financials Total Revenue And Total Profit. This template is free to edit as deemed fit for your organization. Therefore download it now.
-
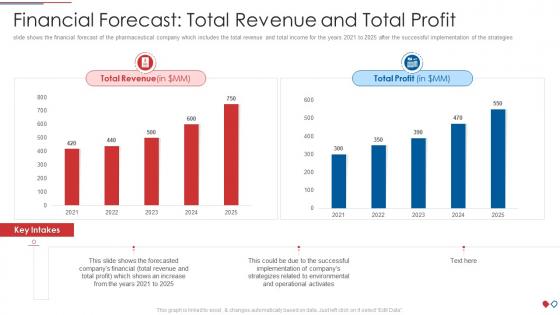 Environmental management issues pharmaceutical financial forecast total revenue and total profit
slide shows the financial forecast of the pharmaceutical company which includes the total revenue and total income for the years 2021 to 2025 after the successful implementation of the strategies Deliver an outstanding presentation on the topic using this Environmental Management Issues Pharmaceutical Financial Forecast Total Revenue And Total Profit. Dispense information and present a thorough explanation of Financial Forecast Total Revenue AND Total Profit using the slides given. This template can be altered and personalized to fit your needs. It is also available for immediate download. So grab it now.
-
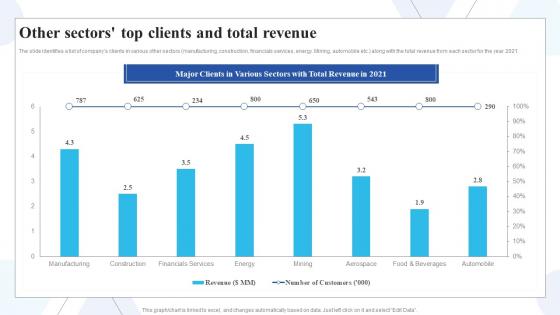 Other Sectors Top Clients And Total Revenue Buy Side Of Merger And Acquisition Ppt Gallery Aids
The slide identifies a list of companys clients in various other sectors manufacturing, construction, financials services, energy. Mining, automobile etc. along with the total revenue from each sector for the year 2021. Present the topic in a bit more detail with this Other Sectors Top Clients And Total Revenue Buy Side Of Merger And Acquisition Ppt Gallery Aids. Use it as a tool for discussion and navigation on Major Clients, Various Sectors, Revenue. This template is free to edit as deemed fit for your organization. Therefore download it now.
-
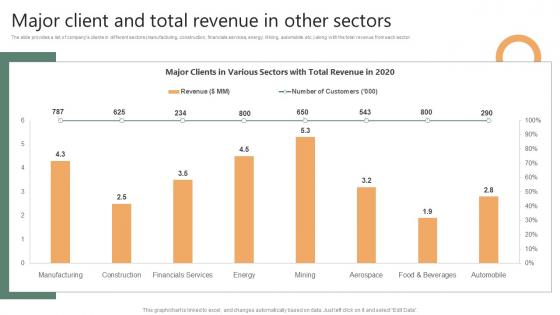 Major Client And Total Revenue In Other Sectors Financing Options Available For Startups
The slide provides a list of companys clients in different sectors manufacturing, construction, financials services, energy. Mining, automobile etc. along with the total revenue from each sector.Present the topic in a bit more detail with this Major Client And Total Revenue In Other Sectors Financing Options Available For Startups. Use it as a tool for discussion and navigation on Major Clients, Various Sectors, Total Revenue. This template is free to edit as deemed fit for your organization. Therefore download it now.
-
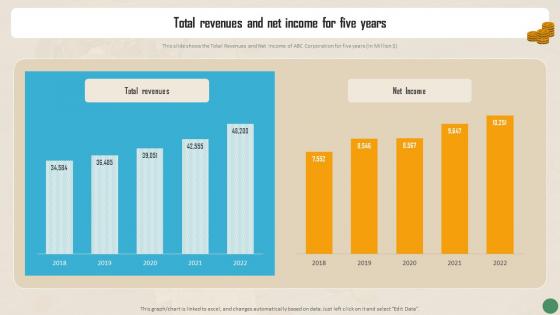 Financial Reporting To Measure The Financial Total Revenues And Net Income For Five Years
This slide shows the Total Revenues and Net Income of ABC Corporation for five years In Million dollar. Present the topic in a bit more detail with this Financial Reporting To Measure The Financial Total Revenues And Net Income For Five Years. Use it as a tool for discussion and navigation on Total Revenues, Net Income, Corporation. This template is free to edit as deemed fit for your organization. Therefore download it now.
-
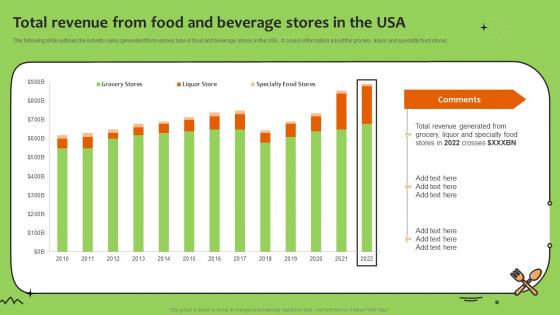 Promoting Food Using Online And Offline Marketing Total Revenue From Food And Beverage Stores Usa
The following slide outlines the industry sales generated from various type of food and beverage stores in the USA. It covers information about the grocery, liquor and specialty food stores. Deliver an outstanding presentation on the topic using this Promoting Food Using Online And Offline Marketing Total Revenue From Food And Beverage Stores Usa. Dispense information and present a thorough explanation of Revenue, Information, Beverage using the slides given. This template can be altered and personalized to fit your needs. It is also available for immediate download. So grab it now.
-
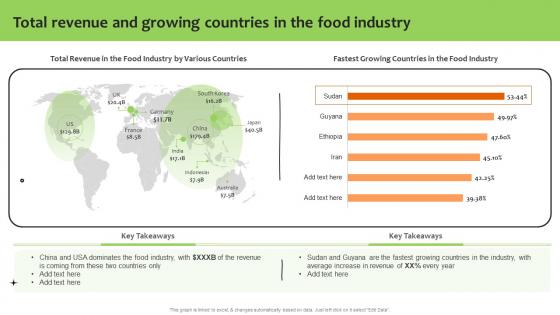 Total Revenue And Growing Countries In The Promoting Food Using Online And Offline Marketing
Deliver an outstanding presentation on the topic using this Total Revenue And Growing Countries In The Promoting Food Using Online And Offline Marketing. Dispense information and present a thorough explanation of Revenue, Growing Countries, Food Industry using the slides given. This template can be altered and personalized to fit your needs. It is also available for immediate download. So grab it now.
-
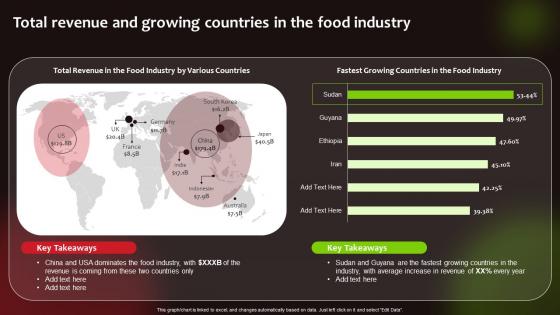 F686 Total Revenue And Growing Countries Launching New Food Product To Maximize Sales And Profit
Deliver an outstanding presentation on the topic using this F686 Total Revenue And Growing Countries Launching New Food Product To Maximize Sales And Profit. Dispense information and present a thorough explanation of Revenue, Dominates, Food Industry using the slides given. This template can be altered and personalized to fit your needs. It is also available for immediate download. So grab it now.
-
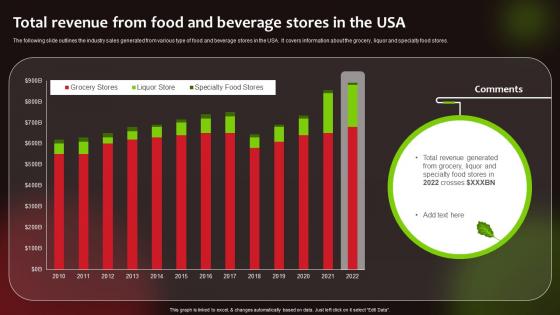 Total Revenue From Food And Beverage Usa Launching New Food Product To Maximize Sales And Profit
The following slide outlines the industry sales generated from various type of food and beverage stores in the USA. It covers information about the grocery, liquor and specialty food stores. Present the topic in a bit more detail with this Total Revenue From Food And Beverage Usa Launching New Food Product To Maximize Sales And Profit. Use it as a tool for discussion and navigation on Revenue, Information, Generated. This template is free to edit as deemed fit for your organization. Therefore download it now.
-
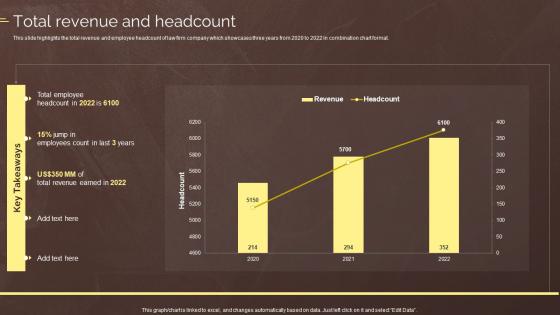 Total Revenue And Headcount Law Associates Company Profile Ppt Powerpoint Presentation File Slides
This slide highlights the total revenue and employee headcount of law firm company which showcases three years from 2020 to 2022 in combination chart format. Deliver an outstanding presentation on the topic using this Total Revenue And Headcount Law Associates Company Profile Ppt Powerpoint Presentation File Slides. Dispense information and present a thorough explanation of Total Revenue And Headcount using the slides given. This template can be altered and personalized to fit your needs. It is also available for immediate download. So grab it now.
-
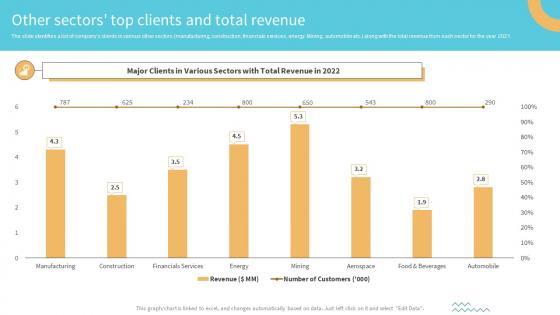 Other Sectors Top Clients And Total Revenue Buy Side M And A Investment Banking
The slide identifies a list of companys clients in various other sectors manufacturing, construction, financials services, energy. Mining, automobile etc. along with the total revenue from each sector for the year 2021. Deliver an outstanding presentation on the topic using this Other Sectors Top Clients And Total Revenue Buy Side M And A Investment Banking. Dispense information and present a thorough explanation of Clients, Total Revenue, Manufacturing, Financial Services using the slides given. This template can be altered and personalized to fit your needs. It is also available for immediate download. So grab it now.
-
 Affle India Company Profile Total Revenue Net Profit And Ebidta Ppt Summary Background Image
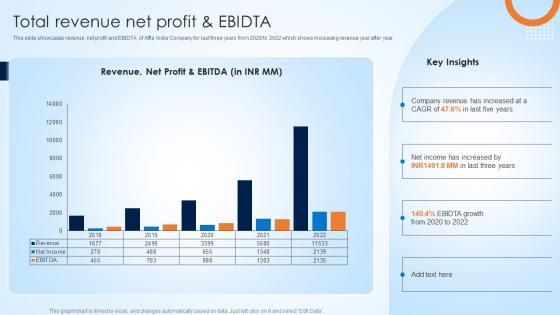
This slide showcases revenue, net profit and EBIDTA of Affle India Company for last three years from 2020 to 2022 which shows increasing revenue year after year Present the topic in a bit more detail with this Affle India Company Profile Total Revenue Net Profit And Ebidta Ppt Summary Background Image. Use it as a tool for discussion and navigation on Revenue, Growth, Net Profit. This template is free to edit as deemed fit for your organization. Therefore download it now.
-
 Other Sectors Top Clients And Total Revenue Advanced Buy Side M And A Process For Optimizing Inorganic Growth
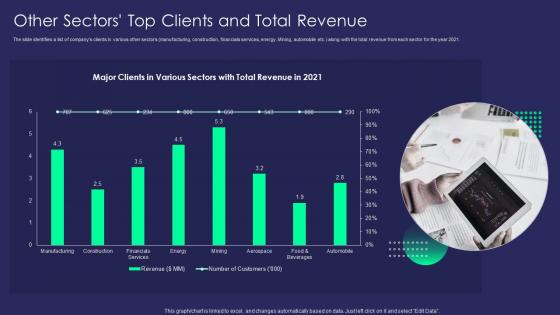
The slide identifies a list of companys clients in various other sectors manufacturing, construction, financials services, energy. Mining, automobile etc. along with the total revenue from each sector for the year 2021. Present the topic in a bit more detail with this Other Sectors Top Clients And Total Revenue Advanced Buy Side M And A Process For Optimizing Inorganic Growth. Use it as a tool for discussion and navigation on Revenue, Automobile, Construction. This template is free to edit as deemed fit for your organization. Therefore download it now.
-
 Total Revenues And Net Income For Five Years Financial Reporting To Disclose Related
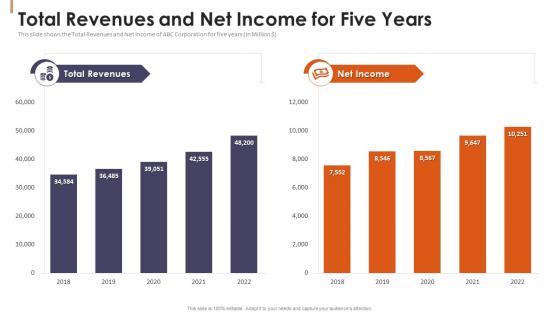
This slide shows the Total Revenues and Net Income of ABC Corporation for five years In Million doller. Present the topic in a bit more detail with this Total Revenues And Net Income For Five Years Financial Reporting To Disclose Related. Use it as a tool for discussion and navigation on Total Revenues, Net Income, Five Years. This template is free to edit as deemed fit for your organization. Therefore download it now.
-
 QBR Dashboard Indicating Total Sales And Revenue
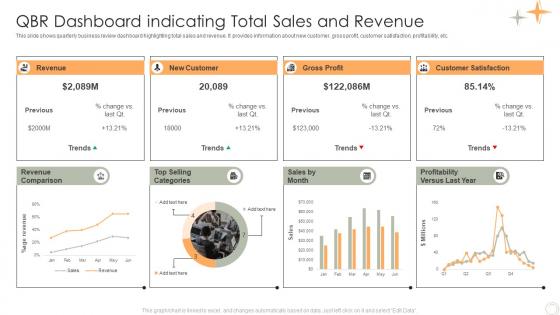
This slide shows quarterly business review dashboard highlighting total sales and revenue. It provides information about new customer, gross profit, customer satisfaction, profitability, etc. Presenting our well structured QBR Dashboard Indicating Total Sales And Revenue. The topics discussed in this slide are Revenue, New Customer, Gross Profit, Customer Satisfaction. This is an instantly available PowerPoint presentation that can be edited conveniently. Download it right away and captivate your audience.
-
 Buy Side M And A Pitch Book Other Sectors Top Clients And Total Revenue
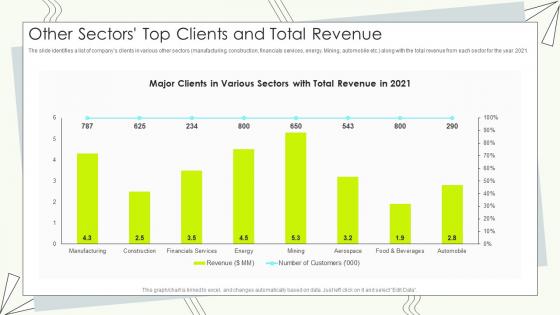
The slide identifies a list of companys clients in various other sectors manufacturing, construction, financials services, energy. Mining, automobile etc. along with the total revenue from each sector for the year 2021. Present the topic in a bit more detail with this Buy Side M And A Pitch Book Other Sectors Top Clients And Total Revenue. Use it as a tool for discussion and navigation on Revenue, Manufacturing, Construction. This template is free to edit as deemed fit for your organization. Therefore download it now.
-
 Total Revenues And Net Income For Five Years Financial Information Disclosure To The Various Stakeholders
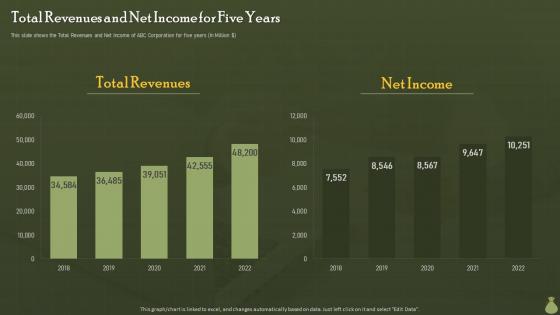
This slide shows the Total Revenues and Net Income of ABC Corporation for five years In Million dollar. Present the topic in a bit more detail with this Total Revenues And Net Income For Five Years Financial Information Disclosure To The Various Stakeholders. Use it as a tool for discussion and navigation on Total Revenues, Net Income. This template is free to edit as deemed fit for your organization. Therefore download it now.
-
 Customer Service Delivery Dashboard With Total Revenue
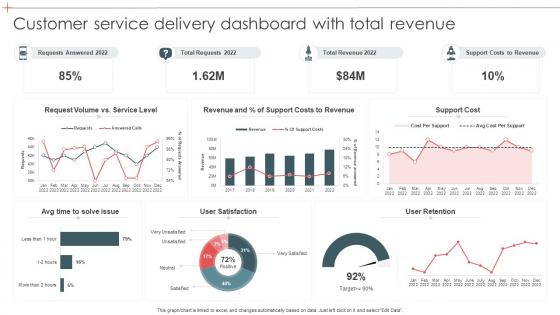
Presenting our well-structured Customer Service Delivery Dashboard With Total Revenue. The topics discussed in this slide are Customer Service Delivery, Dashboard, Total Revenue. This is an instantly available PowerPoint presentation that can be edited conveniently. Download it right away and captivate your audience.


