


Lead Pipeline Dashboard With Metric Comparison


Try Before you Buy Download Free Sample Product
 Impress Your
 Audience
Editable
of Time


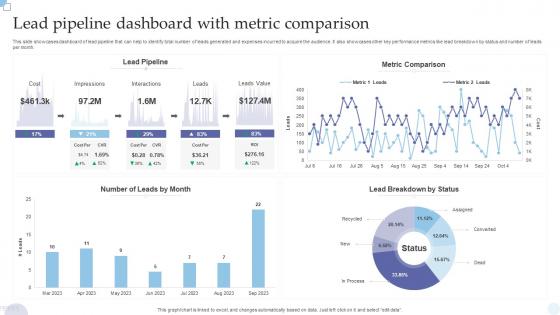
This slide showcases dashboard of lead pipeline that can help to identify total number of leads generated and expenses incurred to acquire the audience. It also showcases other key performance metrics like lead breakdown by status and number of leads per month.
This slide showcases dashboard of lead pipeline that can help to identify total number of leads generated and expenses incurred to acquire the audience. It also showcases other key performance metrics like lead breakdown by status and number of leads per month. Introducing our Lead Pipeline Dashboard With Metric Comparison set of slides. The topics discussed in these slides are Metric Comparison, Lead Pipeline. This is an immediately available PowerPoint presentation that can be conveniently customized. Download it and convince your audience.
People who downloaded this PowerPoint presentation also viewed the following :
Lead Pipeline Dashboard With Metric Comparison with all 7 slides:
Use our Lead Pipeline Dashboard With Metric Comparison to effectively help you save your valuable time. They are readymade to fit into any presentation structure.


Most Relevant Reviews
-
Based on my personal experience, I would recommend other people to subscribe to SlideTeam. No one can be disappointed here!
-
I downloaded some of the presentations for work. They were simple to modify and saved me a lot of time and effort.