Learning curve showing performance percentage attempts graph
Address intense emotions with our Learning Curve Showing Performance Percentage Attempts Graph. Ensure folks don't act immaturely.
Address intense emotions with our Learning Curve Showing Performance Percentage Attempts Graph. Ensure folks don't act imm..
- Google Slides is a new FREE Presentation software from Google.
- All our content is 100% compatible with Google Slides.
- Just download our designs, and upload them to Google Slides and they will work automatically.
- Amaze your audience with SlideTeam and Google Slides.
-
Want Changes to This PPT Slide? Check out our Presentation Design Services
- WideScreen Aspect ratio is becoming a very popular format. When you download this product, the downloaded ZIP will contain this product in both standard and widescreen format.
-

- Some older products that we have may only be in standard format, but they can easily be converted to widescreen.
- To do this, please open the SlideTeam product in Powerpoint, and go to
- Design ( On the top bar) -> Page Setup -> and select "On-screen Show (16:9)” in the drop down for "Slides Sized for".
- The slide or theme will change to widescreen, and all graphics will adjust automatically. You can similarly convert our content to any other desired screen aspect ratio.
Compatible With Google Slides

Get This In WideScreen
You must be logged in to download this presentation.
PowerPoint presentation slides
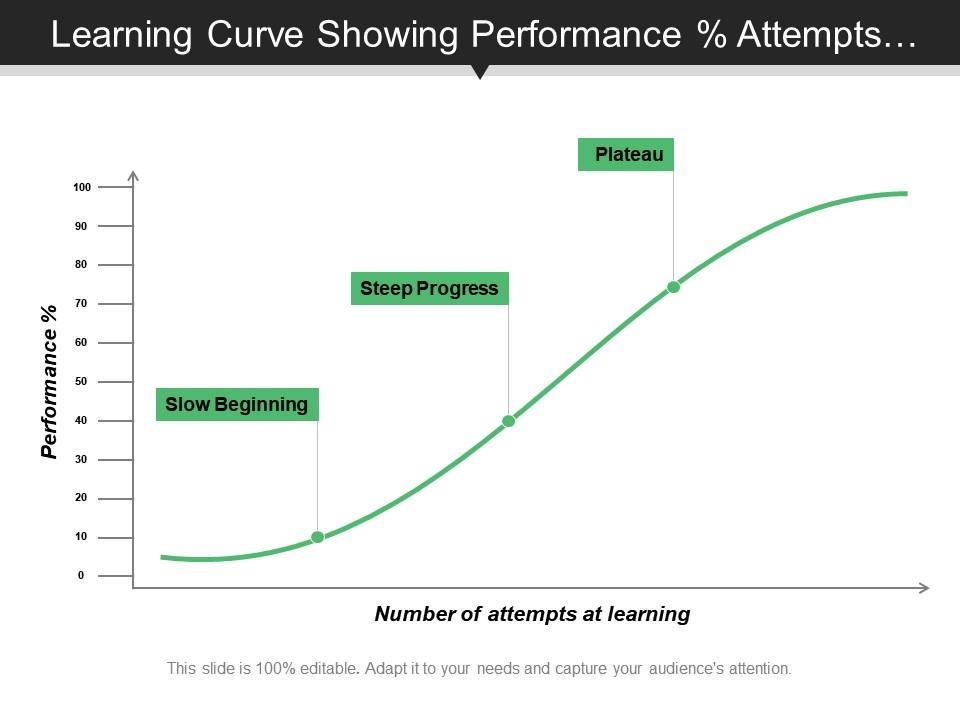
Presenting this set of slides with name - Learning Curve Showing Performance Percentage Attempts Graph. This is a three stage process. The stages in this process are Experience Curve, Learning Curve.
People who downloaded this PowerPoint presentation also viewed the following :
Content of this Powerpoint Presentation
Description:
This image is a graphical representation of a typical learning curve, illustrating how performance improves with increasing attempts at learning a particular skill or task. The X-axis shows the number of attempts at learning, while the Y-axis shows the performance percentage. The curve is segmented into three labeled phases: "Slow Beginning," "Steep Progress," and "Plateau."
Use Cases:
The learning curve visualized here serves as a versatile tool for various industries to analyze and improve learning and performance outcomes.
1. Education:
Use: Analyzing student learning progression
Presenter: Teachers or educational consultants
Audience: Students, educators, or school administrators
2. Human Resources:
Use: Training program effectiveness assessment
Presenter: HR trainers or organizational development specialists
Audience: Employees or management teams
3. Healthcare:
Use: Evaluating clinician skill acquisition over time
Presenter: Medical educators or healthcare administrators
Audience: Medical staff or health service managers
4. Sports Coaching:
Use: Monitoring athlete skill development
Presenter: Coaches or sports psychologists
Audience: Athletes or sports teams
5. Manufacturing:
Use: Assessing worker proficiency in assembly or operation
Presenter: Production managers or process engineers
Audience: Factory workers or operational staff
6. Sales Training:
Use: Tracking salesperson skills improvement
Presenter: Sales trainers or team leaders
Audience: Sales representatives or sales teams
7. Software Development:
Use: Measuring programmer learning with new technologies
Presenter: Lead developers or IT project managers
Audience: Software developers or engineering teams
Learning curve showing performance percentage attempts graph with all 5 slides:
Ensure folks don't cross the boundaries with our Learning Curve Showing Performance Percentage Attempts Graph. It helps control the intensity.
-
Easy to edit slides with easy to understand instructions.
-
Helpful product design for delivering presentation.


