


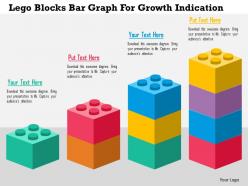
Lego blocks bar graph for growth indication flat powerpoint design


Try Before you Buy Download Free Sample Product
 Impress Your
 Audience
Editable
of Time


Blitz the opposition with our Lego Blocks Bar Graph For Growth Indication Flat Powerpoint Design. They will be completely floored.
People who downloaded this PowerPoint presentation also viewed the following :
Lego blocks bar graph for growth indication flat powerpoint design with all 5 slides:
Keep ennui at bay with our Lego Blocks Bar Graph For Growth Indication Flat Powerpoint Design. Ensure the daily grind doesn't get boring.

FAQs for Lego blocks bar graph for growth indication
Oh dude, LEGOs for bar graphs are genius! Kids actually get to build their data instead of just scribbling on worksheets. Way more engaging, obviously. The hands-on thing really works - they can stack blocks, compare heights, add more or take some away to show changes. Plus it's just fun? Like, who doesn't want to play with LEGOs during math class. Start simple though - favorite pizza toppings or whatever. Let them build it first, then they can draw the actual graph after. The whole touching and seeing thing makes it stick better in their brains.
Oh this is actually genius! Get different colored LEGO bricks and have each one represent a data point. So like, pizza gets 5 votes? Stack 5 bricks. Way better than boring paper charts, trust me. Students can physically add bricks as you collect answers, which is perfect for those kids who need to move around to learn. Try simple stuff first - favorite colors or whatever. Works great for weather tracking too, though honestly I'd probably lose half the bricks by week two. Each category gets its own color so it's super visual.
Oh this is actually brilliant! So basically you stack LEGO bricks like a bar graph - each brick is one data point. Kids love it because they're building while learning. Minifigures work perfectly for pictographs too, or just use different colored bricks for categories. For coordinate planes, grab a baseplate as your grid and plop bricks right on the points. Line graphs are trickier but doable - you connect the pieces to show trends. The cool part is kids can move stuff around and actually touch their data instead of just drawing it on paper (which let's be honest, gets boring fast). Start with something simple like surveying favorite pizza toppings.
So colors and sizes basically make your data way easier to read at a glance. Your brain just gets it instantly when different colored bricks represent different categories - no squinting at tiny legends. Bigger bricks automatically draw your eye to the larger values, which is pretty cool. I mean, LEGO beats boring spreadsheet bars any day, right? The 3D aspect really helps people understand the proportions better than flat charts ever could. Oh, and definitely use your brightest color for the most important data - it'll stand out like crazy.
Kids around 6-12 are perfect for LEGO bar graphs. The little ones (6-8) get super into building stuff and pick up basic data ideas without realizing it. Older kids can handle trickier datasets and actually get why the patterns matter. It's honestly such a clever way to teach math concepts. My nephew's 10 and he built this whole graph about his Pokemon cards last week - totally his idea. Even middle schoolers secretly love it, though they'll roll their eyes first. I'd stick with that age range if you're planning something. You'll get way better results than with younger or older kids.
Honestly, LEGO bar graphs are genius for group work. Kids have to actually work together to build and read the data - no way around it. Have different teams collect data on whatever, then build their graphs as a group. Something about those little blocks just makes everyone want to dive in, you know? Even the quiet kids usually participate more than with regular paper graphs. The whole hands-on thing gets them talking about what their results actually mean. Oh, and definitely have groups present to each other afterward - those discussions are so much better than typical math presentations where half the class zones out.
First thing - sort your data and pick a scale that works, like one brick = 10 units or whatever. Build your axes on a baseplate and label each category along the bottom. Stack bricks vertically for each data point. Honestly, I'd stick with consistent colors but mixed ones can look pretty rad if that's all you have. Just keep the spacing between bars uniform so people can actually read it. Oh, and mark your scale clearly - you don't want people squinting and trying to do math in their heads to figure out what they're looking at.
Have them explain their LEGO graphs out loud - you'll learn so much just from listening to their reasoning. Ask what predictions they can make from their data. Do they notice which bar is tallest? Can they spot patterns? Honestly, the physical manipulation makes such a difference with engagement compared to boring paper worksheets. Try having kids write questions about each other's graphs, or maybe convert their 3D creations back into regular graphs on paper. The whole point isn't whether it looks perfect - it's about hearing how they think through the data.
Check out LEGO Education's website first - they have free lesson plans for different grades that'll save you tons of time. Pinterest is where I always go though, other teachers post the best ideas there. Teachers Pay Teachers has printable data sheets too if you don't want to make your own. Scholastic's got some math activities that work LEGO into graphing stuff. Start simple - maybe "favorite pizza toppings" or something kids actually care about. Once you nail one lesson, you can basically reuse the format for everything else.
Oh totally! A document camera or your phone works great for projecting the LEGO builds live - people love watching you add blocks in real time. Stop Motion Studio is pretty cool for making time-lapse videos of your graph growing. QR codes next to each bar are clutch for extra details when people scan them. I've seen some people go crazy with Arduino sensors that place blocks automatically, but honestly that seems like way too much work for most stuff. Start with the projection thing first - it's dead simple and gets the biggest wow factor.
LEGO bricks are perfect for this! Kids can actually build their data instead of just staring at numbers on a page. When they're stacking blocks to make bar graphs, they're using their hands and eyes together - way better for learning than worksheets (which are boring anyway). The height differences become super obvious when you're physically building them. My sister's a teacher and swears by this method. Have them construct the graphs with LEGOs first, then move to paper versions. You'll be shocked how much better they get it. Something about touching and moving the pieces just clicks in their brains differently.
Oh, LEGO bar graphs are actually genius for this! Kids build the bars with different colored bricks - like survey results about favorite pizza toppings or whatever. The hands-on part is what really gets them, especially those kids who normally check out during math. They'll start comparing heights and spotting patterns without you even asking. What's cool is you can add or remove bricks when new data comes in, so they see how graphs change in real time. I'd start with something fun they can survey right away - maybe favorite Netflix shows? Trust me, they'll be way more engaged than with regular graphing worksheets.
Ugh, time management is brutal with LEGO activities - those tiny pieces vanish into thin air! Pre-sort everything into cups before class starts. Kids finish at totally different speeds too, which gets chaotic fast. I always pair struggling students with quick builders, and honestly? Fast finishers need extension activities or they'll just mess around. Building takes way longer than you think it will. The other thing - have your data collection sheets ready from the start. Otherwise kids get obsessed with building and forget they're supposed to be learning math concepts.
Dude, LEGOs are magic for this stuff. Kids literally transform from zombies into math enthusiasts when they can build their data with blocks. Something about stacking those pieces to show patterns just works - especially for kids who need to touch things to learn. I've watched reluctant students get pumped asking "can we stack these higher?" once they realize they're building their own progress. Way better than staring at boring numbers on worksheets, you know? The visual hit is instant. Start simple with two categories first - trust me, you'll see kids actually *get* what the numbers mean. It's honestly pretty cool to watch.
LEGO bar graphs are honestly a game-changer because kids actually get excited about data when there's building involved. Different colored bricks work great for categories, or you could go wild and make 3D versions instead of flat ones. I've watched kids who normally hate math get totally into it once you throw in some minifigures or tiny cars - there's something magical about that combo. The whole hands-on thing just sticks better than worksheets ever will. They're literally building their understanding piece by piece. Oh, and definitely let them pick their own themes next time - that's when the real creativity happens!
-
Enough space for editing and adding your own content.
-
Design layout is very impressive.