Levers Of It Simplification Powerpoint Presentation Slides
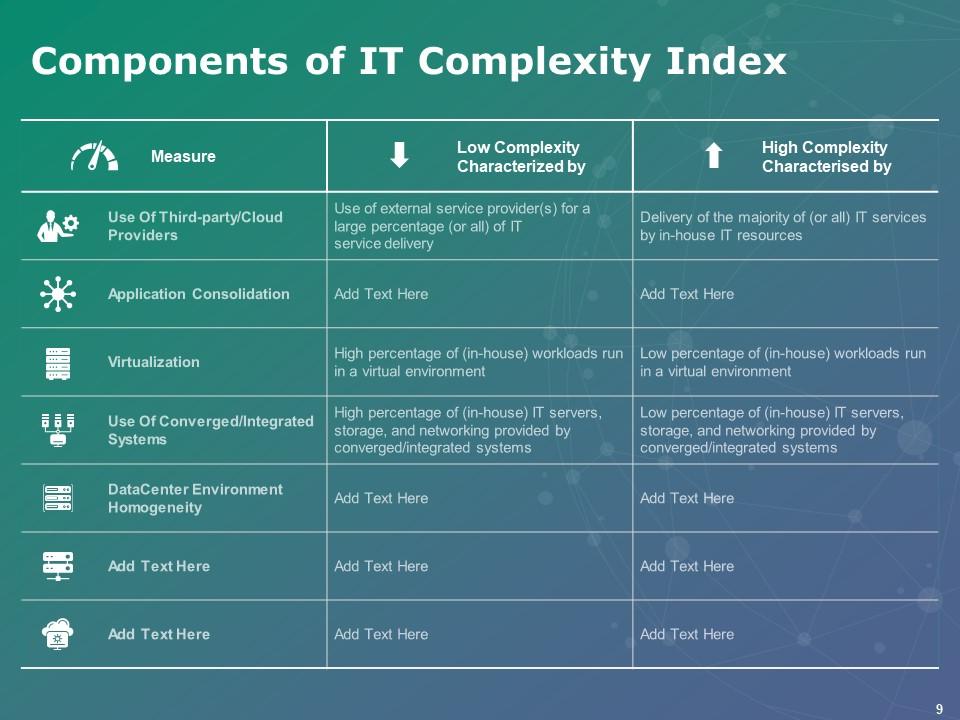
Reduce complexity in IT and business by employing Levers Of It Simplification PowerPoint Presentation Slides. Showcase how IT complexity brings challenges for the business by taking advantage of business simplification PPT visuals. Outline the IT simplification process by using the readily available work simplification process PowerPoint graphics. Take the assistance of the IT simplification PPT layouts and mention the factors leading to IT complexity such as decentralization of business, support greater business demands, etc. which leads to higher costs and lower quality. Provide the approaches to reduce complexities by utilizing our content-driven simplifying IT landscape PowerPoint slideshow. You can also represent the components of the IT complexity index with the help of the table present in the presentation. Our content ready simplifying IT presentation deck is also helpful to showcase ways of modernizing applications. Thus, download the high-quality IT simplification assessment PPT Presentation to introduce innovative IT processes.
Reduce complexity in IT and business by employing Levers Of It Simplification PowerPoint Presentation Slides. Showcase how..
- Google Slides is a new FREE Presentation software from Google.
- All our content is 100% compatible with Google Slides.
- Just download our designs, and upload them to Google Slides and they will work automatically.
- Amaze your audience with SlideTeam and Google Slides.
-
Want Changes to This PPT Slide? Check out our Presentation Design Services
- WideScreen Aspect ratio is becoming a very popular format. When you download this product, the downloaded ZIP will contain this product in both standard and widescreen format.
-

- Some older products that we have may only be in standard format, but they can easily be converted to widescreen.
- To do this, please open the SlideTeam product in Powerpoint, and go to
- Design ( On the top bar) -> Page Setup -> and select "On-screen Show (16:9)” in the drop down for "Slides Sized for".
- The slide or theme will change to widescreen, and all graphics will adjust automatically. You can similarly convert our content to any other desired screen aspect ratio.
Compatible With Google Slides

Get This In WideScreen
You must be logged in to download this presentation.
PowerPoint presentation slides
This deck consists of total of thirtythree slides. It has PPT slides highlighting important topics of Levers Of It Simplification Powerpoint Presentation Slides. This deck comprises of amazing visuals with thoroughly researched content. Each template is well crafted and designed by our PowerPoint experts. Our designers have included all the necessary PowerPoint layouts in this deck. From icons to graphs, this PPT deck has it all. The best part is that these templates are easily customizable. Just click the DOWNLOAD button shown below. Edit the colour, text, font size, add or delete the content as per the requirement. Download this deck now and engage your audience with this ready made presentation.
People who downloaded this PowerPoint presentation also viewed the following :
Content of this Powerpoint Presentation
Slide 1: This slide introduces Levers of IT Simplification. State Your Company Name and begin.
Slide 1: This slide introduces IT Simplification Framework. State Your Company Name and begin.
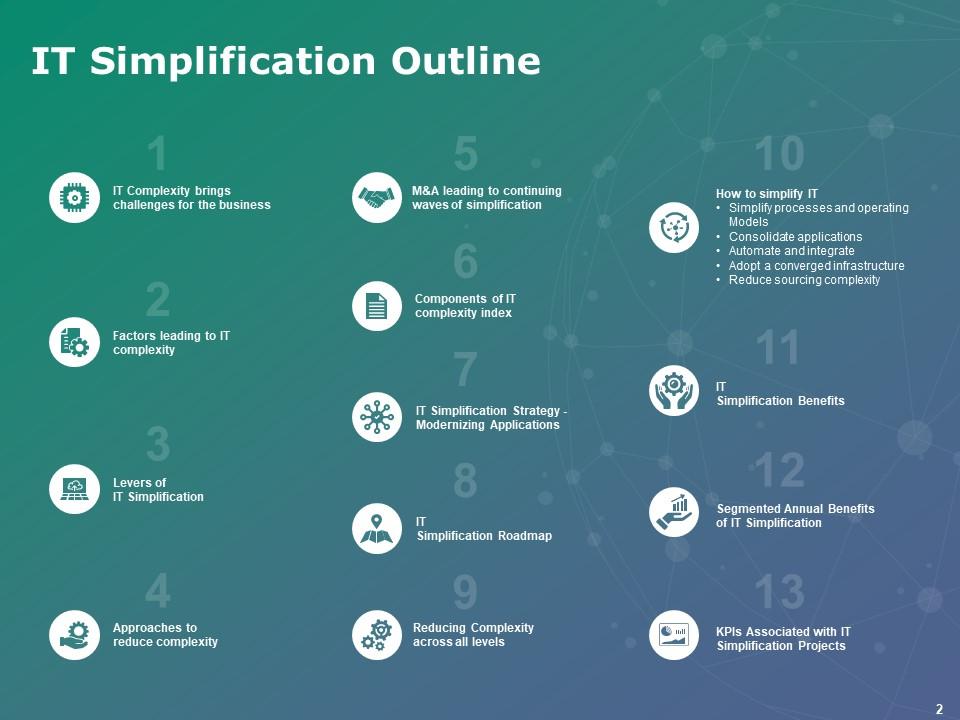
Slide 2: This slide shows IT Simplification Outline.
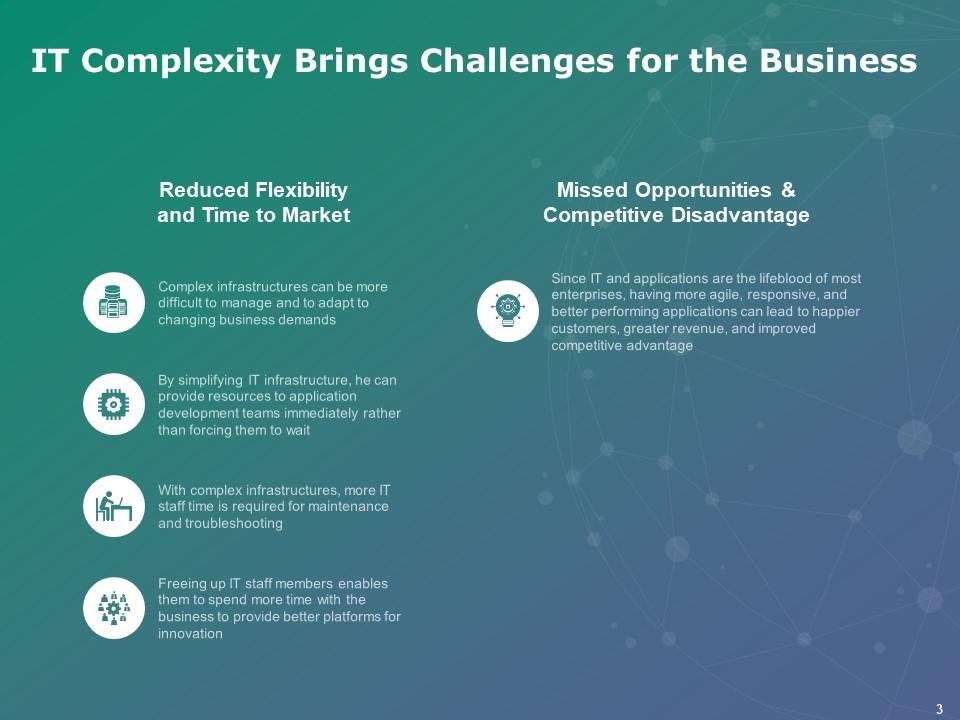
Slide 3: This slide describes IT Complexity brings Challenges for the Business.
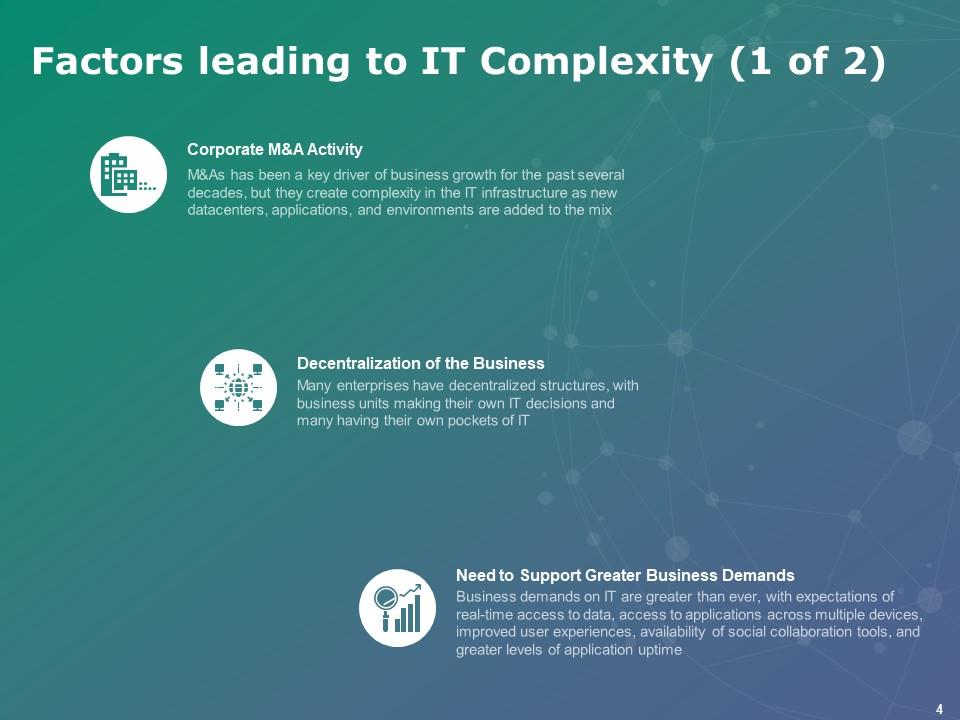
Slide 4: This slide presents Factors Leading to IT Complexity describing- Corporate M&A Activity, Decentralization of the Business, Need to Support Greater Business Demands.
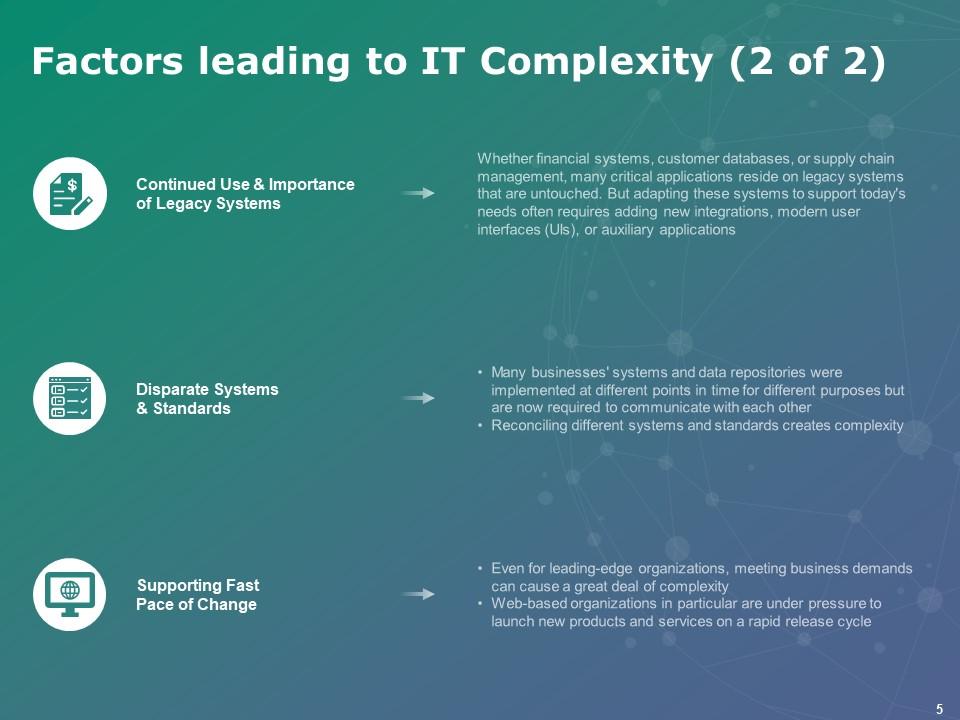
Slide 5: This is another slide showing Factors Leading to IT Complexity.
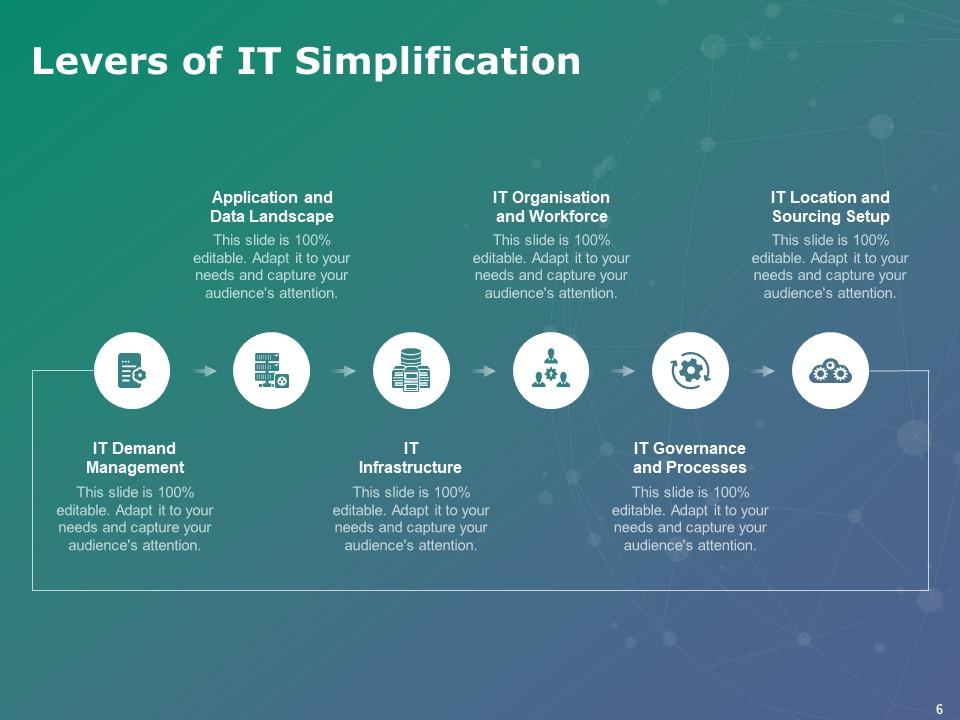
Slide 6: This slide represents Levers of IT Simplification describing- IT Location and Sourcing Setup, IT Demand Management, IT Organisation and Workforce, IT Infrastructure, IT Governance and Processes, Application and Data Landscape.
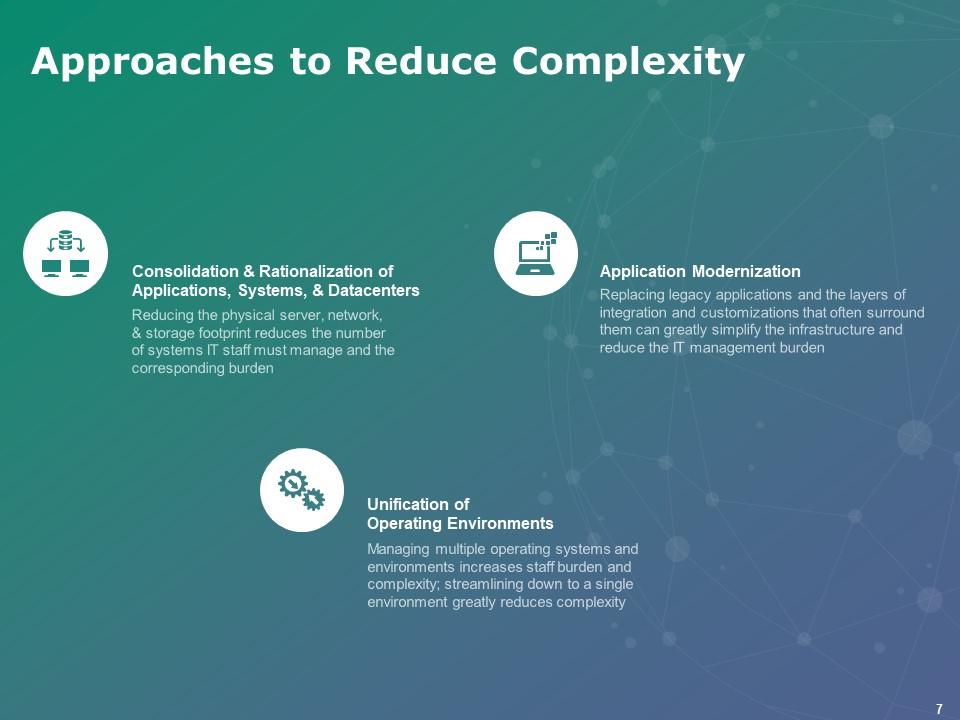
Slide 7: This slide showcases Approaches to Reduce Complexity describing- Consolidation & Rationalization of Applications, Systems, & Datacenters, Application Modernization, Unification of Operating Environments.
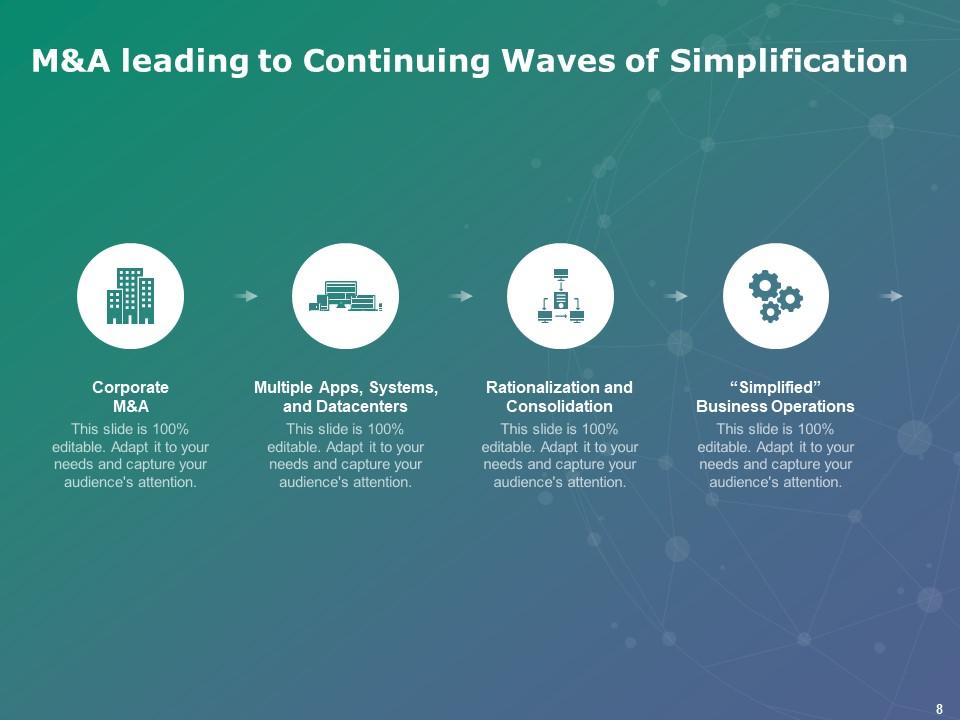
Slide 8: This slide shows M&A Leading to Continuing waves of Simplification.
Slide 9: This slide displays Components of IT Complexity Index.
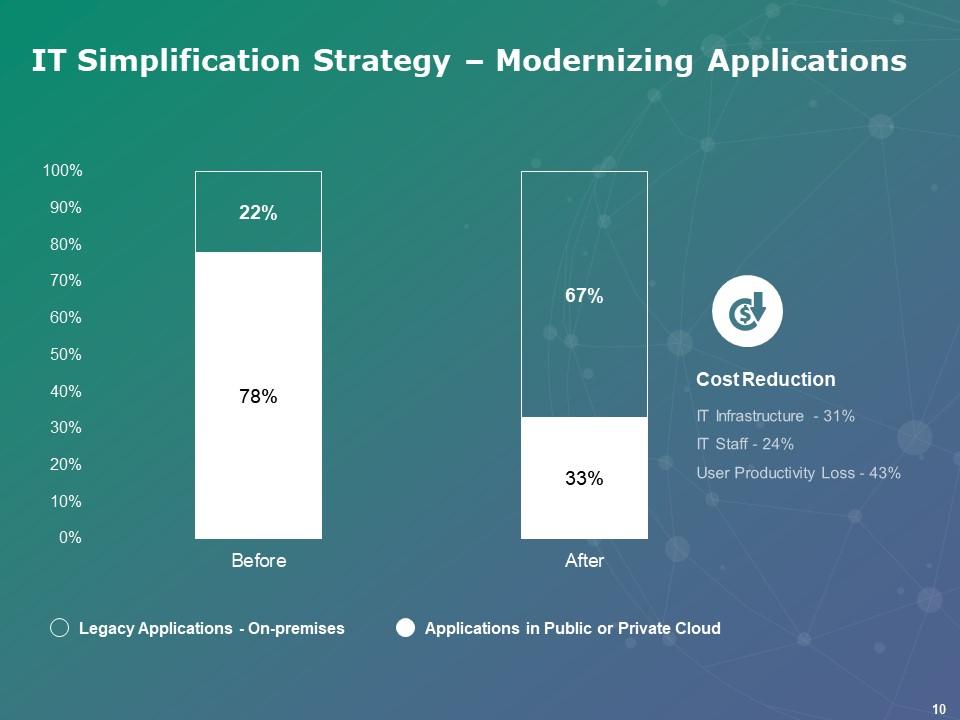
Slide 10: This slide presents IT Simplification Strategy – Modernizing Applications.
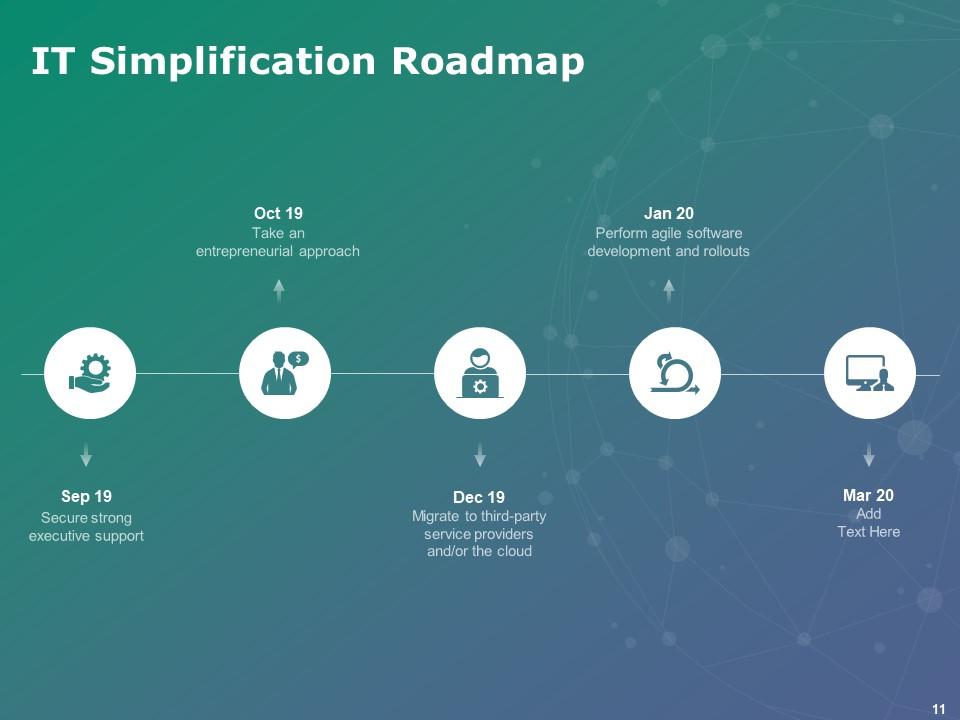
Slide 11: This slide represents IT Simplification Roadmap describing- Secure Strong Executive Support, Take an Entrepreneurial Approach, Migrate to third-party Service providers and/or the cloud, Perform agile Software Development & Rollouts.
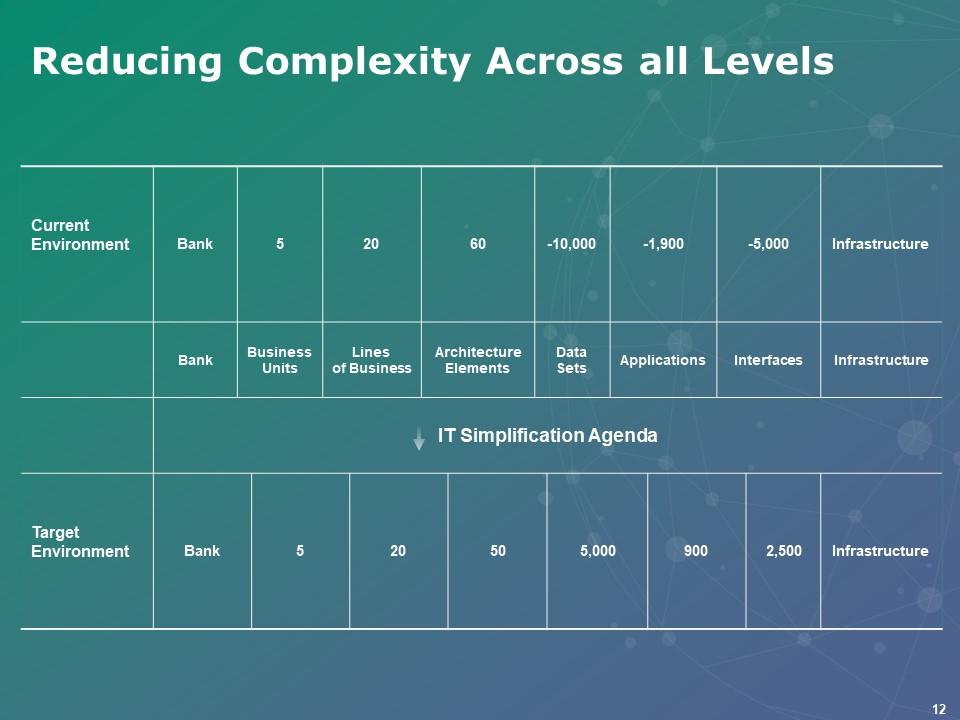
Slide 12: This slide showcases Reducing Complexity Across all Levels.
Slide 13: This slide is titled as How to Simplify IT with related imagery.
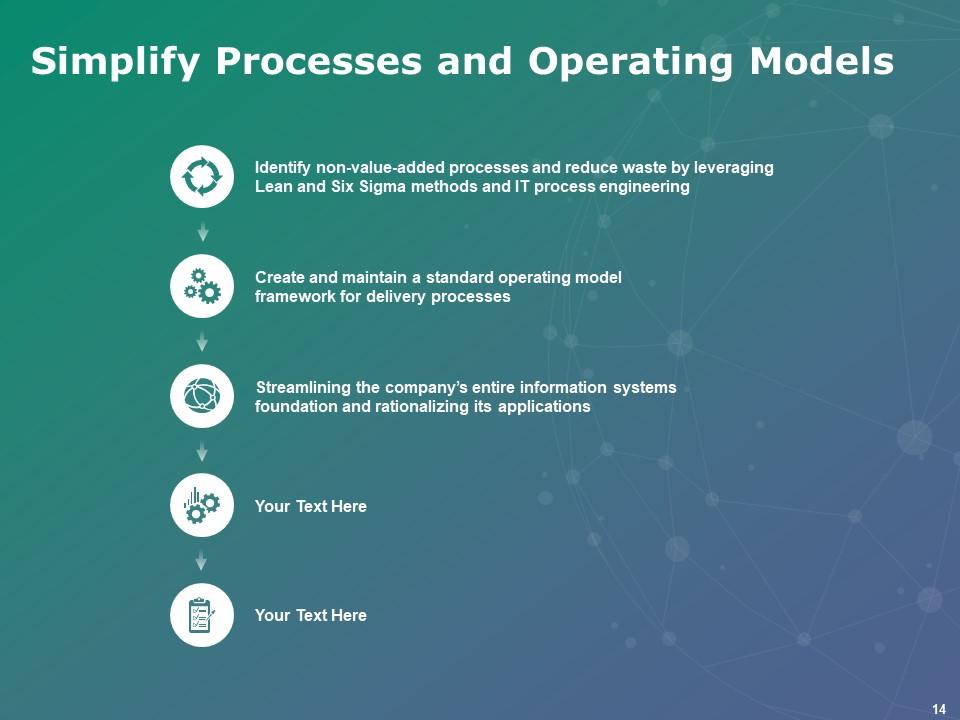
Slide 14: This slide shows Simplify Processes and Operating Models.
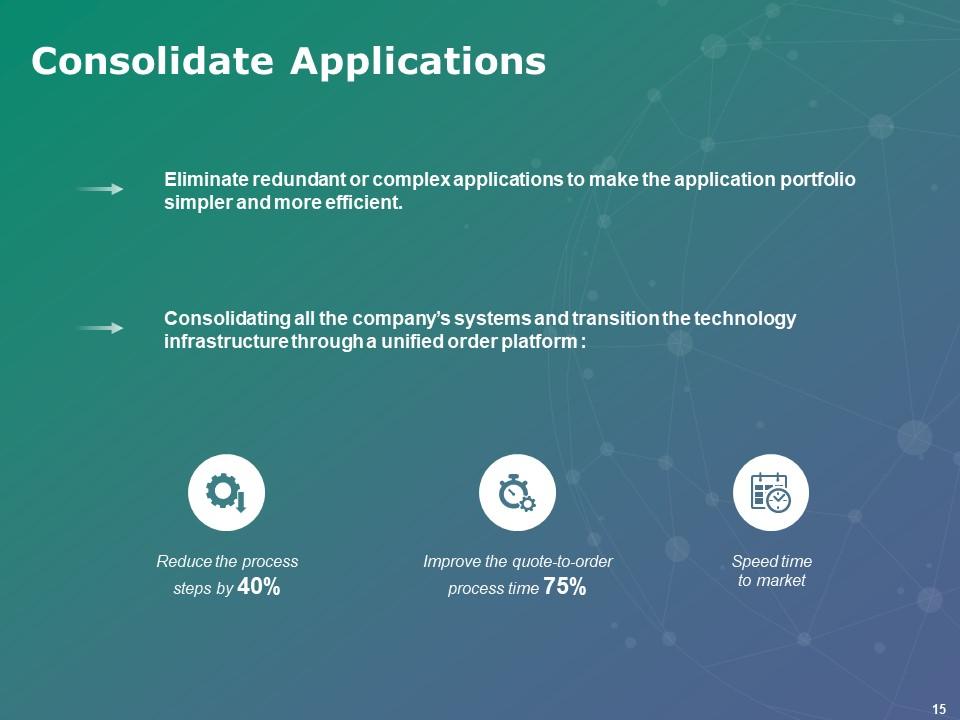
Slide 15: This slide presents Consolidate Applications with related imagery and text.
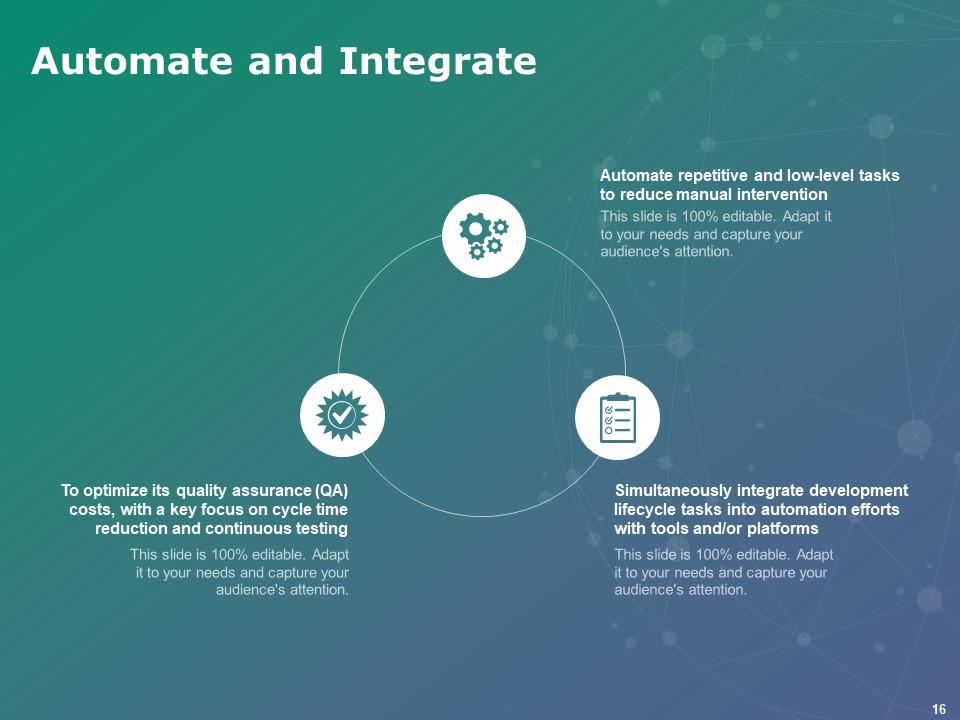
Slide 16: This slide displays Automate & Integrate describing- Automate repetitive and low-level tasks to reduce manual intervention, Simultaneously integrate development lifecycle tasks into automation efforts with tools and/or platforms, To optimize its quality assurance (QA) costs, with a key focus on cycle time reduction and continuous testing.
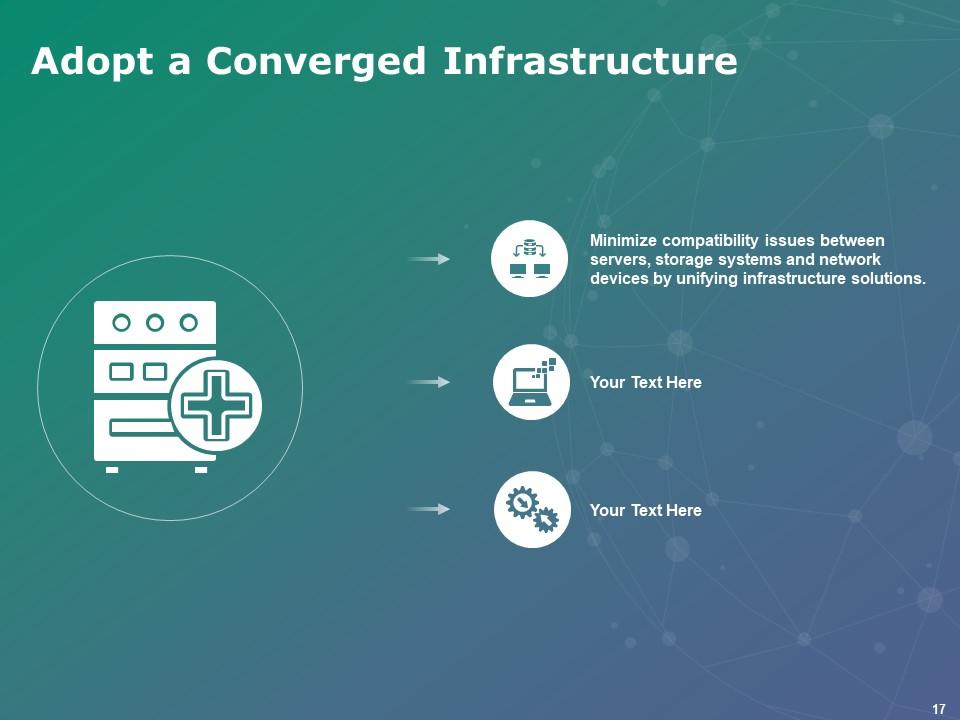
Slide 17: This slide represents Adopt a Converged Infrastructure with related imagery and icons.
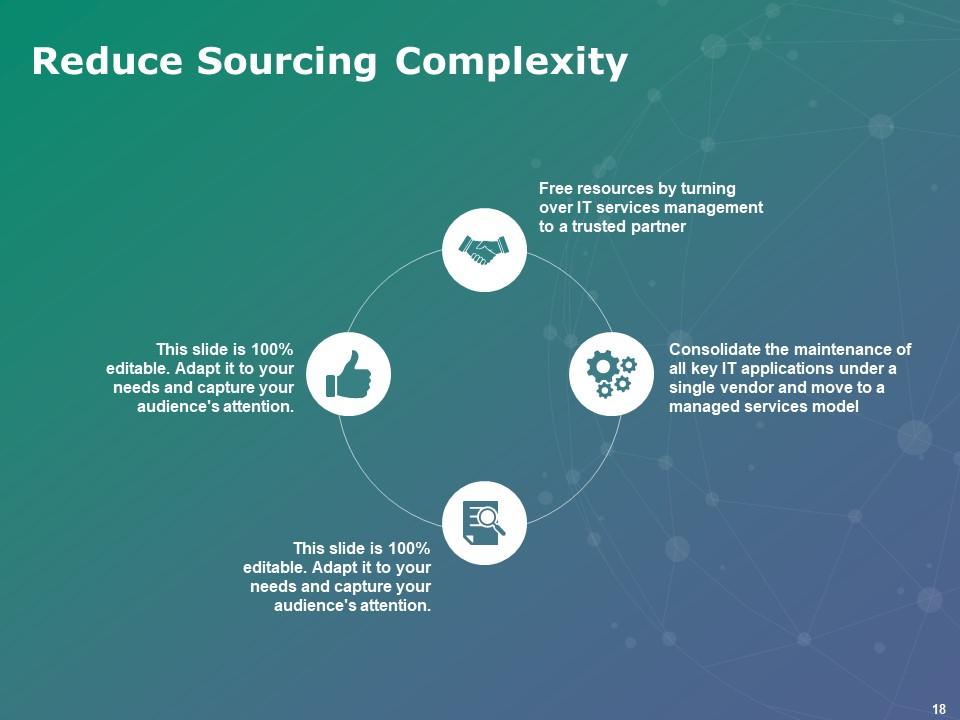
Slide 18: This slide showcases Reduce Sourcing Complexity with the help of circular diagram.
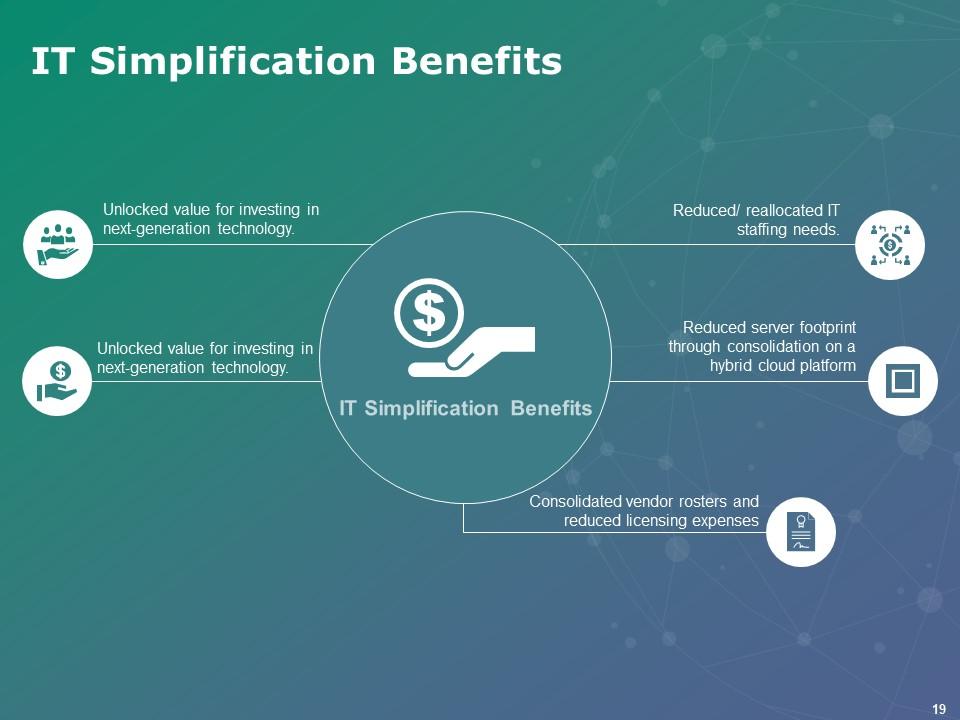
Slide 19: This slide shows IT Simplification Benefits describing- Reduced/ reallocated IT staffing needs, Reduced server footprint through consolidation on a hybrid cloud platform, Consolidated vendor rosters and reduced licensing expenses, Unlocked value for investing in next-generation technology, Unlocked value for investing in next-generation technology.
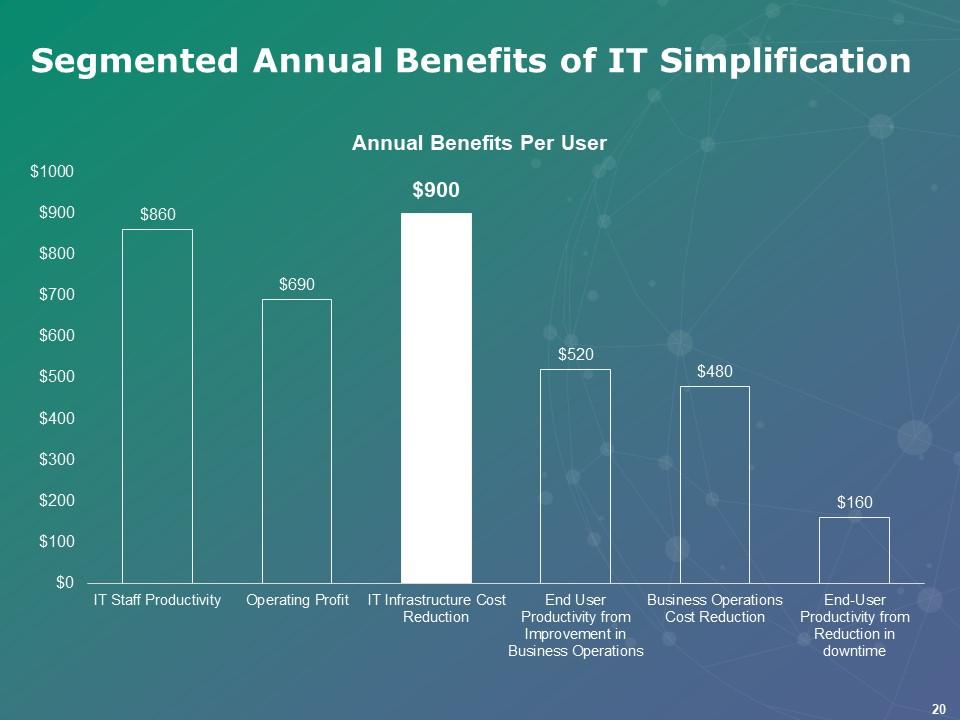
Slide 20: This slide presents Segmented Annual Benefits of IT Simplification.
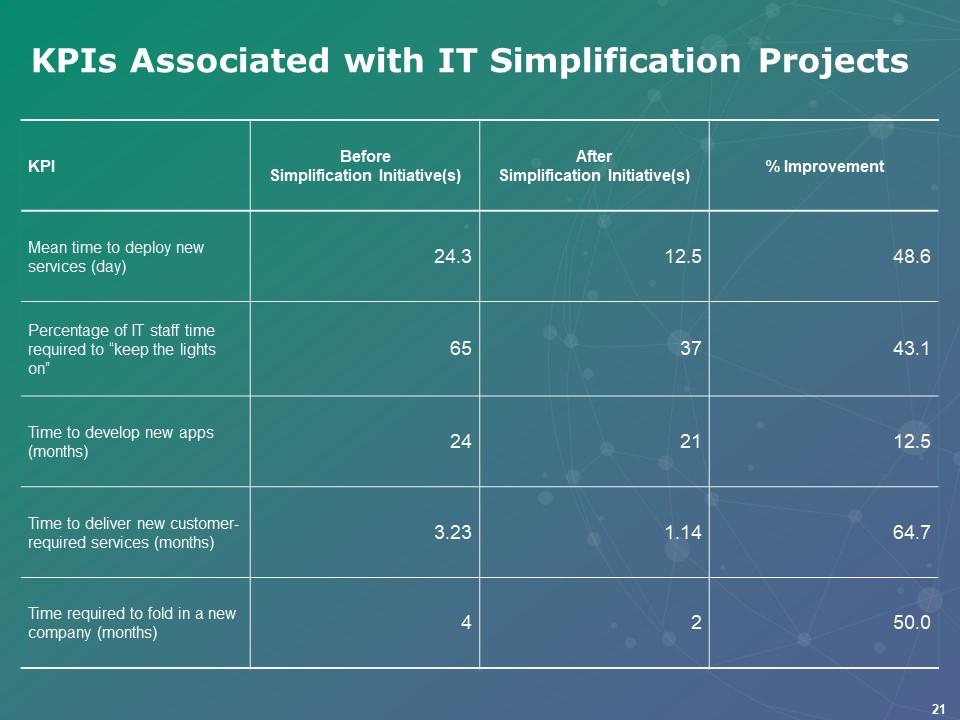
Slide 21: This slide represents KPIs associated with IT Simplification Projects.
Slide 22: This slide displays Levers of IT Simplification Icons.
Slide 23: This slide reminds about 15 minutes coffee break.
Slide 24: This slide is titled as Additional Slides for moving forward.
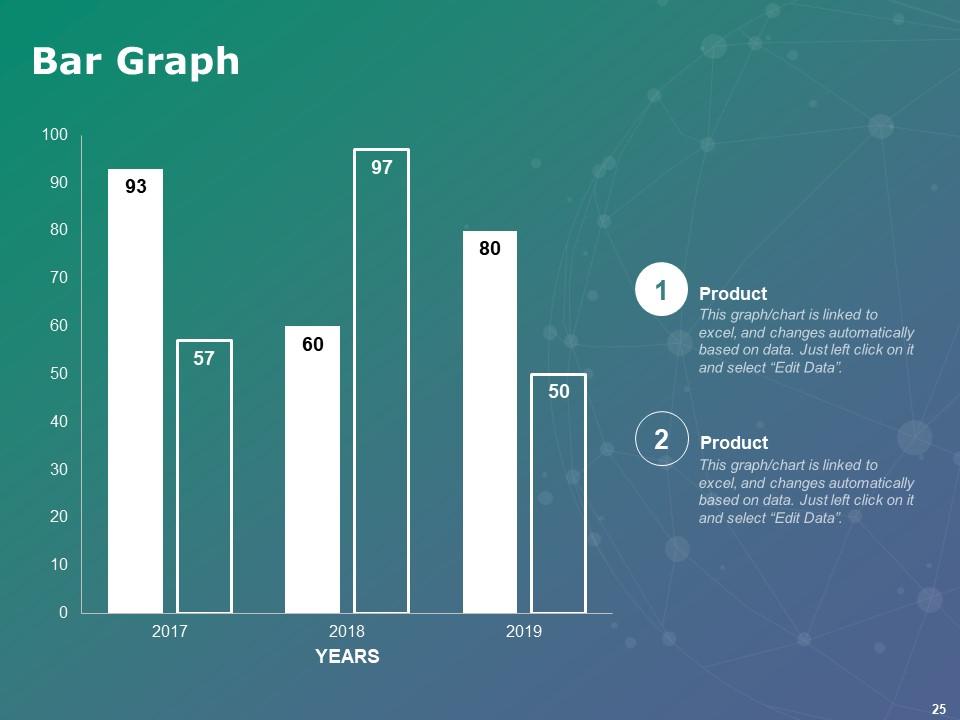
Slide 25: This slide shows Bar Graph with two products comparison.
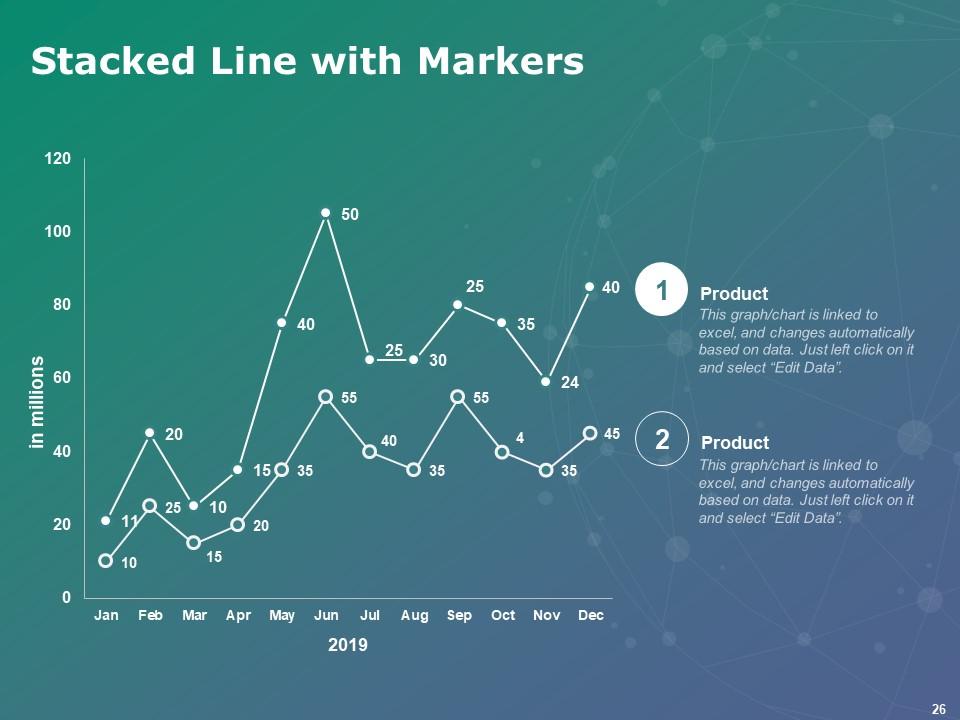
Slide 26: This slide presents Stacked Line With Markers.
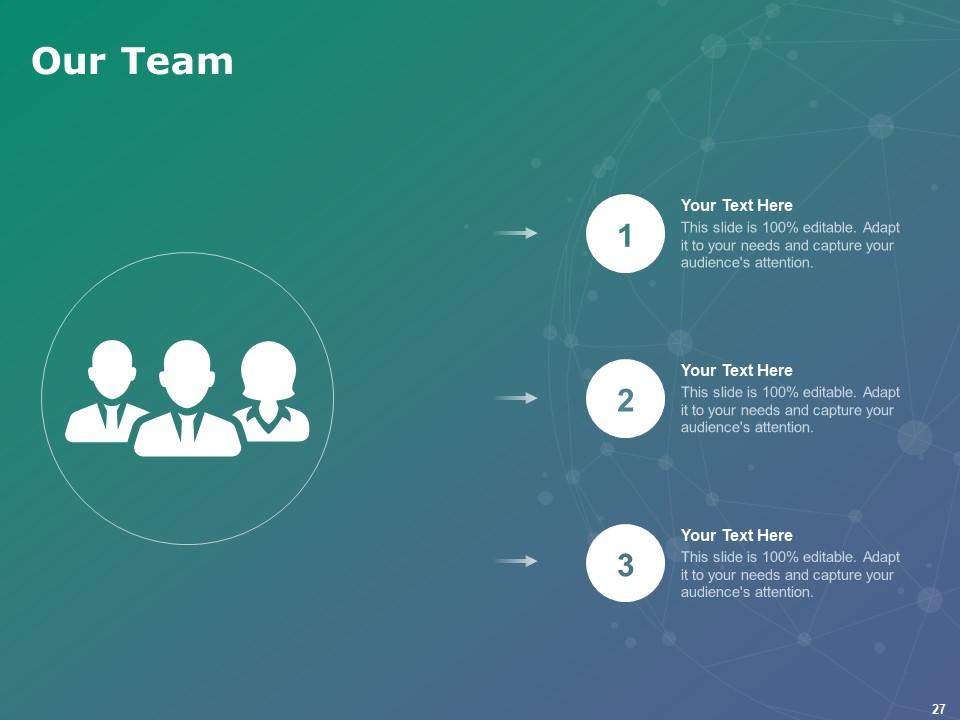
Slide 27: This is Our Team slide with names and designation.
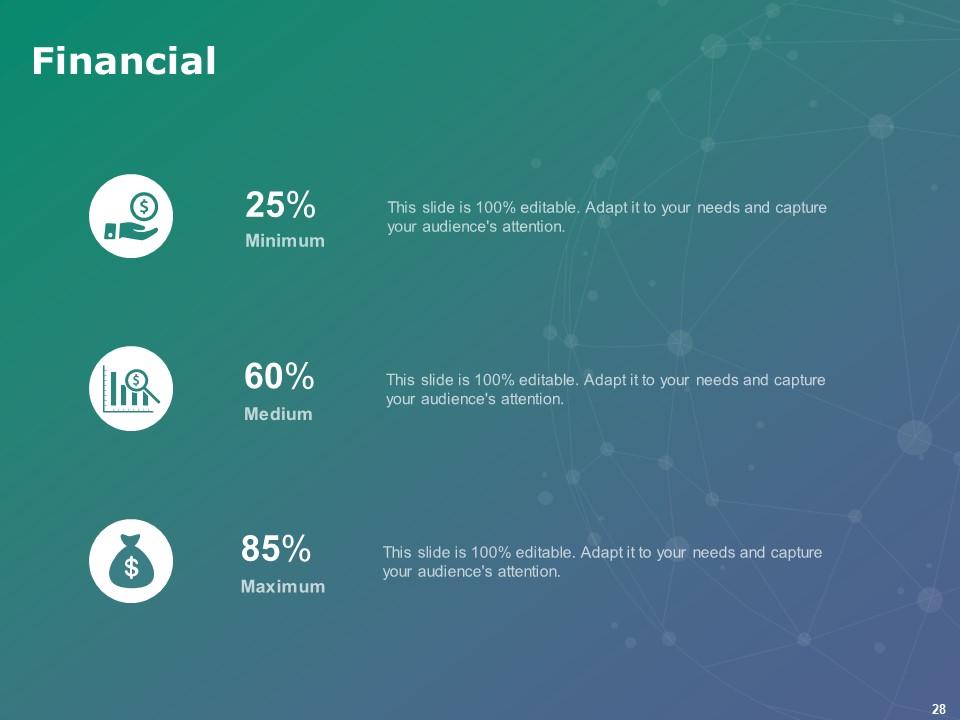
Slide 28: This is a Financial slide. Show your finance related stuff here.
Slide 29: This is an Idea Generation slide to state a new idea or highlight information, specifications etc.
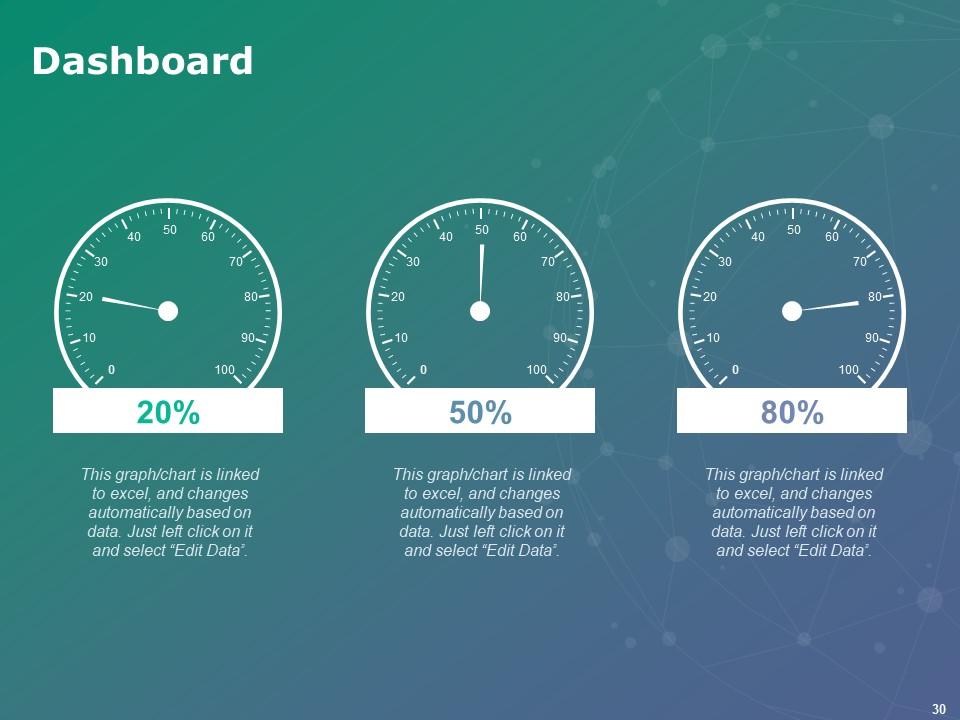
Slide 30: This is a Dashboard slide with additional text boxes.
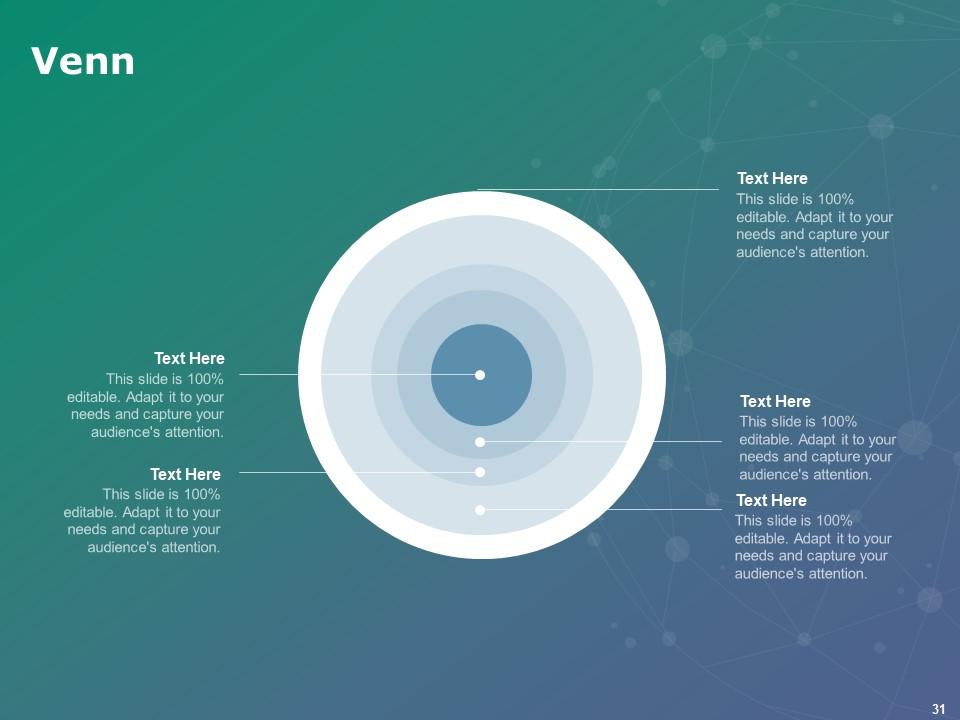
Slide 31: This is a Venn slide with text boxes to show information.
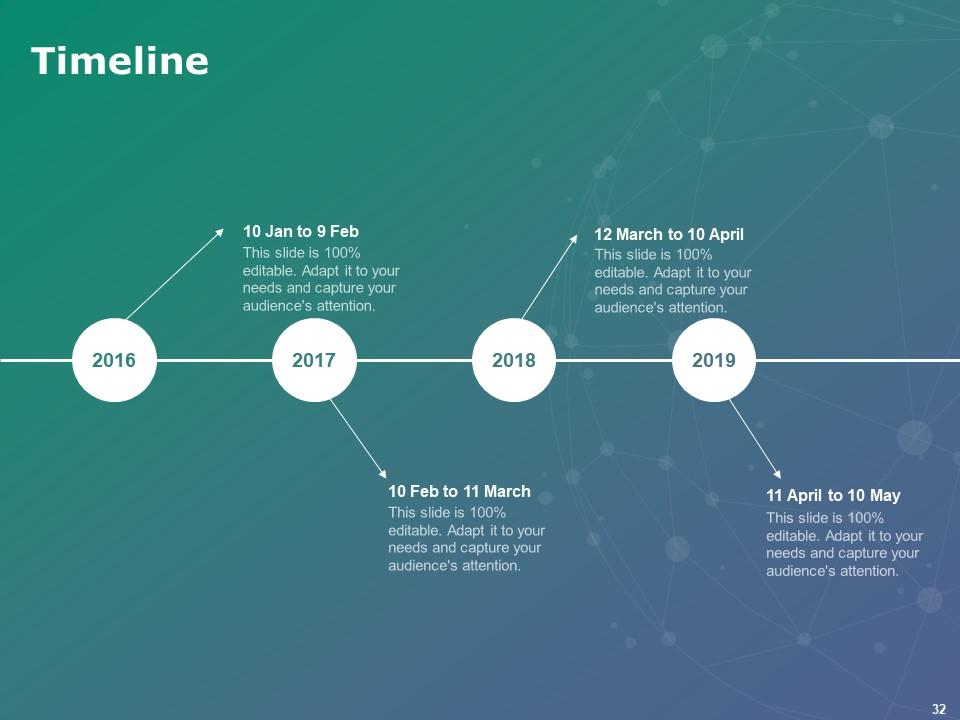
Slide 32: This is a Timeline slide to show information related with time period.
Slide 33: This is a Thank You slide with address, contact numbers and email address.
Levers Of It Simplification Powerpoint Presentation Slides with all 33 slides:
Use our Levers Of It Simplification Powerpoint Presentation Slides to effectively help you save your valuable time. They are readymade to fit into any presentation structure.
-
The content is very helpful from business point of view.
-
Visually stunning presentation, love the content.
-
Unique design & color.


