Market Graph Showing Revenue Breakdown Of FMCG Company
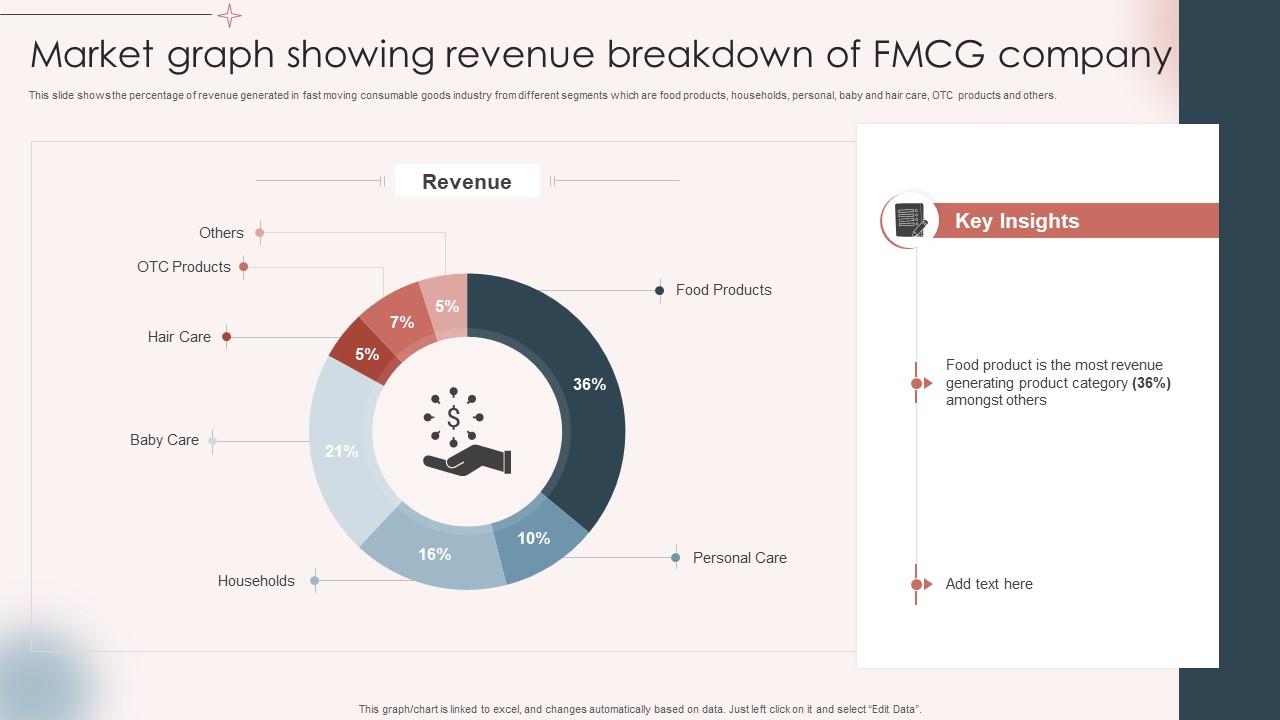
This slide shows the percentage of revenue generated in fast moving consumable goods industry from different segments which are food products, households, personal, baby and hair care, OTC products and others.
This slide shows the percentage of revenue generated in fast moving consumable goods industry from different segments which..
- Google Slides is a new FREE Presentation software from Google.
- All our content is 100% compatible with Google Slides.
- Just download our designs, and upload them to Google Slides and they will work automatically.
- Amaze your audience with SlideTeam and Google Slides.
-
Want Changes to This PPT Slide? Check out our Presentation Design Services
- WideScreen Aspect ratio is becoming a very popular format. When you download this product, the downloaded ZIP will contain this product in both standard and widescreen format.
-

- Some older products that we have may only be in standard format, but they can easily be converted to widescreen.
- To do this, please open the SlideTeam product in Powerpoint, and go to
- Design ( On the top bar) -> Page Setup -> and select "On-screen Show (16:9)” in the drop down for "Slides Sized for".
- The slide or theme will change to widescreen, and all graphics will adjust automatically. You can similarly convert our content to any other desired screen aspect ratio.
Compatible With Google Slides

Get This In WideScreen
You must be logged in to download this presentation.
PowerPoint presentation slides
This slide shows the percentage of revenue generated in fast moving consumable goods industry from different segments which are food products, households, personal, baby and hair care, OTC products and others. Introducing our Market Graph Showing Revenue Breakdown Of FMCG Company set of slides. The topics discussed in these slides are Food Product, Generating Product Category, Revenue. This is an immediately available PowerPoint presentation that can be conveniently customized. Download it and convince your audience.
People who downloaded this PowerPoint presentation also viewed the following :
Market Graph Showing Revenue Breakdown Of FMCG Company with all 7 slides:
Use our Market Graph Showing Revenue Breakdown Of FMCG Company to effectively help you save your valuable time. They are readymade to fit into any presentation structure.
-
Unique research projects to present in meeting.
-
Thanks for all your great templates they have saved me lots of time and accelerate my presentations. Great product, keep them up!


