Operating Profit And Margin Engineering Services And Consultancy Company Profile Ppt File Infographics
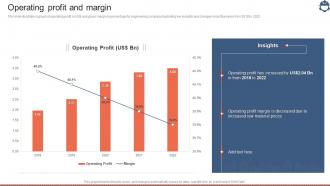
This slide illustrates a graph of operating profit in US dollar and gross margin in percentage for engineering company illustrating key insights and changes in last five years from 2018 to 2022
- Google Slides is a new FREE Presentation software from Google.
- All our content is 100% compatible with Google Slides.
- Just download our designs, and upload them to Google Slides and they will work automatically.
- Amaze your audience with SlideTeam and Google Slides.
-
Want Changes to This PPT Slide? Check out our Presentation Design Services
- WideScreen Aspect ratio is becoming a very popular format. When you download this product, the downloaded ZIP will contain this product in both standard and widescreen format.
-

- Some older products that we have may only be in standard format, but they can easily be converted to widescreen.
- To do this, please open the SlideTeam product in Powerpoint, and go to
- Design ( On the top bar) -> Page Setup -> and select "On-screen Show (16:9)” in the drop down for "Slides Sized for".
- The slide or theme will change to widescreen, and all graphics will adjust automatically. You can similarly convert our content to any other desired screen aspect ratio.
Compatible With Google Slides

Get This In WideScreen
You must be logged in to download this presentation.
PowerPoint presentation slides
This slide illustrates a graph of operating profit in US dollar and gross margin in percentage for engineering company illustrating key insights and changes in last five years from 2018 to 2022 Deliver an outstanding presentation on the topic using this Operating Profit And Margin Engineering Services And Consultancy Company Profile Ppt File Infographics. Dispense information and present a thorough explanation of Operating, Percentage, Engineering using the slides given. This template can be altered and personalized to fit your needs. It is also available for immediate download. So grab it now.
People who downloaded this PowerPoint presentation also viewed the following :
Operating Profit And Margin Engineering Services And Consultancy Company Profile Ppt File Infographics with all 7 slides:
Use our Operating Profit And Margin Engineering Services And Consultancy Company Profile Ppt File Infographics to effectively help you save your valuable time. They are readymade to fit into any presentation structure.
-
Visually stunning presentation, love the content.
-
I want to express my gratitude to SlideTeam’s presentation design services team for helping me create the best presentation of my life!


