


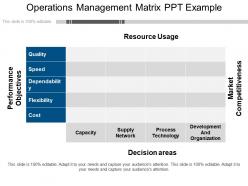
Operations management matrix ppt example


Try Before you Buy Download Free Sample Product
 Impress Your
 Audience
Editable
of Time


To avoid a bad presentation a good presentation process has to be followed. That is why when you use our Operations Management Matrix Ppt Example everything seems to fall into place.
People who downloaded this PowerPoint presentation also viewed the following :
Operations management matrix ppt example with all 5 slides:
Our Operations Management Matrix Ppt Example ensure everyone becomes aware. They help it to filter down.

FAQs for Operations management
So basically you're looking at four main things - processes, resources, metrics, and who's responsible for what. Map out your core stuff first (production, quality control, delivery) then see what resources you actually have to work with. People, equipment, budget, whatever. Metrics are where you'll catch problems before they get messy. Oh, and make sure someone owns each piece - nothing worse than everyone assuming someone else is handling it. I'd honestly just start with the basics and add the fancy performance tracking later once you've got the flow down.
Map your strategic goals to those four operations quadrants - efficiency, effectiveness, innovation, quality. Figure out which quadrant each objective fits into first. Here's the thing most companies screw up: they try being amazing at everything simultaneously (spoiler alert - total disaster). Pick 1-2 quadrants based on where you actually have an edge. Resources should follow that focus. Check in quarterly to see if your operations activities still match your strategy. Oh, and fix your KPIs if they're misaligned - like measuring only costs when your strategy screams innovation. That's just setting yourself up to fail.
Data analytics turns your operations matrix from a useless wall decoration into something that actually works. Real-time data shows you where things are getting stuck, helps predict demand, and catches inefficiencies you didn't even know existed. Honestly, the numbers will surprise you - some departments you thought were crushing it are actually creating problems. Set up dashboards that track your most important metrics automatically. I'd start with maybe 3-4 KPIs that directly affect your matrix results. Once you get those dialed in, you can always add more later. It's way better than guessing what's broken.
So basically, this matrix thing maps out your whole supply chain so you can see where stuff's getting stuck. Really useful for catching bottlenecks and figuring out which departments aren't talking to each other properly. You'll spot duplicate work pretty fast too. What I like about it is how it shows dependencies - like which tasks need to happen before others can start. Makes resource planning way easier. Honestly though, don't overthink it at first. Just map what you're doing now, then pick your worst 3 problems and tackle those. The rest will follow.
Ugh, people get SO weird about reporting changes - like seriously territorial. The main headaches? Role confusion and conflicting priorities between your functional vs project managers. Communication gets messy since info flows every direction now. Performance tracking becomes this whole complicated thing too. Honestly though, matrix structures aren't evil, just tricky. Start with one pilot team first - don't go crazy rolling it out everywhere. Over-communicate what's changing (I mean REALLY over-communicate). And definitely figure out clear escalation paths before conflicts hit, because they will.
So basically, companies look at what their customers actually care about and build everything around that. Manufacturing? They're obsessed with keeping costs down and quality up. Hospitals though - totally different game. Speed and flexibility matter way more because, I mean, you can't tell someone in the ER to come back tomorrow. Retail tries to balance cheap operations with being able to pivot when demand goes crazy. Tech companies will blow money on getting stuff out fast rather than pinching pennies. The whole trick is figuring out what gives you an edge in your market, then you design everything to nail those specific things.
Look, I'd break it down into four main areas. Efficiency stuff first - throughput, cycle time, how well you're using resources. Quality metrics are huge too: defect rates, customer satisfaction, rework percentages. Cost tracking keeps everyone sane - labor costs per unit, waste reduction, budget variance. Then delivery performance like on-time rates and lead times. Honestly though? Start small. Pick maybe 5-6 metrics max - I've seen people drown in dashboards they never actually use. Better to track fewer things well than have a million data points you ignore.
So the operations matrix works really well with Lean and Six Sigma - it shows you exactly where waste and variation are happening. Map out your operations first, then you'll know which processes need what. Some might need Lean tools like value stream mapping, others need Six Sigma's DMAIC thing. Honestly, I'd rather spend time fixing the right problems from the start than waste weeks on stuff that doesn't matter. The matrix gives you that current state view, then Lean cuts the waste while Six Sigma tackles quality issues. Just match the methodology to whether you're dealing with waste or defects.
Honestly, just start with Excel or Google Sheets - they're perfect for basic matrices and I still use Excel for most of mine since it's so damn flexible. Once you need fancier visuals, Lucidchart or Visio are solid choices. Monday.com and Smartsheet have built-in matrix templates if you're doing project management stuff. Tableau's amazing for heavy data viz but might be overkill at first. My advice? Map out your processes and KPIs in Excel first, then figure out what specialized tool you actually need. I made the mistake of jumping straight to expensive software before knowing my requirements. Don't overthink it initially.
So here's what I'd do - grab that operations management matrix and map out where your processes are failing customers. Survey them first about what's actually bugging them (not what you think is the problem). Then plot those pain points against what you can realistically fix. Honestly, most teams waste time optimizing stuff that doesn't matter to customers at all. Focus on the sweet spot where high customer impact meets doable changes. That matrix will show you exactly where to spend your energy first instead of just putting out random fires.
So basically it's like creating a shared language between departments - maps out who does what across different processes. Super helpful for spotting where teams step on each other's toes, like when marketing promises delivery dates but operations actually controls that timeline (classic mistake). Makes handoffs way clearer too. Finance knows exactly when they need procurement's input, IT sees how their changes mess with manufacturing. Honestly, the visual aspect is probably the best part - people finally see beyond their own department bubble. Next cross-departmental meeting, just walk through a process with it. You'll catch collaboration gaps right away.
Look, change management is what separates a working ops matrix from complete chaos. Your matrix can be perfect on paper, but if people don't actually follow it? You're screwed. The whole thing falls apart when teams ignore escalation paths or just go back to their old ways of doing stuff. I've seen this happen way too many times - beautiful processes that nobody uses. You've got to get people on board first. Explain why the matrix actually helps them (not just the company). Train everyone on their specific part. Otherwise you'll have this great framework that's basically useless.
Honestly, the biggest mistake is overcomplicating it from day one. I've watched people build these massive matrices that just sit there collecting dust because they're too overwhelming to actually use. Start simple - maybe 3-5 key areas max. Here's the thing though: don't build it alone in your office. Talk to the people who'll actually have to use this thing daily, not just management. Can't tell you how many times I've seen beautiful matrices that completely miss what front-line staff actually need. Oh, and update it regularly! Your operations change, so should your matrix. Get feedback early and tweak as you go.
So basically track your key metrics before and after - stuff like how long processes take, error rates, what resources you're actually using. Then do the math: implementation costs (software, training, all that time) versus the savings from being more efficient. Don't just look at hard numbers like labor costs though. Customer satisfaction scores matter too since happy customers = more money eventually. I'd set up some kind of dashboard to check monthly - honestly it's the only way you'll actually see if it's working or if you need to pivot your approach.
Honestly, there's some cool stuff happening with matrices right now. AI is making them way more predictive - you can actually spot bottlenecks before they hit instead of just tracking disasters. Real-time dashboards are finally replacing those awful static spreadsheets (thank god). Plus everyone's cramming sustainability metrics right into operational frameworks because stakeholders won't shut up about environmental impact. Oh, and teams can collaborate on the same data now without that whole "who has the latest version" nightmare. I'd start by figuring out where you can add predictive stuff first - that's probably gonna give you the biggest bang for your buck.
-
Really like the color and design of the presentation.
-
Very well designed and informative templates.